Forex Insight Pro 7.0
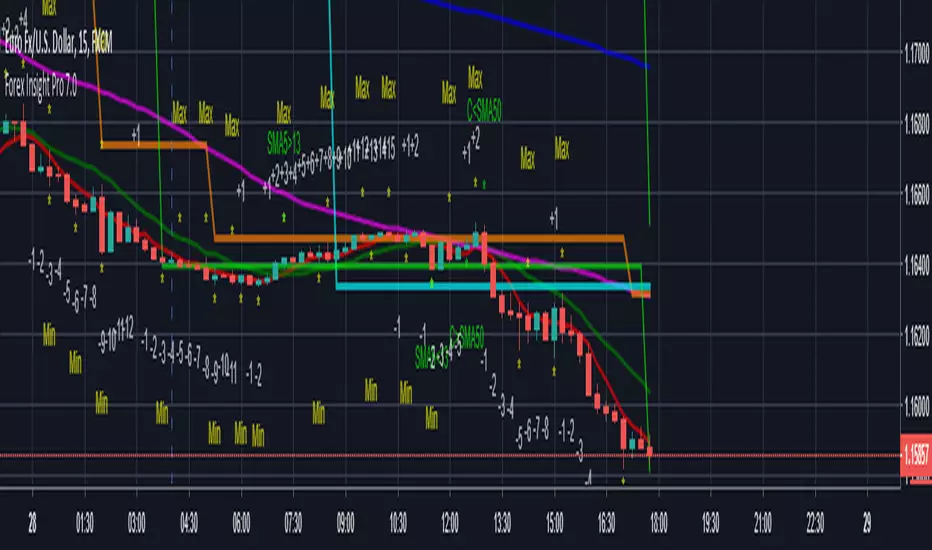
- Automatic CC(X) counting that compare the close of the right price bar to that of left price bar in a group of X consecutive bars such as CC(5,9) of a group of 5 bars will compare the close price of the right bar to the left bar (ignoring 3 bars in the middle). If the right bar closed higher, the count positive number would be printed above the bar. If the left bar closed higher, the count negative number would be printed below the bar. Nine consecutive series of up counts will define the lowest price as CC(5,9) support line and nine consecutive series of down counts will define the highest price as CC(5,9) resistance line. The count numbers and support / resistance lines are automatically printed on the graph if enabled.
- Show a set of simple moving average lines such as SMA5, SMA13, SMA50, SMA200, SMA800, if enabled. The color of SMA50 line (which is the same as the the middle line of Bollinger band (50,2) can be set to change based on increasing/decreasing values of itself, or of the MACD(12,26,9).
- Show Bollinger bands (50,2), if enabled.
- Show the high and low levels of the previous day, if enabled.
- Show the important time areas for Forex trading during Asian, London, and New York sessions, if enabled.
- Automatic printing of the events happening in the graph to remind the readers of parameters under considerations (if enabled) including:
- Print "SMA5>13" and "SMA5<13" for SMA5 crossed above and below SMA13.
- Print "SMA50>200" and SMA50<200" for SMA50 crossed above and below SMA200.
- Print "Max" and "Min" for local maximum and local minimum bars.
- Print "C75" and "C25" for the bars that closed above 75% and closed below 25% of its ranges.
- Print "C>SMA50" and "C<SMA50" for the bars that closed above and below SMA50.
- Print "RSI>30" and "RSI<70" for RSI(14) that crossed above 30 % and below 70 %.
- Print "MACD>0" and "MACD<0" for MACD(12,26,9) that crossed above and below zero.
- Print "MACD>Sig" and "MACD<Sig" for MACD(12,26,9) that crossed above and below their own SMA9.
- Print "Gap" for the up and down price gaps.
=================================================================================================
The source code of Forex Insight Pro 7.0 custom indicator is protected.
Only invited TradingView members can apply this indicator to their forex, crypto currency and stock price graphs.
Lifetime invitation is for 100 USD with free future upgrades and online supports.
Rental invitation is for 10 USD/month with free future upgrades and online supports.
Paypal, Bank transfer and Bitcoin payments are welcome.
A 7-day trial can be requested from the author (DrGraph or Nimit Chomnawang, PhD) via TradingView private chat
or in the comment field below.
=================================================================================================
How to install the script:
------------------------------
*Go to the bottom of this page and click on "Add to Favorite Scripts".
*Open a new chart and click on the "Indicators" tab.
*Click on the "Favorites" tab and choose "Forex Insight Pro 7.0".
*Right click anywhere on the graph, choose "Settings".
*In "Style" tab, choose the Dark Theme.
*In "Scale" tab, choose decimal places of 1/100000.
*In "Background" tab, uncheck "Indicator Arguments" and "Indicator Values".
*In "Timezone/Sessions" tab, choose your local time zone.
*At the bottom of settings window, click on "Template", "Save As...", then name this theme of graph setting for future call up such as "Forex Insight Pro".
*Click OK.
For free TradingView plan, you can add two more indicators to the chart. That means you may add RSI or MACD indicators with same parameters as those setup in Forex Insight Pro and Volume indicator to your graph. DrGraph regularly publish his educational ideas on using features provided in Forex Insight Pro for profitable investments. You can follow him for how to use the tools in trading stocks, forex, and binary options.
Script su invito
Solo gli utenti approvati dall'autore possono accedere a questo script. È necessario richiedere e ottenere l'autorizzazione per utilizzarlo. Tale autorizzazione viene solitamente concessa dopo il pagamento. Per ulteriori dettagli, seguire le istruzioni dell'autore riportate di seguito o contattare direttamente nimit.chomnawang.
TradingView NON consiglia di acquistare o utilizzare uno script a meno che non si abbia piena fiducia nel suo autore e se ne comprenda il funzionamento. È inoltre possibile trovare alternative gratuite e open source nei nostri script della community.
Istruzioni dell'autore
Please do not ask about access to use scripts in the script's comment section.
Declinazione di responsabilità
Script su invito
Solo gli utenti approvati dall'autore possono accedere a questo script. È necessario richiedere e ottenere l'autorizzazione per utilizzarlo. Tale autorizzazione viene solitamente concessa dopo il pagamento. Per ulteriori dettagli, seguire le istruzioni dell'autore riportate di seguito o contattare direttamente nimit.chomnawang.
TradingView NON consiglia di acquistare o utilizzare uno script a meno che non si abbia piena fiducia nel suo autore e se ne comprenda il funzionamento. È inoltre possibile trovare alternative gratuite e open source nei nostri script della community.
Istruzioni dell'autore
Please do not ask about access to use scripts in the script's comment section.