Liquidity Finder Library
You may intend to utilize the "Liquidity" detection capability in your indicators. Instead of writing it, you can import the "Liquidity Finder" library into your code. One of the advantages of this approach is time-saving and reduction in scripting errors.
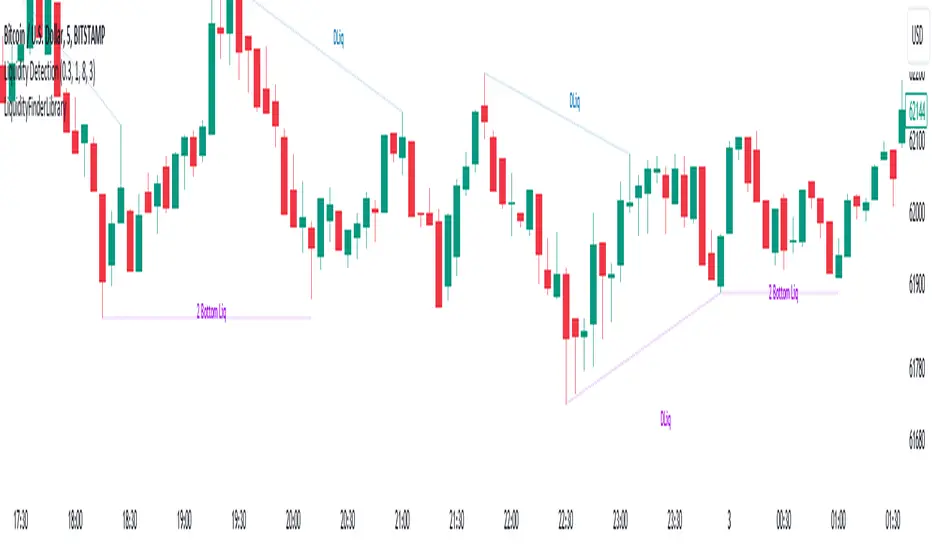
🔵Key Features
Identification of "Statics Liquidity"
Identification of "Dynamics Liquidity"
🔵How to Use
Firstly, you can add the library to your code as shown in the example below:
The parameters of the "LLF" function are as follows:
sPP: A float variable ranging from 0 to 0.4. Increasing this number decreases the sensitivity of the "Statics Liquidity Line Detection" function and increases the number of detected lines. The default value is 0.3.
dPP: A float variable ranging from 0.4 to 1.95. Increasing this number increases the sensitivity of the "Dynamics Liquidity Line Detection" function and decreases the number of detected lines. The default value is 1.
SRs: An int variable. By default, it's set to 8. You can change this number to specify the periodicity of static liquidity pivot lines.
SRd: An int variable. By default, it's set to 3. You can change this number to specify the periodicity of dynamic liquidity pivot lines.
ShowHLLs: A bool variable. You can enable or disable the display of "High Statics Liquidity Line".
ShowLLLs: A bool variable. You can enable or disable the display of "Low Statics Liquidity Line".
ShowHLLd: A bool variable. You can enable or disable the display of "High Dynamics Liquidity Line".
ShowLLd: A bool variable. You can enable or disable the display of "High Dynamics Liquidity Line".
🟣Recommendation
You can use the following code snippet to import Liquidity Finder into your code for time-saving.
Libreria Pine
In pieno spirito TradingView, l'autore ha pubblicato questo codice Pine come libreria open-source in modo che altri programmatori Pine della nostra comunità possano riutilizzarlo. Complimenti all'autore! È possibile utilizzare questa libreria privatamente o in altre pubblicazioni open-source, ma il riutilizzo di questo codice in una pubblicazione è regolato dal nostro Regolamento.
Free Forex, Crypto & Stock Trading tutorial (Forex School), access to ICT, Smart Money & Price Action:
tradingfinder.com/education/forex/
Declinazione di responsabilità
Libreria Pine
In pieno spirito TradingView, l'autore ha pubblicato questo codice Pine come libreria open-source in modo che altri programmatori Pine della nostra comunità possano riutilizzarlo. Complimenti all'autore! È possibile utilizzare questa libreria privatamente o in altre pubblicazioni open-source, ma il riutilizzo di questo codice in una pubblicazione è regolato dal nostro Regolamento.
Free Forex, Crypto & Stock Trading tutorial (Forex School), access to ICT, Smart Money & Price Action:
tradingfinder.com/education/forex/