OPEN-SOURCE SCRIPT
Dynamic EMA Crossover
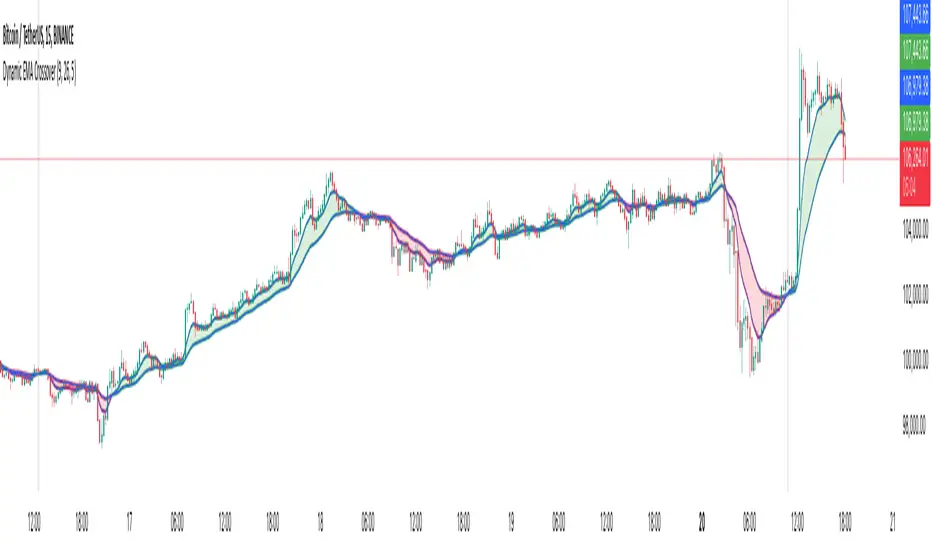
The Dynamic EMA Crossover indicator is designed to help traders identify trend transitions, visually understand market direction, and detect sideways consolidation zones. It simplifies decision-making by dynamically changing colors and highlighting areas of interest.
Key Features:
1. Dynamic EMA Crossovers:
• Uses two EMAs (default: 9 and 26[customizable]) to identify bullish and bearish trends.
• EMAs and the area between them turn green during bullish trends and red during bearish trends for easy visualization.
2. Sideways Market Detection:
• Automatically detects periods of market consolidation when EMAs overlap for 10 consecutive candles and the price movement remains narrow.
• Sideways zones are highlighted with grey background, helping traders avoid false breakouts and trendless markets.
3. Customizable Inputs:
• Adjust the lengths of the two EMAs and the sensitivity of the overlap detection to match your trading style and market conditions.
How It Works:
• Trend Identification:
• When the shorter EMA crosses above the longer EMA, a bullish trend is indicated.
• When the shorter EMA crosses below the longer EMA, a bearish trend is indicated.
• The indicator dynamically adjusts the colors of the EMAs and fills the area between them for clear trend visibility.
• Sideways Market Detection:
• When the shorter EMA and longer EMA stay close (within a customizable sensitivity) for a fixed period (hardcoded to 10 candles), the indicator identifies a sideways market.
• This feature helps traders avoid entering trades during choppy or indecisive market conditions.
Who Is This For?
This indicator is ideal for:
• Trend traders looking for clear signals of trend direction.
• Swing traders who want to avoid trading in sideways markets.
• Scalpers who need quick and reliable visual cues for short-term market behavior.
Use Cases:
1. Bullish/Bearish Trends:
• Enter trades in the direction of the trend as the crossover occurs and colors change.
2. Sideways Zones:
• Avoid trades during periods of consolidation and wait for a clear breakout.
Mashup Logic:
This indicator combines:
1. EMA Crossovers:
• A tried-and-tested method for trend detection using two moving averages.
• Dynamic visual cues for bullish and bearish market phases.
2. Sideways Market Detection:
• Innovative logic to highlight sideways zones based on EMA overlap and price range analysis.
• Helps reduce noise and avoid trading during trendless periods.
3. Customization and Flexibility:
• Fully adjustable EMA lengths and overlap sensitivity to adapt to different markets and trading styles.
Script open-source
In pieno spirito TradingView, il creatore di questo script lo ha reso open-source, in modo che i trader possano esaminarlo e verificarne la funzionalità. Complimenti all'autore! Sebbene sia possibile utilizzarlo gratuitamente, ricorda che la ripubblicazione del codice è soggetta al nostro Regolamento.
Thanks.
TradeTech Analysis
Telegram Channel - t.me/Tradetech2024
Youtube Channel - youtube.com/@TradeTechAnalysis
Website - tradetechanalysis.com/
TradeTech Analysis
Telegram Channel - t.me/Tradetech2024
Youtube Channel - youtube.com/@TradeTechAnalysis
Website - tradetechanalysis.com/
Declinazione di responsabilità
Le informazioni ed i contenuti pubblicati non costituiscono in alcun modo una sollecitazione ad investire o ad operare nei mercati finanziari. Non sono inoltre fornite o supportate da TradingView. Maggiori dettagli nelle Condizioni d'uso.