OPEN-SOURCE SCRIPT
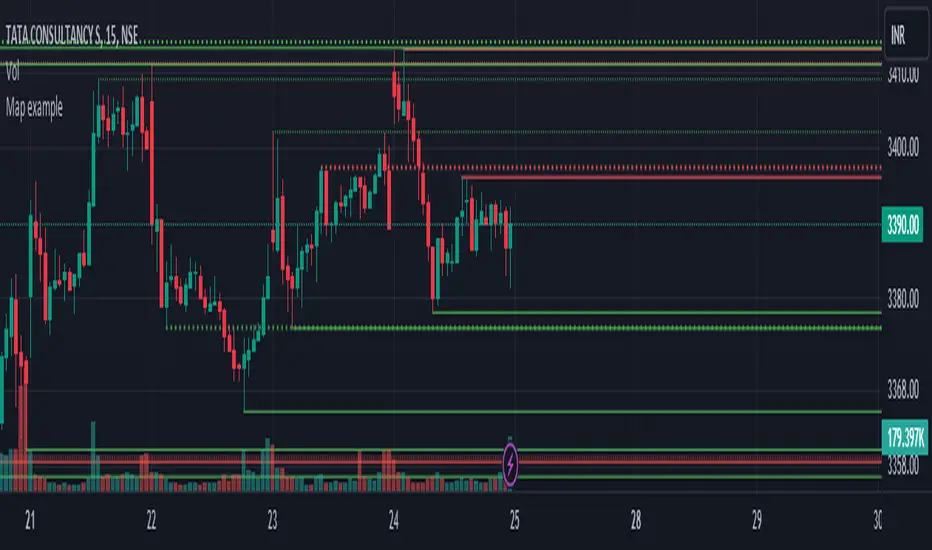
Map example
Using Maps collections:
This code manipulates support and resistance lines using maps collection.
We normally maintain array/udt of lines and related properties to segregate lines as support and or resistance.
With introduction of maps the same can be achieved without creating lines array/udt.
What does this code do:
1. Plot support and resistance lines based on ta.pivothigh() and ta.pivotlow()
2. When price crosses support line, the line is marked as resistance and color is changed to resistance line color and style is changed to dotted line (support turned resistance). Also the width of the line is set based on number of crosses. Finally the support/resistance line is removed when number of times price crossing the line reaches max allowed crosses (input parameter)
Where maps are used:
1. map_sr_cross - Number of times the support/resistance lines has been crossed by price
2. map_sr_type - R=resistance, S=support
3. color_map - color for support and resistance lines
4. style_map - line styles. Support/resistance lines as solid style and support turned resistance/resistance turned support lines as dotted style.
Script open-source
In pieno spirito TradingView, il creatore di questo script lo ha reso open-source, in modo che i trader possano esaminarlo e verificarne la funzionalità. Complimenti all'autore! Sebbene sia possibile utilizzarlo gratuitamente, ricorda che la ripubblicazione del codice è soggetta al nostro Regolamento.
Declinazione di responsabilità
Le informazioni ed i contenuti pubblicati non costituiscono in alcun modo una sollecitazione ad investire o ad operare nei mercati finanziari. Non sono inoltre fornite o supportate da TradingView. Maggiori dettagli nelle Condizioni d'uso.