PROTECTED SOURCE SCRIPT
Aggiornato Fundamental Fair Value Range
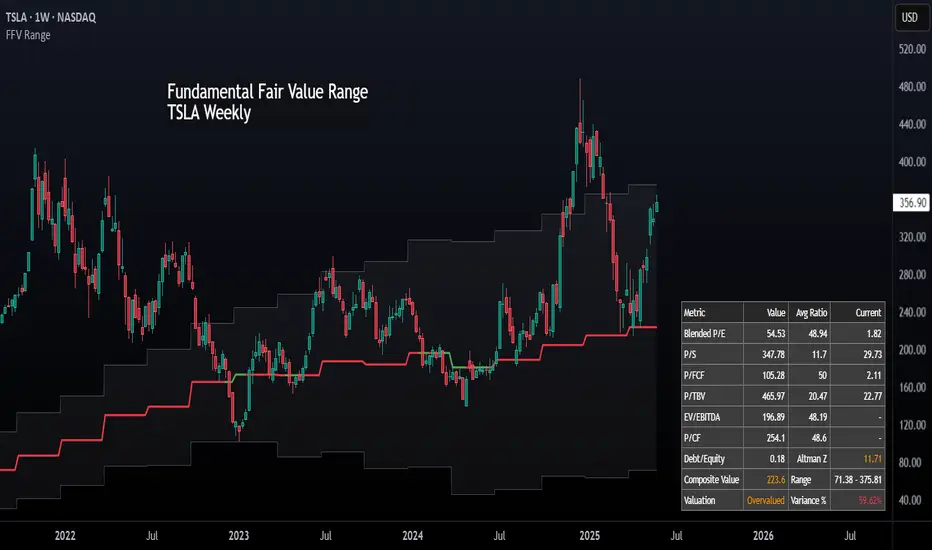
Fundamental Fair Value Range (FFV Range)
Purpose:
This indicator aims to estimate a company's intrinsic fair value range based on its historical valuation patterns and current financial health. It analyzes multiple fundamental valuation metrics to provide a comprehensive perspective, helping traders identify potential overvaluation or undervaluation relative to the company's own historical norms.
How It Works:
Features & Customization:
How to Use:
Considerations:
Purpose:
This indicator aims to estimate a company's intrinsic fair value range based on its historical valuation patterns and current financial health. It analyzes multiple fundamental valuation metrics to provide a comprehensive perspective, helping traders identify potential overvaluation or undervaluation relative to the company's own historical norms.
How It Works:
- Data Collection: The script gathers historical financial data for the company over a user-defined number of past quarters (Number of Quarters to Average). It retrieves key metrics like Earnings Per Share (EPS), Book Value Per Share (BVPS), Sales Per Share, Free Cash Flow (FCF) Per Share, Tangible Book Value Per Share (TBVPS), EBITDA, Operating Cash Flow (OCF) Per Share, Enterprise Value (EV), and Net Debt. It also pulls current TTM (Trailing Twelve Months) data, forward estimates (EPS, Sales), risk metrics (Debt-to-Equity, Altman Z-Score), and dividend yield.
- Historical Ratio Calculation: For each of the past quarters where data is available, the script calculates standard valuation ratios (P/E, P/B, P/S, P/FCF, P/TBV, EV/EBITDA, P/CF) using the closing price at that time and the relevant financial data. Ratios are capped (Maximum Ratio Cap) to prevent extreme outliers from skewing results.
- Central Tendency: The script calculates the historical central tendency (either the median or mean, selectable by the user) for each valuation ratio based on the collected historical data points. Median is generally preferred to reduce the impact of outliers, but the mean option is available.
- Individual Metric Fair Values: Using the current financial data (TTM EPS, BVPS, Sales/Share, etc.) and the calculated historical average ratio, the script estimates a fair value based on each individual metric. For example:
P/E Fair Value = Current EPS * Historical Average P/E Ratio
P/S Fair Value = Current Sales Per Share * Historical Average P/S Ratio
(...and so on for P/B, P/FCF, P/TBV, and P/CF.) - Forward-Looking Adjustments & Blending:
P/E: Calculates fair value using both TTM EPS and Forward EPS estimates. These two values are then blended (averaged) to incorporate future expectations. If only one is available, that one is used.
EV/EBITDA: Calculates fair value based on TTM EBITDA and also based on estimated future EBITDA (derived from Sales Estimates and historical EBITDA margin). These are then blended. The calculation converts the Enterprise Value back to an estimated equity value per share by subtracting Net Debt.
P/S: Also calculates a forward-looking P/S fair value using Sales Estimates, which is considered alongside the TTM version when weighting. - Weighted Composite Fair Value:
The script combines the individual fair value estimates into a single composite value using a weighted average.
User-Defined Weights: You assign weights to each metric (P/E, P/S, P/FCF, P/B, P/TBV, EV/EBITDA, P/CF) via the script settings.
Dynamic Weighting: The weights for P/E, P/S, and P/FCF can be set differently depending on whether the company's current TTM EPS is positive or negative. This allows the model to emphasize sales or cash flow metrics more heavily for unprofitable companies, where P/E is less meaningful. - Risk Adjustment: The composite fair value is adjusted downwards (multiplied by 0.9 for each condition met) if:
Debt-to-Equity ratio exceeds 1.5 (indicating higher leverage risk).
Altman Z-Score is below 1.8 (indicating higher bankruptcy risk). - Dividend Adjustment: The risk-adjusted fair value is then potentially increased based on the company's dividend yield. The yield is added to the value (up to a maximum adjustment of 5% - MAX_DIV_ADJ) to reflect the value returned to shareholders via dividends. Final Fair Value = Risk-Adjusted Value * (1 + Capped Dividend Yield).
- Confidence Range: A range is calculated around the Final Fair Value. This range is determined by the standard deviation of the individual fair value components that were actually used (had valid data and positive weights) in the composite calculation. A wider range suggests less agreement between the different valuation methods.
- Valuation Signal: The script compares the current closing price to the calculated Final Fair Value and the Confidence Range, using Average True Range (ATR) based thresholds near the fair value:
Very Undervalued: Price is below the Lower Bound of the confidence range.
Undervalued: Price is below the Final Fair Value minus an ATR-based buffer.
Fairly Valued: Price is near the Final Fair Value (within the ATR buffer).
Overvalued: Price is above the Final Fair Value plus an ATR-based buffer.
Very Overvalued: Price is above the Upper Bound of the confidence range.
Features & Customization:
- Multi-Metric Analysis: Incorporates P/E, P/B, P/S, P/FCF, P/TBV, EV/EBITDA, and P/CF.
- Historical Basis: Choose Median or Mean for historical ratio calculation and set the lookback period (number of quarters).
- Flexible Weighting: Customize the importance of each metric. Crucially, set different weights for P/E, P/S, and P/FCF based on profitability (EPS > 0 or EPS ≤ 0).
- Forward Data Integration: Blends TTM and forward estimates for P/E and EV/EBITDA.
- Risk & Dividend Adjustments: Automatically discounts for high debt/low Altman Z-score and premiums for dividend yield (capped).
- Clear Visualization:
Plots the Final Fair Value line on the chart.
Plots the Upper and Lower Confidence Bounds (based on standard deviation).
Fills the area between bounds to show the Confidence Range. - Informative Data Table:
Displays the calculated fair value for key individual metrics, their historical average ratios, and current underlying financial values (like EPS, BVPS).
Shows risk metrics (Debt/Equity, Altman Z).
Clearly presents the Final Composite Fair Value, the Confidence Range, the current Valuation Signal (e.g., "Undervalued"), and the percentage difference between the current price and the fair value.
Simple/Full Mode: Option to display a condensed table with only the summary results or the full detailed breakdown. - Display Options: Adjust table position, text size, and switch between light/dark themes for better readability.
How to Use:
- Apply the indicator to a stock chart on TradingView.
- Configure Settings:
Go into the indicator settings (Gear Icon ⚙️).
- Calculation Parameters: Set the Number of Quarters to Average (e.g., 20 for 5 years) and choose Use Mean Instead of Median if desired. Adjust Maximum Ratio Cap if needed.
- Valuation Weights: This is crucial. Adjust the weights based on the industry, company maturity, and your valuation philosophy. Consider giving higher weights to metrics commonly used for that sector. Use the separate weights for positive/negative EPS scenarios thoughtfully. For instance, for unprofitable tech stocks, you might assign zero weight to P/E and higher weights to P/S or EV/EBITDA (negative EPS weights).
- Display Options: Choose table mode, position, size, and theme. - Interpret the Output:
- Observe the plotted Fair Value line relative to the current price.
- Note the Confidence Range (shaded area). A wider range indicates more uncertainty or divergence between valuation methods.
- Check the Valuation status in the table (e.g., "Undervalued", "Overvalued").
- Use the % from Fair Value in the table for a quick gauge of deviation.
- Review the individual metric fair values in the full table mode to understand which factors are driving the composite value.
Considerations:
- Historical Data Dependence: The model heavily relies on past valuation patterns repeating. Significant changes in a company's business model, market, or industry may make historical ratios less relevant.
- Parameter Sensitivity: The calculated fair value is sensitive to the chosen weights and the historical lookback period. Experiment and use values that make sense for your analysis style and the specific stock.
- Data Quality: The accuracy of the output depends entirely on the accuracy and availability of the underlying financial data provided by TradingView for the specific ticker. Data may be missing or contain errors for some stocks.
- Not Financial Advice: This indicator provides a model-based estimation of fair value. It should be used as one tool among many in your investment decision-making process, not as a sole buy/sell signal. Always conduct thorough due diligence.
Note di rilascio
- Added forward-P/S and EV/Revenue fair-value metrics with user-configurable weights
- Switched default to mean instead of median for historical ratios
- Applied EPS-growth adjustment to P/E weighting
- Consolidated table-position logic into a single inline expression
Note di rilascio
Added the option to hide everything except the tableScript protetto
Questo script è pubblicato come codice protetto. Tuttavia, è possibile utilizzarle liberamente e senza alcuna limitazione – ulteriori informazioni qui.
Declinazione di responsabilità
Le informazioni e le pubblicazioni non sono intese come, e non costituiscono, consulenza o raccomandazioni finanziarie, di investimento, di trading o di altro tipo fornite o approvate da TradingView. Per ulteriori informazioni, consultare i Termini di utilizzo.
Script protetto
Questo script è pubblicato come codice protetto. Tuttavia, è possibile utilizzarle liberamente e senza alcuna limitazione – ulteriori informazioni qui.
Declinazione di responsabilità
Le informazioni e le pubblicazioni non sono intese come, e non costituiscono, consulenza o raccomandazioni finanziarie, di investimento, di trading o di altro tipo fornite o approvate da TradingView. Per ulteriori informazioni, consultare i Termini di utilizzo.