DP_ORB Entry & Exit IndicatorDisclaimer:
This indicator is for educational purposes only. It does not constitute financial advice. Always do your own research and manage your risk. Also, I cannot take full credit for 'ORB' as its a well known strategy amongst many traders, but I do need to give a special shout out to @TheBigDaddyMax for putting me on to this.
DP_ORB Entry & Exit Indicator
Description:
The DP_ORB Entry & Exit Indicator is a powerful tool designed for traders who utilize the Opening Range Breakout (ORB) strategy on the NYSE session. This indicator visually identifies the initial volatility window of the trading day, by marking the 15m High, and 15m Low into a ORB Box, & then tracks breakout opportunities, and provides clear, dynamic trade management levels—all directly on your chart.
Key Features:
Automatic Opening Range (ORB) Box:
Identifies and plots the high and low of the user-defined opening range (default 9:30–9:45 NYSE) for visual reference and strategy foundation.
Breakout Entry Signals:
Automatically detects and marks long or short breakout entries when price closes above or below the ORB range, with additional momentum confirmation.
Dynamic Stop Loss:
Stop loss is intelligently set to the previous bar’s low for long trades (or high for shorts), adapting to market structure at entry.
Take Profit Targets:
Up to three fully adjustable take-profit levels are plotted, calculated as percentages from entry, supporting progressive trade management.
Visual Trade Management:
Entry, stop loss, and take profit levels are displayed as extending dashed lines from entry point to the current bar, with labels always shown just to the right of price for clarity on all timeframes.
Automatic Reset and Cleanup:
Visuals and logic reset daily and upon exit, ensuring a clean, uncluttered chart experience.
How to Use:
Set your preferred opening range time and take profit levels in the settings.
Wait for a breakout and confirmation during the NYSE session.
Use the on-chart lines and labels to manage your trade according to your risk and strategy plan.
Best For:
Day traders and scalpers seeking a disciplined, visual, and fully-automated approach to opening range breakout trading.
15min

Simple Sessions & LevelsWhat this indicator does:
This script marks out two essential types of price levels for intraday and swing traders:
The high and low of a customizable 15-minute opening range after the market/session open.
The previous day’s high, midpoint (“halfback”), and low.
How it works:
The script lets you set the session start time (hour and minute) to match your market.
It then calculates the high and low of the first 15 minutes after the session opens and plots those as solid lines.
It also plots the prior day’s high, halfback (midpoint), and low on your chart for easy reference.
Each line and each label can be toggled on or off independently in the settings for maximum customization.
Colors for each level are also fully customizable.
How to use it:
Add the script to your chart.
Set the session start hour and minute to match the open of the market or instrument you trade.
Choose which levels and labels you want displayed by using the toggles in the settings.
The indicator will automatically draw the session range and prior day levels for you.
Use these lines as reference for key support, resistance, and potential trade entry/exit points.
What makes it unique and useful:
This tool combines a flexible session opening range with classic daily reference levels in one package. You have complete control over which levels and labels are shown, making it adaptable for any trading style. It’s especially useful for day traders who want to quickly identify volatility windows and the most important price levels from the previous session.

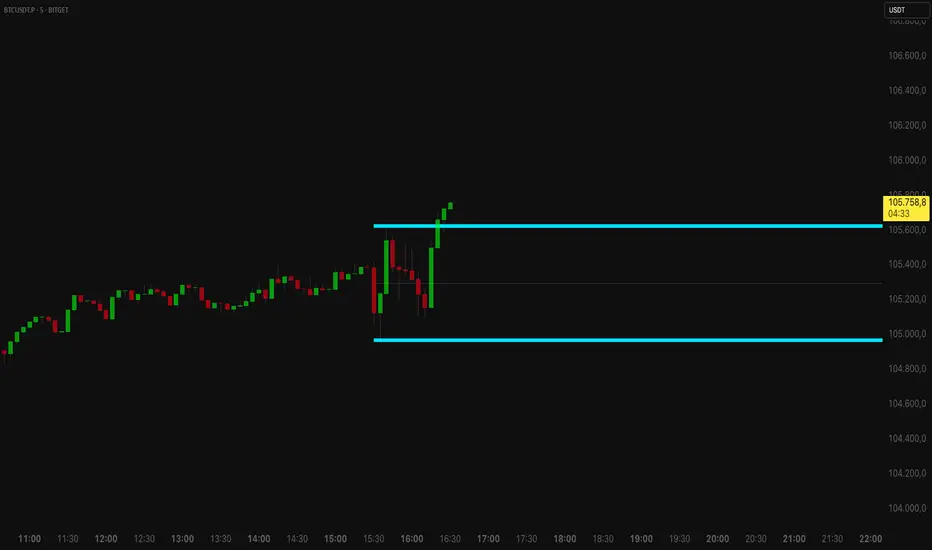
Opening Range Breakout (15 mins Range)Take the guesswork out of your trading with the Opening Range Breakout Pro script. This tool automatically marks the high and low of the first 15 minutes of the NYSE session, then highlights the first candle to break out above or below this range—removing ambiguity from your trade entries.
The opening range is one of the most powerful concepts in day trading. By identifying the price range set during the market’s first minutes, you gain a clear framework for your trades. When price breaks out above the range, it often signals a strong bullish move; a break below signals bearish momentum. This script visually marks these moments, so you can react quickly and confidently.
Why use Opening Range Breakout Pro?
• Defined Entry and Exit Points: The script gives you clear, objective breakout levels—no more guessing when to enter a trade.
• Removes Emotional Trading: With visual cues for breakouts, you can follow a systematic approach and avoid hesitation or FOMO.
• Backtested, Time-Tested Strategy: The opening range breakout has been used by professional traders for decades to capture early trends and maximize profit potential.
• High Reward Potential: By capitalizing on the volatility and momentum of the opening session, traders often catch the best moves of the day.
• Easy to Use: Just add to your chart—no configuration needed. The script works on any NYSE stock, on a 5-minute chart.
How it works:
• Draws the opening 15-minute high and low as orange lines.
• Labels the range prices for quick reference.
• Marks the first candle to close above the range with an orange ▲, and the first to close below with an orange ▼.
Take control of your trading day, remove uncertainty, and trade with confidence—just like the pros.

15Min Opening Range & Midline (UTC+2) This TradingView script draws the 15-minute Opening Range of the day based on a user-defined start time and plots the high, low, and midline of this range. It works by capturing the high and low of the first 15 minutes of the session, and then extending them for the rest of the trading day. The midline is calculated as the average of the high and low values.
Key Features:
User-configurable start time: Define the hour and minute for when the opening range should start based on your local time zone.
Line customization: Choose the color and line style (solid, dashed, dotted) for the high, low, and midline.
Easy-to-read visual representation: The high and low lines extend across the chart from the range start, with the midline placed in the center.
Dynamic updates: The indicator resets at the start of each new trading day and updates the opening range lines accordingly.
Perfect for:
Traders looking to monitor the initial market range during the first 15 minutes of trading.
Identifying key support and resistance levels based on early price action.
Providing a midline to assess market bias and potential breakouts.
Notes:
The indicator calculates everything based on the local time zone you define and automatically adjusts to your desired start time.
It will not redraw lines; once drawn, they remain on the chart until the next session.
OpeningRange (Trading_Tix)Purpose:
The indicator highlights the high, low, and middle (50%) price levels of a specified session's opening range. These levels can serve as key support and resistance zones for trading strategies. The indicator also offers options to extend these levels beyond the session into later timeframes, making it useful for tracking breakout or trend continuation setups.
Key Features:
1. Session Detection:
The indicator identifies a specific session period using the user-defined Session Time. It calculates the start time, high, and low prices during this period:
rangeTime: Defines the session time range (default: 5:00 PM to 2:59 AM).
extendTime: Defines the extended time range where lines/backgrounds can be prolonged.
2. Opening Range Calculation:
High (high_val) and Low (low_val)**:
Tracks the highest and lowest prices during the session.
Middle Line:
A midpoint is calculated by averaging high_val and low_val.
3. Visual Elements:
Horizontal Lines:
Drawn at the high, low, and middle levels.
Customizable in width and color.
Shaded Background Box:
Covers the range between high and low prices.
The box’s color and transparency can be adjusted.
Line and Box Extension:
Optionally extends these elements into the extended time range.
4. Customization:
Users have the flexibility to:
Toggle visibility of lines, middle line, and background box.
Adjust colors, line thickness, and style.
Enable or disable the extension of lines and backgrounds into the extended period.
How It Works:
Initialization:
The script initializes variables to store range data (startTime, high_val, low_val) and drawing objects (lines, boxes).
It detects whether the current bar falls within the session (inSession) or extended timeframe (inExtend).
Plotting:
During the session:
Deletes previous lines and boxes from prior sessions.
Draws new lines at the high, low, and middle levels.
Creates a background box covering the range, if enabled.
During the extended period:
Extends the session lines and box, if the user has opted for extensions.
Updates:
Continuously adjusts the high/low values and updates the lines as new price data arrives.
Use Cases:
This indicator can be valuable for traders who:
Use the opening range to identify potential breakout zones.
Trade based on price consolidation within the range.
Want a visual representation of key price levels to plan entries and exits.
Would you like help refining this script further or adjusting its settings to match your trading style?

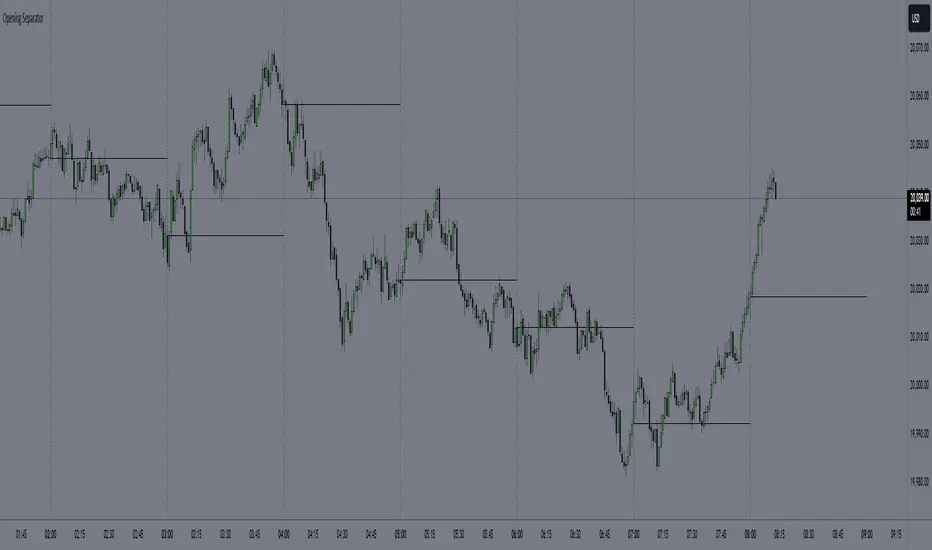
Hourly Separator + Opening LineThis indicator shows the vertical and horizontal opening lines for the hourly timeframe.
Also has options to choose a different opening time:
- 1 Hour
- 30 Min
- 15 Min
- 10 Min
- 5 Min
Fractal Potential EntryFractal Potential Entry combine 3 ema and fractal and follow the strategy from Trade Pro on YouTube:
www.youtube.com
with good performance on the 1 minute chart
Feature:
Alert Sell and buy Potential Entry
Happy Trading

crypto futures hourly scalping with ma & rsi - ogcheckershi to all lovable traders,
hereby i want to share a combination of trade ideas for scalping
i've chosen hourly timeframe
indicators used: moving averages and rsi
moving averages:
ema 3, ema 5, ema 7
sma 3, sma 5, sma 7
daily_ema_3, daily_ema_5
daily_ema_5, daily_sma_5
rsi:
rsi 7, rsi 14, rsi 26
daily_rsi_7, daily_rsi_14, daily_rsi_26
as per the analysis over moving average behavioral patterns & rsi movements, useful points are given below which will be helpful while choosing good entry points & exit points,
strategical points for LONG:
* when ema3 crosses above sma3 - green candles start to form
* it's followed by ema5 > sma5 and ema7 > sma7
* when ema3 crosses down sma3 - it's considered as an indication of exit
* if rsi supports then can wait for ema5 crossing down sma5
* as similar, when daily_ema_3 crosses above daily_sma_3, its an higher timeframe bullish indication, so the lower timeframe entries inside this higher timeframe is a sure shot confident entry
* for LONG always take entries when rsi_14 < 30 or 25 else check rsi_7 < 25 or below
* as along the above, bullish CANDLE patterns like bullish engulfing , morning star is been used for entry at lower levels
* so here i've used OPEN as rsi_source in majority
* exit points also indicated at high_rsi and moving average crossunders or reverse crossovers
* for SHORTING, the above said ideas can be used in viceversa
* inputs in the indicator were tailored for users needs so that you will enjoy the magics of customization
if i am wrong in anyways regarding the above indicator strategy, please forgive me and help me improve in this aspect by commenting.
after few more studies and analysis and mainly QUERIES & COMMENTS, i'm planning to backtest these strategies here in tradingview.
also if these strategies are coded in python, we can link it to Binance Futures Algo or Bot Trading.
thankyou for this opportunity,
thanks to tradingview and pinecoders
thanks to Pranab (for 365MA)
thanks to Gandalf (for inspiring)
Special Thanks & Love to Chartbank for Everything

Intraday FOREX london scalperThis forex System is only for ECN Broker Account.
Pairs: Major with spread < 0.0001 (EUR/USD).
Setup:
Wait for the market to make to 60 minute from the open.
If the market is near the intraday high be prepared to go short
If the market is near an intraday low for the same time period, then be prepared to go long.
Rules for entry
For sell setups: Enter on sell stop 1 pip from low of the last 15 min bar.
For buy setups: Enter in buy stop 1 pip from high of the last 15-minute bars.
Rules for exit
Take profit: Close out positions on 6 pips profit..
Stop Loss: Close out on 5 pips loss or if trade takes more than 1 minute.
