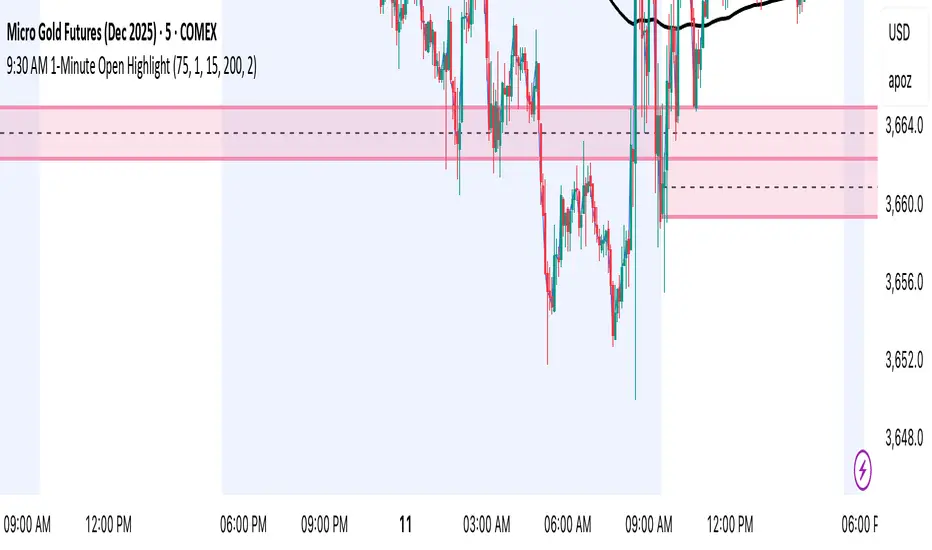
9:30 AM 1-Minute Open HighlightThis script highlights the 1st 1 min candle of the NY session (9:30 AM candle). This area can be used for retests, entries, targets, etc. I will continue making updates to this. This script allows you to highlight the shaded box to the color of your choosing, choose how many days the first 1 minute candle will be highlighted, as well as other customizable features. Please let me know if you have any suggestions. Thanks.
1minute
Muti TimeFrame 1st Minute High and a LowThis Pine Script code is designed to plot the high, close, and low prices at exactly 9:31 AM on any timeframe chart. Here's a breakdown of what the script does:
Inputs
Define the start time of the trading day (default: 9:30 AM)
Define the end time of the trading day (default: 4:00 PM)
Toggle to display daily open and close lines (default: true)
Toggle to extend lines for daily open and close (default: false)
Calculations
- Determines if the current bar is the first bar of the trading day (9:30 AM)
- Retrieves the high, close, and low prices at 9:31 AM for the current timeframe
- Plots these prices as crosses on the chart
- Draws lines for the 4 pm close and 9:30 am open, as well as lines for the high and low of the first candle
- Calculates the start and end times for a rectangle box and draws the box on the chart if the start price high and low are set
Features
- Plots the high, close, and low prices at exactly 9:31 AM on any timeframe chart
- Displays daily open and close lines
- Extends lines for daily open and close (optional)
- Draws a rectangle box around the first candle of the day (optional)
Markets
- Designed for use on various markets, including stocks, futures, forex, and crypto
This script is useful for traders who want to visualize the prices at the start of the trading day and track the market's movement throughout the day.

1 Minute Scalping IndicatorThis is a 1 Minute Scalping Indicator based purely on price action of the current candle compared to the previous candle so there is no lag from using other indicators. It works great on all timeframes, but is designed for getting in and out of positions quickly using the 1 minute chart. The candles will paint according to the direction the price is currently moving in, which is a great way to help reduce anxiety while watching the candles bounce back and forth.
HOW TO USE
It has Scalp Mode and Swing Mode. Both modes use the exact same price action parameters for signals, but Swing Mode will only give signals when the price action parameters are met AND the close is higher than the previous high for bull signals or when the close is lower than the previous low for bear signals.
This scalping indicator will show green up arrows when it detects bullish price action and red down arrows when it detects bearish price action. It will show a yellow arrow if the bullish/bearish price action conditions are met, but it detects a candle pattern that may be a weak signal such as small candle body, large wicks, etc. When this happens, make sure to wait for the next candle to show confirming price action before following the signal. You can also turn the signals off and use only the candle coloring if you prefer cleaner charts.
You can change the candle colors it uses within the input settings, as well as the color of the signal arrows to suit your preferences. You can also turn off the candle coloring if you prefer normal candles. If you are using the indicator’s candle coloring, make sure you go to your chart settings(gear icon top right) and in the symbol tab, turn off body, borders and wick for this to show up properly.
This scalper also includes alerts for bull and bear signals that can be set to alert you on any market and timeframe.
SCANNER
We also made a higher timeframe scanner that uses this same price action formula and shows you if higher timeframes are currently bullish or bearish in real time. It’s titled Higher Timeframe Price Action Scanner and can be found on our profile. I strongly recommend using both of these together to get an idea of the overall trend on longer timeframes. You can also use two of the scanners and set them to two tickers that move together or opposite of each other(like SQQQ and TQQQ) for even more market insight on your ticker's immediate direction.
MARKETS
This 1 Minute Scalping Indicator works well on any market such as stocks, crypto, forex, futures, etc.
TIMEFRAMES
This indicator is designed for scalping on the 1 Minute timeframe, but it works well on all timeframes, since it is using price action to give signals.
TIPS FOR BEST RESULTS
We recommend pairing this indicator with another support & resistance or moving average combo to find great entry areas and use the price action signals as confirmation when price bounces off of those areas. We also recommend using the Higher Timeframe Price Action Scanner with this so you can see the overall trend of higher timeframes on your chart and trade in the direction of the trend.
Scalp Mode
Swing Mode
Candle Coloring Only - No Signals - Scalp Mode
Candle Coloring Only - No Signals - Swing Mode

Agressive ScalperThis indicator I thought after a while of research and decided to code for people that wants to scalp on low time frames. It's recommended to use it in 1 to 5 min timeframes. It uses ATR, Past high and lows and stochastic overbought and oversold zones along with some consolidation code to avoid fast swings. I also added Take Profit and Stop Loss signals based on slow ATR values. I may add more features later on if people find it useful.

EMA RSI ATR Hidden Div Strat - 1 MinHey there!
Hereby I present you the EMA RSI Lowest Low Hidden Divergence strategy, which I discovered on a youtube channel.
He has tested the strategy hundreds of times manually, herewith I try to automate the whole thing.
Since I use the strategy with a bot, it can only enter long positions for now. But in the future I will add the possibility to trade short positions.
The strategy was tested with BTC/ USDT in 1m chart (8 days). The values must be adjusted depending on the timeframe and coin.
-----------------------------------------------------------------------------------
How does the strategy work?
First of all, we need a bullish hidden divergence.
Once this is detected, the following parameters are checked:
The 50 EMA must cross the 250 EMA .
Then, the candle must close above the 50 EMA .
The K line of the RSI STOCH indicator need to crosses the D line.
If the next candle closes above the 50 EMA , a long position is opened.
The stop loss is determined with the "lowest low/highest high lookback".
The profit factor is multiplied by the value of the lowest low/highest high lookback.
The results of the strategy are without commissions and levers.
If you have any questions or feedback, please let me know in the comments.
In the future I will add other types of stop loss / take profits. (ATR; %; eg.)
I wish you good luck with the strategy!

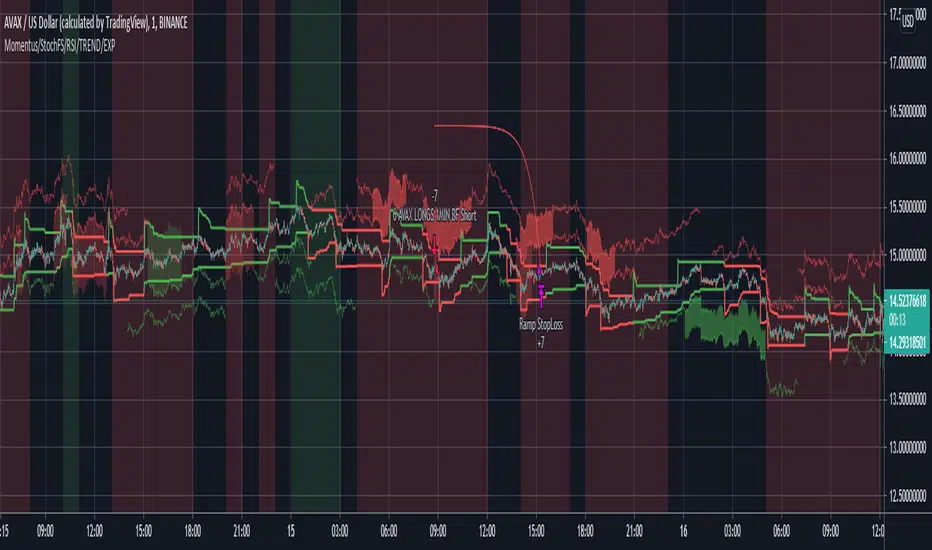
MACD/RVSI/Stoch/RSI/EXP(Drawdown)I have been trying for several months to get a script to work on the 1min and this one gives some good backtest results. This script will also work on higher timeframes however, I've not extensively tested on higher timeframes. My aim was to get results on about 20 crypto coins then run the 1min bots in parallel looking for small frequent profits across all the coins. If you would like me to try and fit backtest results to any coin or pair on any timeframe please do get in touch anytime.
It's based on several indicators which are combined and then a newish way for the stop loss to implement based on an exponential rising which limits the time in each trade unless the price moves in the direction of the trade. The other useful feature is drawdown minimization which previously made all of my 1minute bot attempts non-practical due to differences between backtesting and actually running the bot(s) live.
Its possible at the top to paste in strategy comments which can be used through web-hooks for auto trading bots. Leaving these blank just defaults to the pre-programmed comments that provide some indication of why a trade was exited.
It is possible to select for Short and/or Long trades. Note however, that there are exponential markers on the charts for both long and short trades in any setting. I found that this way the bot worked well with regards to timing.
The next part of the user interface settings gets a bit tricky so try and use the sample parameters provided below. For example, select a crypto coin then try some of the options below until a reasonable backtest result in obtained (or select the best from the parameter groups tested) then move down the settings interface to optimise with the remaining settings.
So 'Use MACD/RVSI', 'RSI clause' and 'Use Stochastic' are set to true for the below sample settings (1min timeframe).
MACD/RVSI Confluence Resolution (1min, 2min, 5min, 10min, 1hour)
Timeframe RSI (1min, 2min, 3min, 15min, 1hour)
FastStoch, SlowStoch (1min, 45min: 5min, 30min: 1min, 1hour: 5min, 1hour)
Eg. for FTX:ETHPERP (MACD/RVSI Confluence Resolution=1hour, Timeframe RSI= 1min, FastStoch = 1min, SlowStoch = 45min)
Setting the timings is tricky - there is a lot going on. Have a look at the chart and select/deselect the options. The MACD/RVSI Confluence Resolution shows red and green vertical regions on the chart background. The Timeframe RSI colors the candle bodies red and green. These go green if the RSI crossed over 31% or red in the RSI crossed under 69%. The MACD/RVSI Confluence Resolution is explained in more detail in one of my other scripts. Then the Slow Stoch colors above and below the price action with red or green lines depending if on an uptrend or downtrend (approximately). Where there is also an up/down trend on the faster timeframe stoch there are vertical shaded fill regions between the slow stop above/below lines.
With all the above conditions selected to represent the data (looking at strategy backtest results whilst adjusting) there is a reasonable approximation to a credible trade.
So once an ok backtest result is obtained by selecting timing settings. Its ontot the Stop Ramp Settings. This is an exponential line which rises rapidly after a period of time thus exiting the trade or going upwards with the trade. It kind of limits the maximum time a trade will stay in position which forms part of the timing aspect of this bot. Look at the chart exponential red lines and adjust the settings, along with the backtest results to select a good timing.
Then its the Drawdown Catcher and the Take Profit Setting. Start with the drawdown catcher disabled i.e. set to zero. Put in a conservative Take Profit, for example if a Take Profit at 6% gives the best backtest results, go for 4% to account for differences between backtest results and actual live bot performance.
Then start to increase the Drawdown Catcher. This shades a lime region where the bot will not enter a trade. I found that with most trades using this bot, if the price action moved in the direction of the trade (long or short) at the onset - this gave most of the good results (high probability of positive trade). Also if a trade entered at the start price and when south, the accumilated drawdown from these failing trades made all previous 1min bot attempt non=profitable in practice (even with good backtest results). The exp timing and also this drawdown reduction strategies seem to be the thing which makes this approach credible.
Try to go for settings that give a very high change of positive trade. For example, an 85% profitable trades will probably provide say 55% positive trades in practice as its always highly possible to just fit the parameters to the exact position/trade timings - and in reality going forwards these don't play out the same. Also a Profit Factor of 2 is about the minimum I would accept - again this provides for example a Profit Factor of 1.2 in practive.
However all being said - I think its possible with this bot on the 1min across lots of coins - with regularly updating settings - to make profits. (Not financial advice)
Please do get in touch if you would like me to fit this bot to anytimeframe to any trade.
MoonFlag PhD
1 Minute Scalper
How to use:
Green background: Long
With green background wait for white bars to appear, once white bars appear wait for green bars and enter long on break of high or close of green bar. The stop out of trade should be a candle that closes below the pivot: it should be apparent. (Can enter long after white bars if it has a long tail Stop below the tail).
Red background: Short
With red background wait for black bars to appear, once black bars appear wait for red bars and enter short on break of low or close of red bar. The stop out of trade should be a candle that closes above the pivot. (Can enter short after black bars if it has a long tail).
best of luck


[naoligo] 12x MA DT (5, 15, 30 & 60)This indicator is based on "Generic 8x MA Plotter", by @LazyBear.
It is also based on my own indicator "10x MA (H, D, W, M)", which is good for Swing Trading and/or Position.
This one is focused in daytrade and it will plot three Moving Averages based on current time interval (under 5 minutes) and nine based on chosen periods by 5, 15, 30 and 60 minutes. You will be able to see where is, for example, a 50 period's SMA of 15 minutes when using a 2 minutes time interval chart. I find it very useful to analyze, in a snap, possible price ranges and enter/exit points. All reference values are from setups known and used by daytraders.
you can choose between EMA or SMA (default: SMA) for each time interval, that are distributed in:
3x MA current time interval;
3x MA 5 minutes;
2x MA 15 minutes;
2x MA 30 minutes;
2x MA 60 minutes.
I've tried to keep the code as simple as possible, so you can increase the number of MA or modify the type for each time interval.
Cons: Use it wisely, because if you choose to plot all the 12 Moving Averages, it will may consume a lot of your navigator resources.
Enjoy!

XAUUSD 1minute StrategySorry, protected script as it uses a couple key indicators that are somewhat of a trade secret.
What I will tell you, is that the code is version 3, so no repaints, although this one never had them in the first place.
In my code, I use 'contracts', which I suppose are sizes, of 20.
Commission included to make it more realistic.
All this profit is from the start of the last week.
This is a trend-following strategy, so it does poorly in ranging conditions.
Essentially 4 lines of code.
