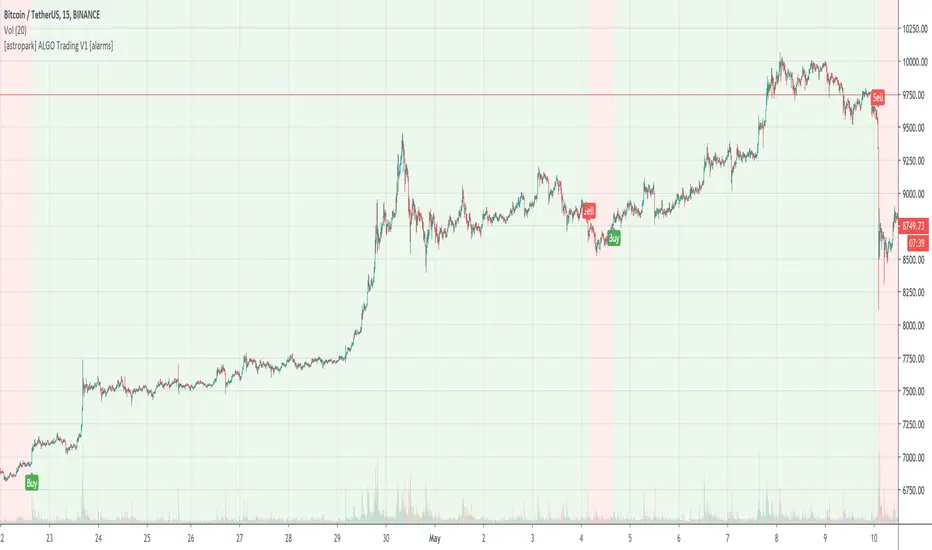
[astropark] ALGO Trading V3 [alarms]Dear Followers,
today another awesome Swing and Scalping Trading Strategy indicator, runnable on a bot , which works great on many timeframes (from 1h and above is suggested), just write me in order to help you find correct settings).
It must be said that this strategy works even better on 1m Renko chart!
If you are a scalper or you are a swing trader, you will love suggested entries for fast and long-lasting profit.
Keep in mind that a proper trailing stop strategy and risk management and money management strategies are very important (DM me if you need any clarification on these points).
This is not an evolution of "ALGO Trading V1" or "ALGO Trading V2" , but a twin sister of them.
For your reference, here it is the "ALGO Trading V1" indicator
and here the "ALGO Trading V2"
This strategy has the following options:
enable/disable signals on chart
enable/disable bars and background coloring based on trend
enable/disable a "filter noise" option , which try to reduce overtrading (you can easily check it on backtesting)
enable/disable a Take Profit / Stop Loss option (you can easily check it on backtesting too)
enable/disable a secret SmartOption which may improve profit on your chart (again, check it on you chart if it helps or not)
This strategy only trigger 1 buy or 1 sell. If you enable Take Profit / Stop Loss option, consider that many TP can be triggered before trend reversal, so take partial profit on every TP an eventually buy/sell back lower/higher to maximize your profit.
This script will let you set all notifications you may need in order to be alerted on each triggered signals.
The one for backtesting purpose can be found by searching for the astropark's "ALGO Trading V3" and then choosing the indicator with "strategy" suffix in the name, or you can find here below
Strategy results are calculated on the time window from 1995 to now, so on more than 15 years, using 1000$ as initial capital and working at 1x leverage (so no leverage at all! If you like to use leverage, be sure to use a safe option, like 3x or 5x at most in order to have liquidation price very far).
This is not the "Holy Grail", so use a proper risk management strategy.
This script will let you backtest how the indicator will perform on any chart and timeframe you may like to test and/or trade. Of course results will be very different depending on the chart and timeframe you will open. I tested a lot of charts and always you can find a combination that keep this strategy in profit on swing trading style (and this means that if you can have a daily look at the chart you can always manage to maximize your profit on each trade!)
This is a premium indicator , so send me a private message in order to get access to this script.
2-sell

[astropark] ALGO Trading V2 [alarms]Dear Followers,
today another awesome Swing and Scalping Trading Strategy indicator, runnable on a bot , which works great on many timeframes (ones between 1h and 1D are suggested, but just write me in order to help you find correct settings).
It must be said that this strategy works even better on 1m Renko chart!
If you are a scalper or you are a swing trader, you will love suggested entries for fast and long-lasting profit.
Keep in mind that a proper trailing stop strategy and risk management and money management strategies are very important (DM me if you need any clarification on these points).
This is not an evolution of "ALGO Trading V1" or "ALGO Trading V3" , but a twin sister of them. Search them on TradingView to know them better.
Here you can find ALGO Trading V1
This strategy has the following options:
enable/disable signals on chart
enable/disable bars and background coloring based on trend
enable/disable a "filter noise" option , which try to reduce overtrading (you can easily check it on backtesting)
enable/disable a Take Profit / Stop Loss option (you can easily check it on backtesting too)
enable/disable a secret SmartOption which may improve profit on your chart (again, check it on you chart if it helps or not)
This strategy only trigger 1 buy or 1 sell. If you enable Take Profit / Stop Loss option, consider that many TP can be triggered before trend reversal, so take partial profit on every TP an eventually buy/sell back lower/higher to maximize your profit.
This script will let you set all notifications you may need in order to be alerted on each triggered signals.
The one for backtesting purpose can be found by searching for the astropark's "ALGO Trading V2" and then choosing the indicator with "strategy" suffix in the name, or you can find here below
Strategy results are calculated on the time window from January 2018 to now, so on more than 2 years, using 1000$ as initial capital and working at 1x leverage (so no leverage at all! If you like to use leverage, be sure to use a safe option, like 3x or 5x at most in order to have liquidation price very far).
This is not the "Holy Grail", so use a proper risk management strategy.
This is a premium indicator , so send me a private message in order to get access to this script.

[astropark] ALGO Trading V1 [alarms]Dear Followers,
today another awesome Swing and Scalping Trading Strategy indicator, runnable on a bot , which works great on Low Timeframes (1h is suggested) but also on even lower ones (till 15m) and on higher ones (no further than 1D), just write me in order to help you find correct settings).
It must be said that this strategy works even better on 1m Renko chart!
If you are a scalper or you are a swing trader, you will love suggested entries for fast and long-lasting profit.
Keep in mind that a proper trailing stop strategy and risk management and money management strategies are very important (DM me if you need any clarification on these points).
This is not an evolution of "ALGO Trading V2" or "ALGO Trading V3" , but a twin sister of them. Search them on TradingView to know them better.
This strategy has the following options:
enable/disable signals on chart
enable/disable bars and background coloring based on trend
enable/disable a "filter noise" option , which try to reduce overtrading (you can easily check it on backtesting)
enable/disable a Take Profit / Stop Loss option (you can easily check it on backtesting too)
enable/disable a secret SmartOption which may improve profit on your chart (again, check it on you chart if it helps or not)
This strategy only trigger 1 buy or 1 sell. If you enable Take Profit / Stop Loss option, consider that many TP can be triggered before trend reversal, so take partial profit on every TP an eventually buy/sell back lower/higher to maximize your profit.
This script will let you set all notifications you may need in order to be alerted on each triggered signals.
The one for backtesting purpose can be found by searching for the astropark's "ALGO Trading V1" and then choosing the indicator with "strategy" suffix in the name, or you can find here below
Strategy results are calculated on the time window from January 2019 to now, so on more than 1 year, using 1000$ as initial capital and working at 1x leverage (so no leverage at all! If you like to use leverage, be sure to use a safe option, like 3x or 5x at most in order to have liquidation price very far).
This is not the "Holy Grail", so use a proper risk management strategy.
This is a premium indicator , so send me a private message in order to get access to this script.
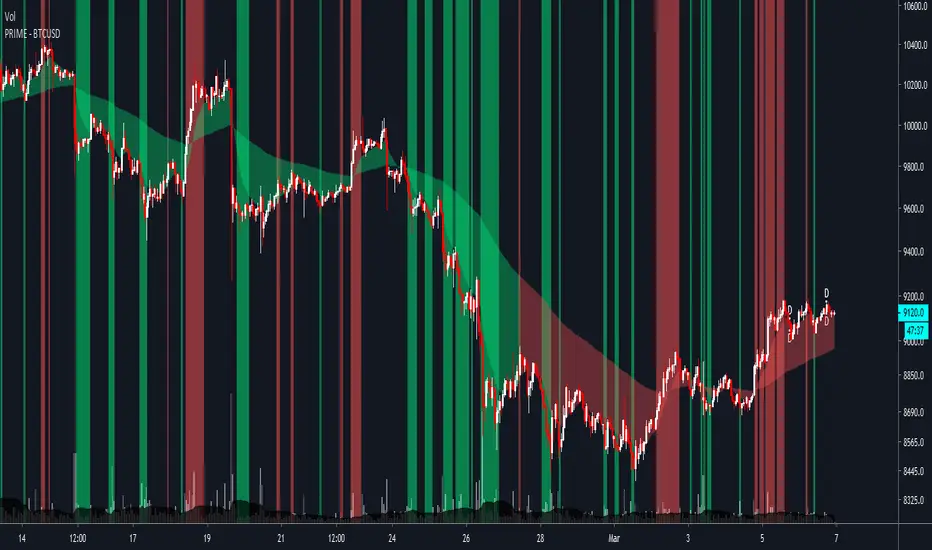
PRIME - BTCUSD - BYBITPRIME is a hyper-focused indicator made for a specific asset and timeframes. The goal of the indicator is to help you simplify and optimize your trading.
As of writing this, the indicator is optimized for the 1H and 4H timeframes.
The indicator will provide you with:
Potential buy and sell zones (the green and red vertical lines/flashes).
The trend of the market, with the cloud as support/resistance.
And the daily, weekly and monthly closes (as D, W and M).
In addition to these, the indicator also comes with the following alerts:
BUY ZONE
SELL ZONE
STOPPED FLASHING
CLOUD TOP X
CLOUD BOTTOM X
These alerts will allow you to know when some of the best opportunities in the market might be present.
This specific version of the indicator is for BTCUSD . However, I can adjust it to your favorite asset.
For access, questions, and full documentation, please message me here on TradingView.
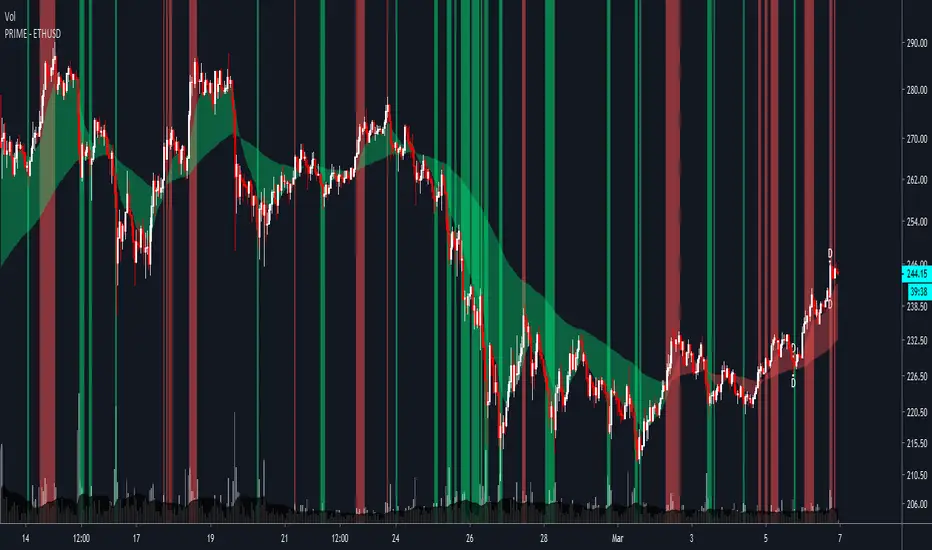
PRIME - ETHUSD - BYBITPRIME is a hyper-focused indicator made for a specific asset and timeframes. The goal of the indicator is to help you simplify and optimize your trading.
As of writing this, the indicator is optimized for the 1H and 4H timeframes.
The indicator will provide you with:
Potential buy and sell zones (the green and red vertical lines/flashes).
The trend of the market, with the cloud as support/resistance.
And the daily, weekly and monthly closes (as D, W and M).
In addition to these, the indicator also comes with the following alerts:
BUY ZONE
SELL ZONE
STOPPED FLASHING
CLOUD TOP X
CLOUD BOTTOM X
These alerts will allow you to know when some of the best opportunities in the market might be present.
This specific version of the indicator is for ETHUSD . However, I can adjust it to your favorite asset.
For access, questions, and full documentation, please message me here on TradingView.
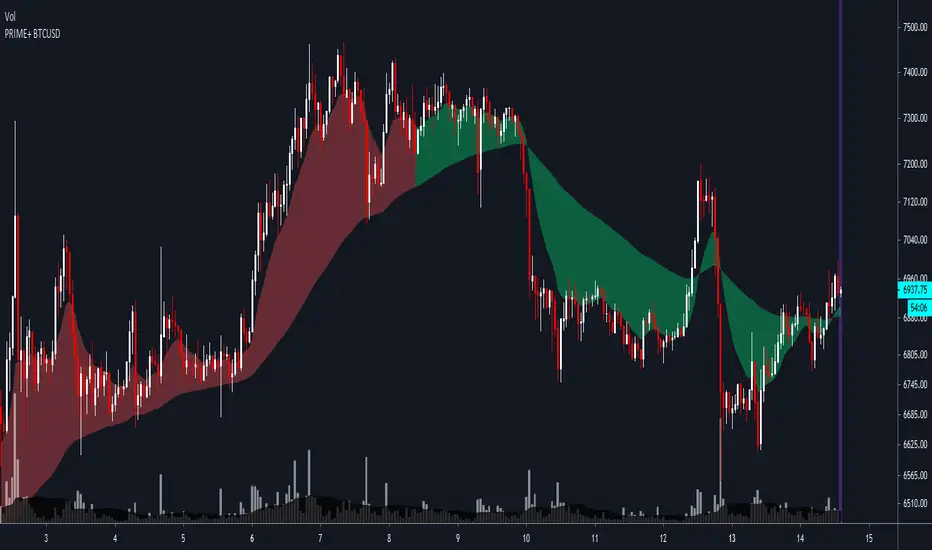
PRIME+ BTCUSDPRIME+ is a hyper-focused indicator made for a specific asset and timeframes. The goal of the indicator is to help you simplify and optimize your trading.
As of writing this, the indicator is optimized for the 3m and 1H timeframes.
The indicator will provide you with:
Potential buy and sell zones (the green and red vertical lines/flashes).
The trend of the market, with the cloud as support/resistance.
The daily, weekly and monthly closes (as D, W and M).
And additional tools for the 3m for best entries and exits.
In addition to these, the indicator also comes with alerts for the flashes:
BUY ZONE
SELL ZONE
These alerts will allow you to know when some of the best opportunities in the market might be present.
This specific version of the indicator is for BTCUSD . However, I can adjust it to your favorite asset.
For access and questions, please message me here on TradingView.
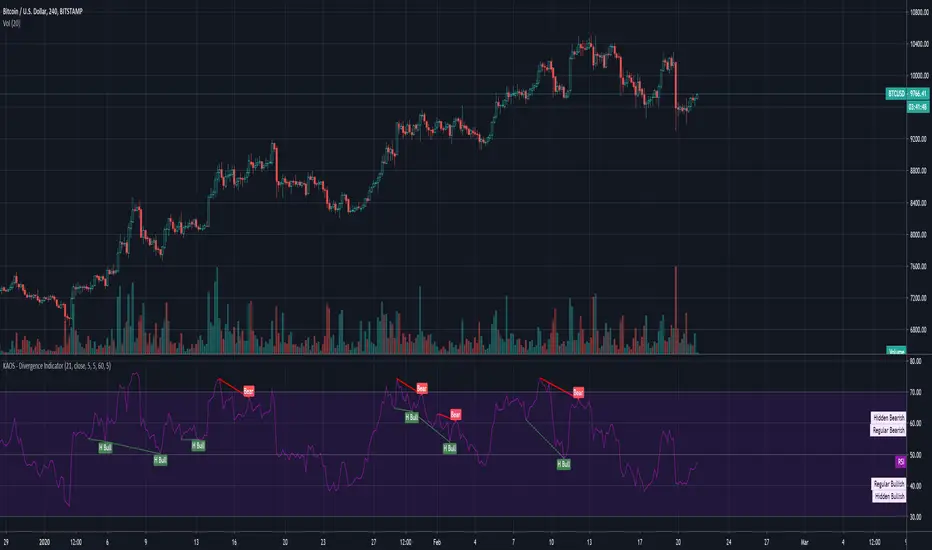
KAOS - Divergence IndicatorDivergence Indicator... Works pretty well, Use with caution as it does amend itself depending on market whale activity.
1hr, 4hr and Daily good for macro movements.
Should be used a supplemental indicator to your over all strategy NOT as a entry exit.
Have fun :)
Made by someone else, but has been tweaked with better settings
PRIME - XBTUSDPRIME - XBTUSD is an indicator made specifically for XBTUSD on the 1 hour timeframe .
The indicator will help you know:
Potential areas to buy and sell (the flashes).
The trend of the market (the wavy cloud).
Important support/resistance areas (the wavy cloud).
And the daily, weekly and monthly closes (as D, W and M).
The indicator comes with the following alerts:
BUY BTC (1H)
SELL BTC (1H)
The alerts must be set on the 1 hour timeframe.
The goal of the indicator is to make trading simple and sustainable regardless of your lifestyle.
PS. The buy and sell flashes only show on the 1 hour; and the cloud and closes up to the 12 hour (to keep the chart clean).
PPS. For access and questions, message me here on TradingView. If you need it for another asset, I can adjust the settings for you.

PRIME - BTCUSDPRIME - BTCUSD is an indicator made specifically for BTCUSD on the 1 hour timeframe .
The indicator will help you know:
Potential areas to buy and sell (the flashes).
The trend of the market (the wavy cloud).
Important support/resistance areas (the wavy cloud).
And the daily, weekly and monthly closes (as D, W and M).
The indicator comes with the following alerts:
BUY BTC (1H)
SELL BTC (1H)
The alerts must be set on the 1 hour timeframe.
The goal of the indicator is to make trading simple and sustainable regardless of your lifestyle.
PS. The buy and sell flashes only show on the 1 hour; and the cloud and closes up to the 12 hour (to keep the chart clean).
PPS. For access and questions, message me here on TradingView. If you need it for another asset, I can adjust the settings for you.

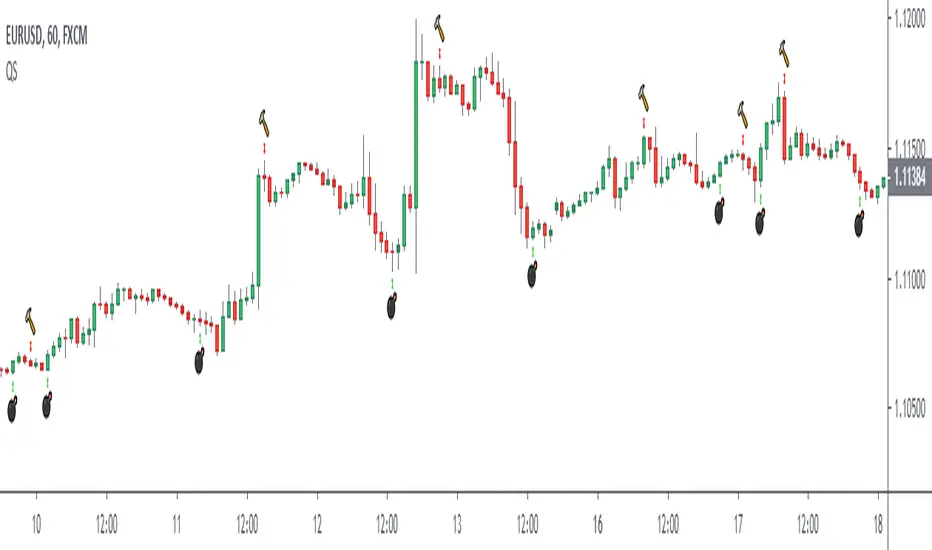
[astropark] I love Fibonacci V1Dear Followers,
I Love Fibonacci is a tool designed to have a professional market momentum perspective to help you get rid of your emotions and trade more securely!
Don't let FOMO, fear and indecision take control of your trading actions!
Use it together with my 21 days EMA indicator
and EMA Ribbons
Here some examples on how to use them all together on EURUSD trading pair
and on BTCUSD trading pair
This is a free indicator, direct message me if you need further help.

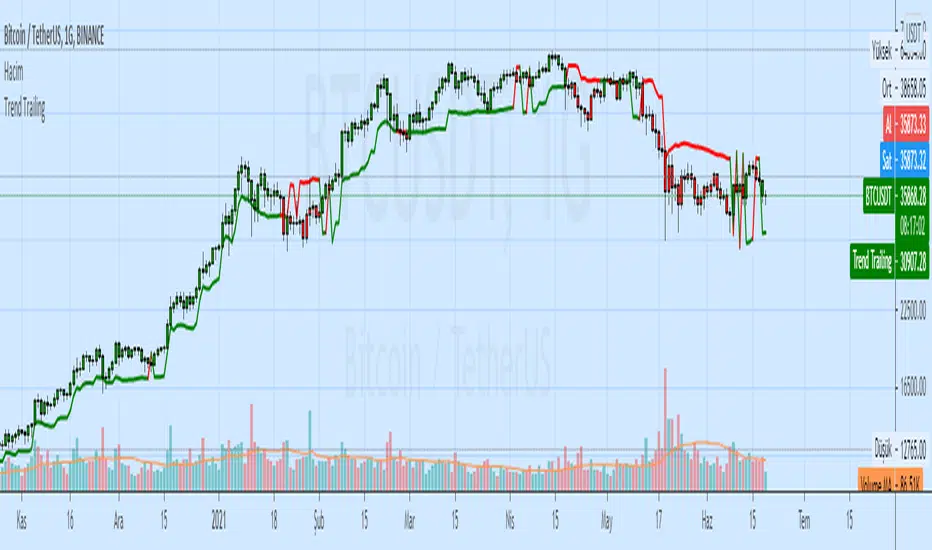
Trend TrailingAndrew Abraham
It can be used as:
- stop loss indicator
- indicator of support and resistance
- buy and sell signals
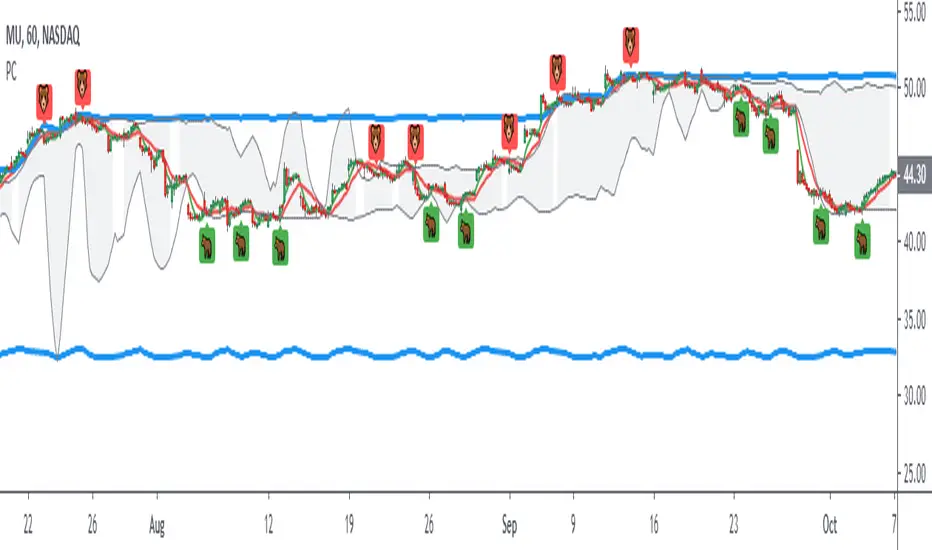
[astropark] Trend Is Your Friend V3 [alarms]Dear Followers,
today another awesome Swing and Scalping Trading Strategy indicator, runnable on a bot , which works great on High Timeframes (1D is suggested) but also on lower ones (just write me in order to help you find correct settings) and even better on 1m Renko chart!
If you are a scalper, you will love suggested entries for fast profit. You can run it on 1h timeframe (below is not suggested, there is "no-trend" below 1h!) if you are used to scalp trading and close each trade whenever you feel happy (a proper trailing stop strategy is suggested anyway).
This is not an evolution of "Trend Is Your Friend V1" or V2 , but a twin sister or the "Trend Is Your Friend V1" indicator you can see here below
and twin sister or the "Trend Is Your Friend V2" indicator you can see here below
This strategy differs for the engine used as basis, but has the same usage settings:
enable/disable signals on chart
enable/disable showing trend cloud
enable/disable bar coloring based on trend
enable/disable background coloring based on trend
edit trend period length (direct message me in order to help you fine best settings)
edit a smart variant option to enhance the trend cloud on your chart
enable/disable an option to smart enter trade
This strategy only trigger 1 buy or 1 sell. In order to get notified when a signal is triggered, you need to use the "alarms" version of this indicator.
Strategy results are calculated on the timeframe from December 2012 to now, so on 8 years, using 10000$ as initial capital and working at 1x leverage (so no leverage at all! If you like to use leverage, be sure to use a safe option, like 3x or 5x at most in order to have liquidation price very far).
This is not the "Holy Grail", so use a proper risk management strategy.
This script will let you set all notifications you may need in order to be alerted on each triggered signals.
The one for backtesting purpose can be found by searching for the astropark's "trend is your friend v3" and then choosing the indicator with "strategy" suffix in the name, or you can find here below
This is a premium indicator , so send me a private message in order to get access to this script.

Simple Reversal PointThis indicator finds possible points of reversion, you can use it to stack positions and get a good average price for when the price changes direction, it is the trader responsibility to manage the position and make a profit.
-Added alerts
Premium Stochastic OscillatorThe PSO is a rewired version of a short-period stochastic. Unlike a standard stochastic oscillator, this indicator is normalized to register neutral values at zero while providing greater sensitivity to short-term price moves. This indicator uses a central zero line as a reference point and will oscillate above and below this point as price fluctuates. In addition, the PSO is smoothed by using a double exponential moving average to provide a more even response to turns in the market.
(from TASC magazine, August 2008 issue).
The Premium Stochastic Oscillator was introduced by technical analyst Lee Leibfarth.

Normalized Smoothed MACDMACD normalized with its highest and lowest values over the last “Normalization period”
- includes alerts

KDJ Indicator The KDJ indicator is derived from the Stochastic with the one difference being the addition of the J line. This implies that the KDJ indicator has a total of three lines; %K%D%J. The %J is simply put, the difference between the %K and the %D lines, which is similar to the MACD.
The difference between the %J and that of the MACD is that it is plotted as a histogram and the second being that the value are weighted and as such delivers more emphasis on the shorter term %K line.
What we now have is a line that moves quite slowly and has the knack to move beyond the range of a normal stochastic indicator.

Market ModeThe Market Mode indicator seeks to identify trends and rebounds by identifying “phases” according to the principles of John Ehlers.
- When the oscillator passes above the top line, the market is in an uptrend.
- When the oscillator goes below the bottom line, the market is in a downtrend.
- Between these two levels, the market is calmer and could rebound in the direction of the initial trend and / or phase of trend change.

Quadratic SemaphoreThe quadratic semaphore indicator is an indicator that find confirmed market u-turn with the help of 2 quadratic regression calculated with Highs and Lows over the last “length” periods.
- “p” setting is candlesticks quantity to confirmed the quadratic regression has formed a High or Low parabola, such as Fractals. Consecutive same signals can happen due to the use of different price values for upper and lower semaphore.
- Adjust the settings to your instrument and time frame.
- Alerts included.
Success with your trade¡¡
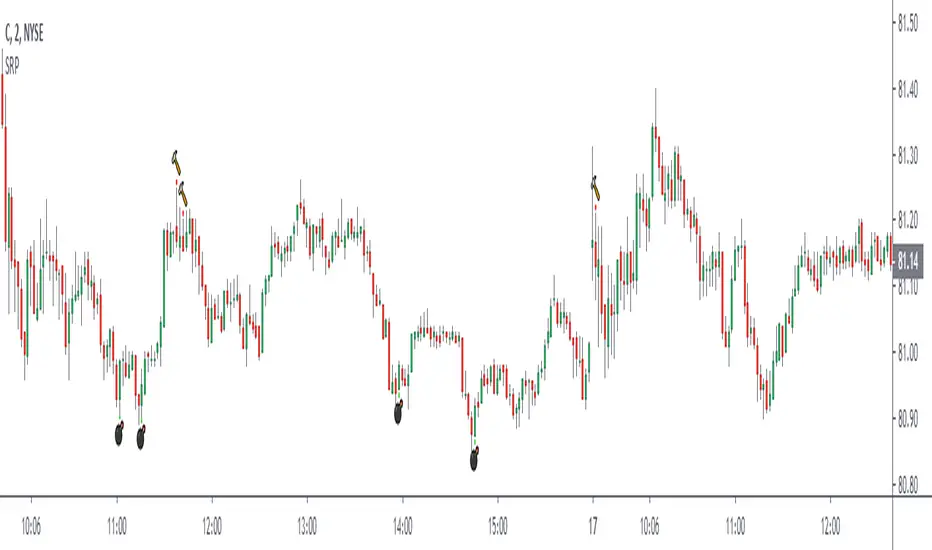
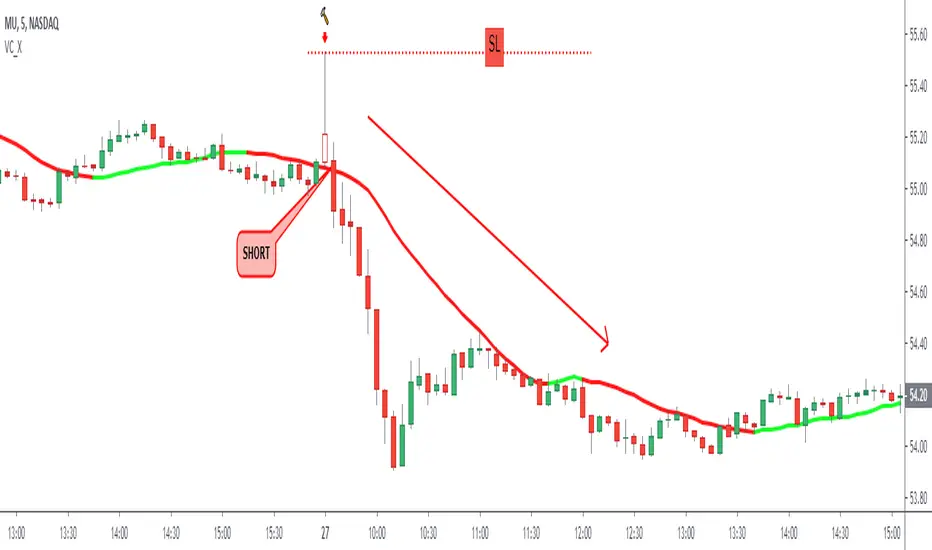
Long Tail Candle by Oliver VelezThis script detects an event created by Oliver Velez, it is a wide-range candle with a small body and a long tail (hammer-type candle), its range is noticeably larger than previous candles, as a rule it can be taken that the body should be maximum of 30% of the total range of the candle with a long tail. The stop goes under the tail and the signal is given when the next candle followed by the long tail candle exceeds its body, do not program this condition so that the alert indicates that a long tail candle was generated and the trader has some Time to visualize the graph and wait for the signal.
The default configuration is very basic, each trader must adjust to their needs.
- Trend filters can be activated.
- Alerts available.
Thumbs up
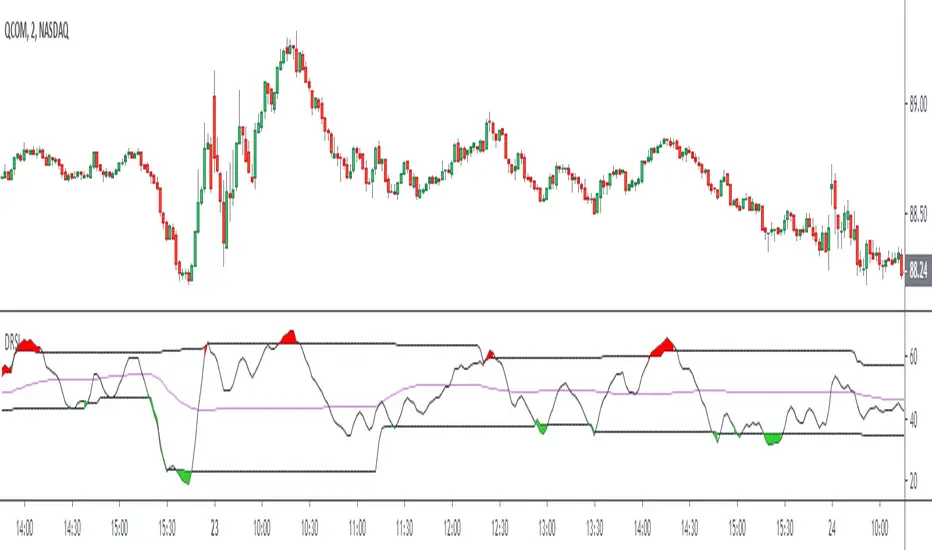
Dynamic RSIThe Dynamic RSI indicator is a kind of exponential RSI. The overbought and oversold levels (respectively HiLine and LoLine) are calculated according to the recent highest and lowest values of the Dynamic RSI line.
TMMS OscillatorThe TMMS oscillator (aka “Trading Made More Simpler”) is an indicator made of conditions based on both 2 separated Stochastic and 1 RSI.
Bullish zone is green and bearish one is red. When the histogram is grey, no signals is available at that time.
The indicator has an option to show the current trend of an Hull moving average (ascending or descending curve). When the trend is up, green dots are plotted on the zero line. When the trend is down, the dots are coloured in red.
Greetings, success with your trade!!!

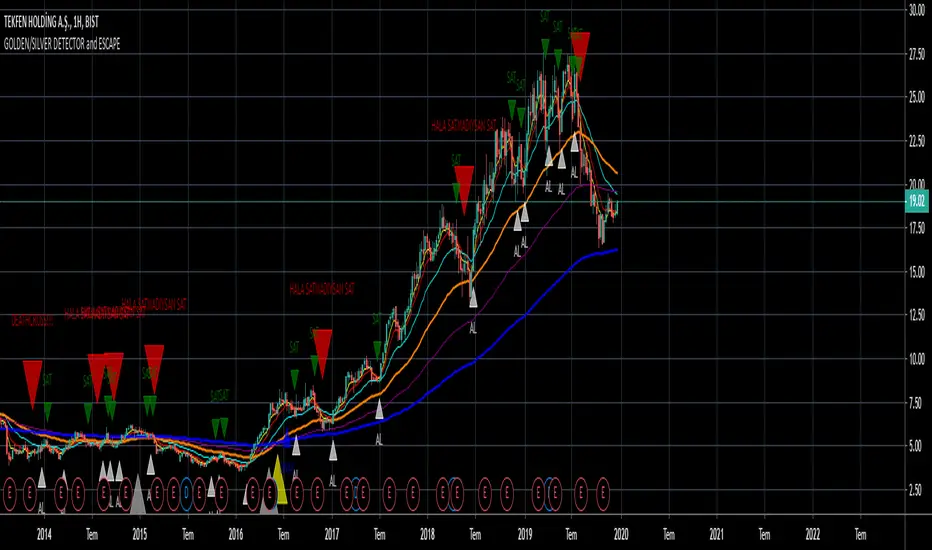
GOLDEN/SILVER DETECTORFind golden and silver crosses with using EMA.
Note
Colors are depends on you.
Translation
AL = BUY
SAT = SELL
ONAY = CONFIRMATION