parademi 5-8-13EMA 5-8-13 Trend & Crossover Indicator
This indicator helps you identify market trends and potential reversal points in a single tool. It uses three Exponential Moving Averages (EMA 5, EMA 8, and EMA 13) to determine trend direction and highlight important crossover signals.
Features:
Trend Detection:
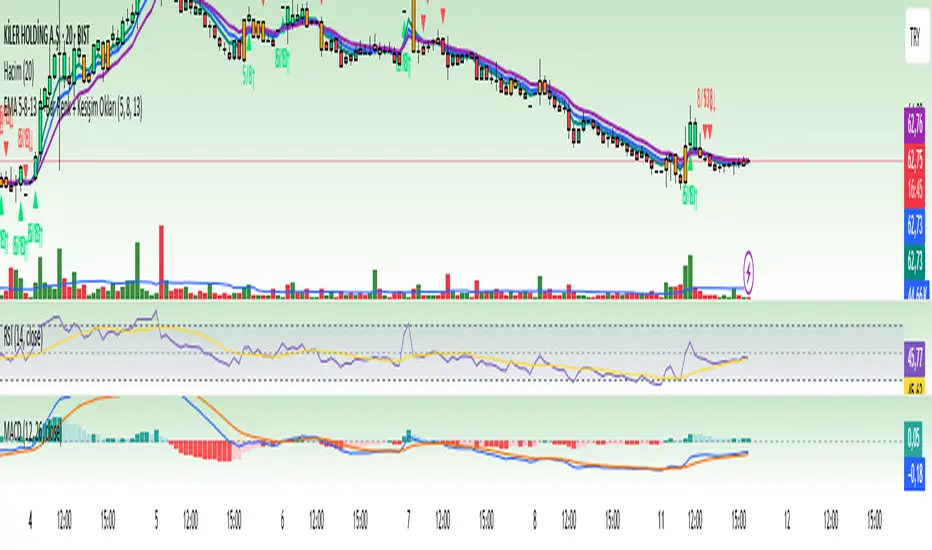
When the price is above all three EMAs (5, 8, and 13), candles are colored green, indicating a strong uptrend.
When the price crosses EMA 8, candles turn orange, signaling a possible short-term change in momentum.
Crossover Signals:
When EMA 5 crosses above EMA 8, a green arrow appears below the candle, suggesting a potential buy signal.
When EMA 5 crosses below EMA 8, a red arrow appears above the candle, suggesting a potential sell signal.
Optional EMA 8 and EMA 13 crossover signals can also be displayed using the same logic.
Purpose:
This indicator visually clarifies trend direction and marks potential entry/exit points. It can be used on its own or combined with other technical tools such as volume, support/resistance levels, or momentum indicators for higher accuracy.
5-8-13
Multiple Ema 8/13/21/55 by melihgulerIn one graph, 4 different periods include EMA (8/13/21/55). It is not recommended for short-term investments. You can get efficient results using at least 4 hours chart.
It is not an investment recommendation. Your use is at your own risk.

Multiple Ema 8/13/21/55 by melihgulerIn one graph, 4 different periods include EMA (8/13/21/55). It is not recommended for short-term investments. You can get efficient results using at least 4 hours chart.
It is not an investment recommendation. Your use is at your own risk.
