Previous Levels by HAZEDPrevious Day/Week/Month High/Low Levels with 50% Equilibrium
🎯 Key Features:
- Previous Period Levels: Automatically plots previous Day, Week, and Month highs and lows
- 50% Equilibrium Zones: Shows the midpoint between each period's high and low
- Precise Line Placement: Lines start from the exact bar where the high/low occurred (not period beginning)
- Clean Visual Design: Solid lines for key levels, semi-transparent for equilibrium zones
- Customizable Display: Toggle each timeframe independently with custom colors and styles
📊 How It Works:
The indicator identifies the previous period's high and low points, then draws horizontal lines starting from the exact time those levels were created. The 50% equilibrium levels mark the midpoint between each period's range, providing additional support/resistance reference points.
⚙️ Settings:
- Timeframe Controls: Enable/disable Daily, Weekly, Monthly levels
- Line Styles: Choose between solid, dashed, or dotted lines
- Color Customization: Set individual colors for each timeframe
- Label Options: Show/hide price values, adjust label size
- 50% Levels: Toggle equilibrium zones with semi-transparent styling
💡 Trading Applications:
- Support & Resistance: Previous highs/lows act as key S/R levels
- Breakout Trading: Monitor price action around these critical levels
- Mean Reversion: 50% equilibrium zones often act as magnet levels
- Multi-Timeframe Analysis: See how different timeframe levels interact
🔧 Technical Notes:
- Lines extend to the right for future reference
- Only shows levels when chart timeframe is equal or lower than the level timeframe
- Uses precise historical data to ensure accurate line placement
- Optimized for performance with clean code structure
Perfect for swing traders, day traders, and anyone using support/resistance analysis!
Feel free to leave feedback and suggestions for future updates!
50retracement

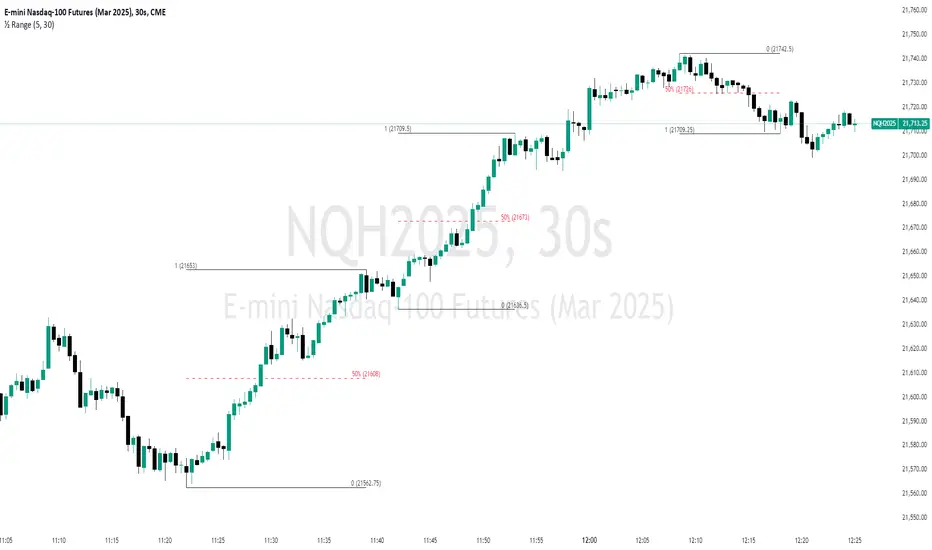
Unmitigated 50% of the RangeThis indicator is designed to display unmitigated 50% zones of price ranges within two swing (High and Low) points. The 50% level serves as a probable target for retracements before the price resumes its movement in the direction of the most recent swing. The underlying theory is that Price Action tends to correct unbalanced price zones by returning to 50% of the range.
The indicator identifies highs and lows utilizing the “Left Swing Sensitivity” setting, which detects the high/low points within the specified number of bars. It then ensures that the zone meets a minimum size requirement, configured via the “Minimum Leg Size” setting, to filter out smaller legs/zones that would not provide sufficient profit and loss opportunities for entries at 50% and take profit at the most recent swing point.
To prevent duplication of zones when the price is gradually moving up, an "Auto Adjust Levels" setting is available. Enabled by default, this feature automatically cleans up smaller zones, retaining only the primary zone between the most recent swing point and the outer swing.
Additionally, the indicator automatically removes mitigated zones where the price has returned to the 50% level, thus maintaining clean charts.
There are several visualization settings available, offering comprehensive control over what is displayed on the charts:
Control the color and style of the lines representing the 1, 0, and 50% levels.
Choose whether to display labels and if they should show the price at the rendered levels.
Optionally extend the lines/labels to the right for each level.