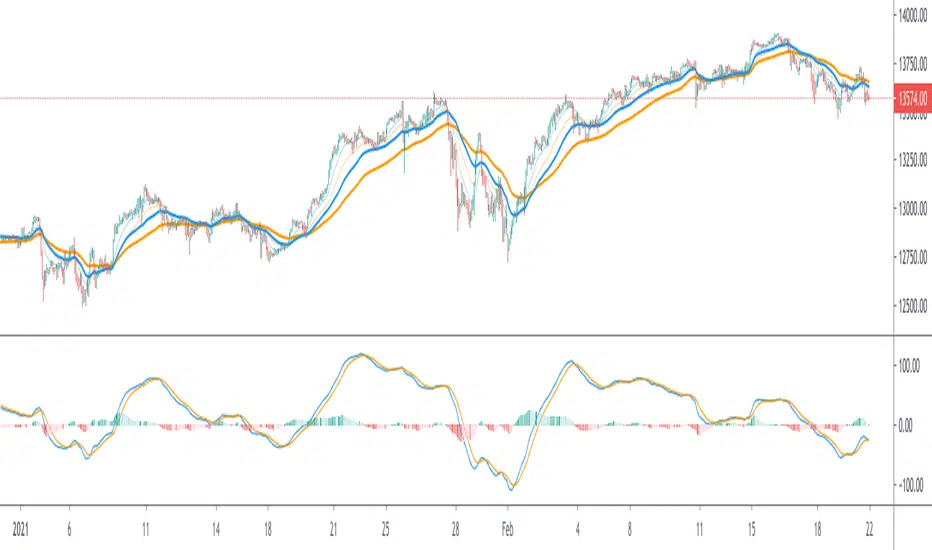
Exponentially Deviating Moving Average (MZ EDMA)Exponentially Deviating Moving Average (MZ EDMA) is derived from Exponential Moving Average to predict better exit in top reversal case.
EDMA Philosophy
EDMA is calculated in following steps:
In first step, Exponentially expanding moving line is calculated with same code as of EMA but with different smoothness (1 instead of 2).
In 2nd step, Exponentially contracting moving line is calculated using 1st calculated line as source input and also using same code as of EMA but with different smoothness (1 instead of 2).
In 3rd step, Hull Moving Average with 3/2 of EDMA length is calculated using final line as source input. This final HMA will be equal to Exponentially Deviating Moving Average.
EDMA Advantages
EDMA's main advantage is that in case of top price reversal it deviates from conventional EMA of 2*Length. This benefits in using EDMA for EMA cross with quick signals avoiding unnecessary crossovers. EDMA's deviation in case of top reversal can be seen as below:
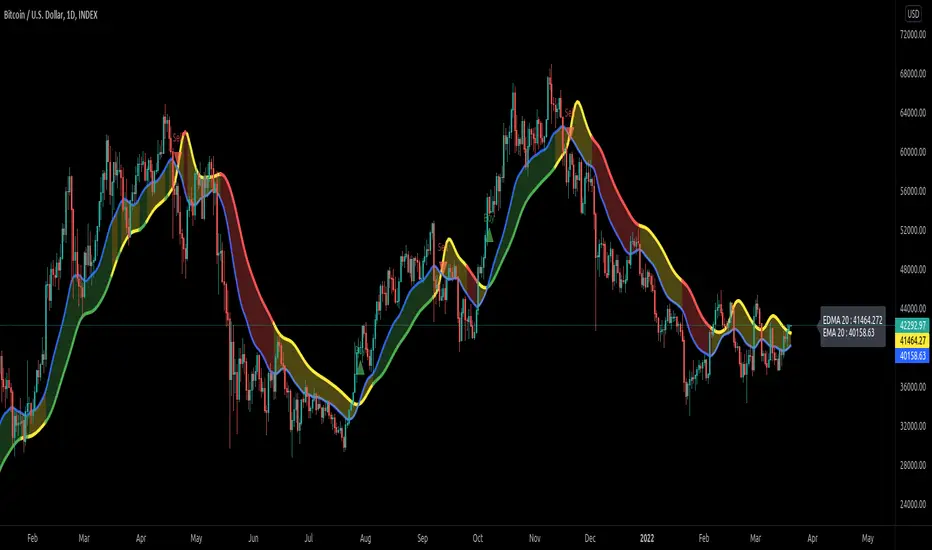
EDMA presents better smoothened curve which acts as better Support and resistance. EDMA coparison with conventional EMA of 2*length of EDMA is as follows.
Additional Features
EMA Band: EMA band is shown on chart to better visualize EMA cross with EDMA.
Dynamic Coloring: Chikou Filter library is used for derivation of dynamic coloring of EDMA and its band.
Alerts: Alerts are provided of all trade signals. Weak buy/sell would trigger if EMA of 2*EDMA_length crosses EDMA. Strong buy/sell would trigger if EMA of same length as of EDMA crosses EDMA.
Trade Confirmation with Chikou Filter: Trend filteration from Chikou filter library is used as an option to enhance trades signals accuracy.
Defaults
Currently default EDMA and EMA1 length is set to 20 period which I've found better for higher timeframes but this can be adjusted according to user's timeframe. I would soon add Multi Timeframe option in script too. Chikou filter's period is set to 25.
Adaptive
Ehlers Median Average Adaptive Filter [CC]The Median Average Adaptive Filter was created by John Ehlers and this is another in my current series of undiscovered gems. I'm sure you are all saying but Franklin, Ehlers doesn't have any undiscovered gems but in this case you would be wrong. This was actually an indicator so buried on the internet that I had to use the wayback machine to find the original source code. Ehlers notoriously hates adaptive moving averages which is funny because he has made a decent amount of them. This is a very unique indicator that uses a while loop to adjust the length and I thought it deserved some extra recognition from the TV community. I have included strong buy and sell signals in addition to normal ones so strong signals are darker in color and normal signals are lighter in color. Buy when the line turns green and sell when it turns red.
Let me know if there are any other scripts or indicators you would like to see me publish!

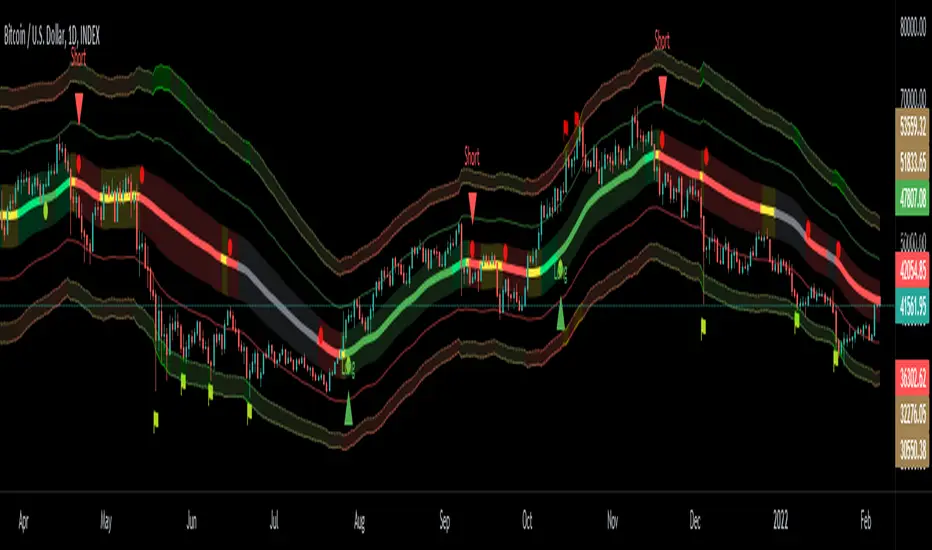
Volume Adaptive Bollinger Bands (MZ VABB)This indicator is a functional enhancement to John Bollinger's Bollinger Bands. I've used Volume to adapt dynamic length which is used in basis (middle line) of Bollinger Bands and Simple Moving Average is replaced with Adaptive Ehlers Deviation Scaled Moving Average ( AEDSMA ).
BOLLINGER BANDS BASIC USAGE AND LIMITATIONS
Bollinger bands are popular among traders because of their simple way to detect volatility in market and redefine support and resistance accordingly. These are some basic usages of original Bollinger Bands:
Most commonly Bollinger Band works on 20 period Simple Moving Average as Basis / Middle Line and standard deviation of 2 for volatility detection.
Upper and lower bands can act as support and resistance which accordingly update with standard deviation of same period as of Simple Moving Average.
As upper and lower bands act as volatility measure which benefits in Squeeze detection and breakout trading.
Among all the usages there are some limitations as follows:
Original Bollinger Bands use 20 period Simple Moving Average as Basis which itself restricted to some number of data pints and if market moves in one direction or simply goes sideways for long time; candles can stay on either bands for long time. This gives benefit for staying in directional trade but will completely nullify the use of both bands as support and resistance.
Above point simply be explained as markets can stay overbought / oversold for long time and one way to make Bollinger Bands more useful is to simply use higher periods in SMA but as we know with higher periods SMA becomes more laggy and less adaptive.
Most traders use BBs alongside some other Volume Oscillator for example "On Balance Volume" but that does solve BBs limitations issue that it should be more adaptive to detect volatility in market.
VOLUME ADAPTIVE BOLLINGER BAND WORKING PRINCIPLE
Best way to make original Bollinger band more adaptive was to just use dynamic length instead on constant 20 period. This dynamic length had to be based on some other powerful parameter which can't be volatility as BB itself is a volatility indicator and adapting its length based volatility would have been superimposing volatility on Bollinger bands giving unrealistic results.
For adaptive length, I tried using Volume and for this purpose I used my Relative Volume Strength Index " RVSI " indicator. RVSI is the best way to detect if Volume is going for a breakout or not and based on that indication length of Bollinger Band Basis Moving Average changes.
RVSI breaking above provided value would indicate Volume breakout and hence dynamic length would accordingly make Bollinger band basis moving average more over fitted and similarly standard deviation of achieved dynamic length would give better bands for support and resistance. Similar case would happen if Volume goes down and dynamic length becomes more underfit.
According to my back testing studies I found that Simple Moving Average wasn't the best choice for dynamic length usage in Bollinger Band Basis. So, I used Adaptive Ehlers Deviation Scaled Moving Average ( AEDSMA ) which is more adaptive and already modified to adapt with RVSI.
SLOPE USAGE FOR TREND STRENGTH DETCTION
Volume Adaptive Bollinger Bands are more reactive to market trends so, I used slope for trend strength detection.
If slope of Volume Adaptive Bollinger Band Basis (i.e. AEDSMA ), Upper and Lower Bands is supporting a trend at same time then script will provide signal in that direction. That signal can also use Volume as confirmation if Bollinger Bands trend direction is supported by Volume or not.
DYNAMIC COLORS AND TREND CORRELATION
I’ve used dynamic coloring in Basis ( AEDSMA ) to identify trends with more detail which are as follows:
Lime Color: Slope supported Strong Uptrend also supported by Volume and Volatility or whatever you’ve chosen from both of them.
Fuchsia Color: Weak uptrend only supported by Slope or whatever you’ve selected.
Red Color: Slope supported Strong Downtrend also supported by Volume and Volatility or whatever you’ve chosen from both of them.
Grey Color: Weak Downtrend only supported by Slope or whatever you’ve selected.
Yellow Color: Possible reversal indication by Slope if enabled. Market is either sideways, consolidating or showing choppiness during that period.
SIGNALS
Green Circle: Market good for long with support of Volume and Volatility or whatever you’ve chosen from both of them.
Red Circle: Market good to short with support from Volume and Volatility or whatever you’ve chosen from both of them.
Flag: Market either touched upper or lower band and can act as good TP and warning for reversal.
FIBONACCI BANDS
I’ve included Fibonacci multiple bands which would act as good support/resistance zones. For example, 0.618 Fib level act as good local support and resistance in both upper and lower zones. Fibonacci values can be modified but should be lower than 1.
DEFAULT SETTINGS
I’ve set default Minimum length to 50 and Maximum length to 100 which I’ve found works best for almost all timeframes but you can change this delta to adapt your timeframe accordingly with more precision.
Dynamic length adoption is enabled based on Volume only but volatility can be selected which is already explained above.
Trend signals are enabled based on Slope and Volume but Volatility can be enabled for more precise confirmations.
In “ RVSI ” settings "Klinger Volume Oscillator" is set to default but others work good too especially Volume Zone Oscillator. For more details about Volume Breakout you can check “MZ RVSI Indicator".
ATR breakout is set to be positive if period 14 exceeds period 46 but can be changed if more adaption with volatility is required.
EDSMA super smoother filter length is set to 20 which can be increased to 50 or more for better smoothing but this will also change slope results accordingly.
EDSMA super smoother filter poles are set to 2 because found better results with 2 instead of 3.
FURTHER ENHANCEMENTS
So far, I've achieved better results with "Klinger Volume Oscillator" in RVSI but TFS Volume Oscillator and On Balance Volume can be used which would change dynamic length differently. It doesn't mean that results would be wrong with some oscillator and precise with others but every oscillator works in its specific way for and RVSI just detect strength of Volume based on provided oscillator.

Volume Adaptive Chikou Scalping StudyIDEA PLACEMENT
This indicator uses “Chikou” cross concept of Ichimoku cloud indicator and enhances usage of High/Low data with Volume Breakout and Volatility based dynamic adaption.
I’ve been working on making Moving Averages more adaptive based on Volume Breakout and Volatility but as we know Mas work better on close values. I wanted to create a study that may have maximum data available and that’s how I came up with the concept of making adaptive Ichimoku Cloud. Except, I used different concept than Ichimoku. As we know that Tenkan-sen and Kijun-sen from Ichimoku Cloud average out highest and lowest values within 26 and 9 period respectively but I tried making it Volume Breakout and Volatility based Adaptive but couldn’t get better results.
Along the way I came up with an idea of instead of averaging out just keeping the High/Low values data separate and intact and to do so I took Linear regression of High values of Volume Breakout and Volatility based Adaptive dynamic period and similarly with Low values.
Then the strategy was to use Chikou for crossover and crossunder indication and for this purpose I used Chikou with same dynamic length as used before in High/Low linear regression.
The idea becomes simple as when Adaptive Dynamic Chikou crosses Adaptive Dynamic Linear Regression of High/Low values then Lowest / Highest value within current Adaptive Dynamic Length becomes the next Support / Resistance.
SIGNALS
Not every Chikou cross would give signal instead signal should be supported by either Volume Breakout or Volatility whatever you have selected from.
FIBONACCI EVELOPE BANDS
I’ve included ATR based Fibonacci multiple bands which would act as good support/resistance zones.
DEFAULT SETTINGS
I’ve set default Minimum length to 20 and Maximum length to 50 which I’ve found works best for almost all timeframes but you can change this delta to adpat your timeframe accordingly with more precision.
Dynamic length adoption is enabled based on both Volume and Volatility but only one or none of them can also be selected.
Trend signals verification is enabled based on Volume but Volatility can also be enabled for more precise confirmations.
In “RVSI” settings TFS Volume Oscillator is set to default but others work good too especially Volume Zone Oscillator. For more details about Volume Breakout you can check “MZ RVSI Indicator”
ATR breakout is set to be true if period 14 exceeds period 46 but can be changed if more adaption with volatility is required.
FURTHER ENHANCEMENTS
I’ve used Linear Regression of High/Low values because I found better results with it but SMA and HMA can also be used. I’m planning to perpetually use this study for Dynamically length adaption and trades confirmations in other strategies.

Adaptive Ehlers Deviation Scaled Moving Average (AEDSMA)AEDSMA INTRODUCTION
This indicator is a functional enhancement to “Ehlers Deviation Scaled Moving Average (EDSMA / DSMA)”. I’ve used Volume Breakout and Volatility for dynamic length adaption and further Slope too for trend evaluation.
EDSMA was originally developed by John F. Ehlers (Stocks & Commodities V. 36:8: The Deviation-Scaled Moving Average).
IDEA PLACEMENT
I’ve traded almost every kind of market with different volatility conditions using Moving Averages. It was too much of a hassle to select and use different MA length depending upon market trend. So, the journey started with adapting Moving Averages with another parameter and that’s how “MZ SAMA ” came into being where Slope was used to adapt Adaptive Moving Average with trend change. The problem was still pretty much the same as SAMA might not be effective on every market condition. Hence, I worked on Volume to adapt Moving Averages accordingly. I cane up with “MZ RVSI ” which I used in “MZ DVAMA ” to adapt dynamic length in Adaptive Moving Average and also used “MZ RVSI " alongside Slope as confirmation of trend changes.
Meanwhile, I started using DVAMA methodology on different types on Moving Averages that allow dynamic length for example Hull Moving Average, Linear Regression Curve, SMA, WMA, TMA and many more. All of my tested Mas showed too much flexibility because of volume based Adaptive length.
I came across a script of “Adaptive Hull Moving Average” which pretty much used the similar methodology as DVAMA but when I looked into its depth, its volume oscillator wasn’t working at all and only volatility based dynamic length was used. It was an interesting idea so, I decided to use Volume and Volatility alongside for better results but was nearly impossible to achieve what I wanted using only Hull Moving Average.
I had been using EDSMA in “MA MTF Cross Strategy” and “MZ SRSI Strategy V1.0” previously. It was the perfect choice when comparing to usage of slope on it. DSMA works perfectly as support and resistance as its Deviation Scaled. So, I tried using it to adapt dynamic length based on Volume and Volatility and I wasn’t disappointed. It worked like a charm when I adapted dynamic length between 50 and 255.
DYNAMIC LENGTH BENEFITS
Dynamic length adaption methodology works in a way of adapting Relatively Lower Length leading toward overfitting if trend is supported by Volume and Volatility . Similarly, adapting Relatively Higher Length leading toward underfitting if trend isn’t supported by Volume and Volatility .
Dynamic length adaption makes Moving Average to work better for both Bull and Bear-runs avoiding almost every fake break-in and breakouts. Hence, adaptive MA becomes more reliable for breakout trading.
MA would be more useful as it would adapt almost every chart based on its Volume and Volatility data.
DYNAMIC COLORS AND TREND CORRELATION
I’ve used dynamic coloring to identify trends with more detail which are as follows:
Lime Color: Strong Uptrend supported by Volume and Volatility or whatever you’ve chosen from both of them.
Fuchsia Color: Weak uptrend only supported by Slope or whatever you’ve selected.
Red Color: Strong Downtrend supported by Volume and Volatility or whatever you’ve chosen from both of them.
Grey Color: Weak Downtrend only supported by Slope or whatever you’ve selected.
Yellow Color: Possible reversal indication by Slope if enabled. Market is either sideways, consolidating or showing choppiness during that period.
SIGNALS
Green Circle: Market good for long with support of Volume and Volatility or whatever you’ve chosen from both of them.
Red Circle: Market good to short with support from Volume and Volatility or whatever you’ve chosen from both of them.
Yellow Cross: Market either touched top or bottom ATR band and can act as good TP or SL.
EDSMA EVELOPE/BANDS: I’ve included ATR based bands to the Adaptive EDSMA which act as good support/resistance despite from main Adaptive EDSMA Curve.
DEFAULT SETTINGS
I’ve set default Minimum length to 50 and Maximum length to 255 which I’ve found works best for almost all timeframes but you can change this delta to adapt your timeframe accordingly with more precision.
Dynamic length adoption is enabled based on both Volume and Volatility but only one or none of them can also be selected.
Trend signals are enabled based on Slope and Volume but Volatility can be enabled for more precise confirmations.
In “ RVSI ” settings TFS Volume Oscillator is set to default but others work good too especially Volume Zone Oscillator. For more details about Volume Breakout you can check “MZ RVSI Indicator".
ATR breakout is set to be positive if period 14 exceeds period 46 but can be changed if more adaption with volatility is required.
EDSMA super smoother filter length is set to 20 which can be increased to 50 or more for better smoothing but this will also change slope results accordingly.
EDSMA super smoother filter poles are set to 2 because found better results with 2 instead of 3.
FURTHER ENHANCEMENTS
So far, I’ve seen better results with Volume Breakout and Volatility but other parameters such as Linear Slope of Particular MA, MACD, “MZ SRSI ”, a Conditional Uptrend MA or simply KDJ can also be used for dynamic length adaption.
I haven't yet gotten used to pine script arrays so, defining and using conditional operators is pretty much lazy programming for me. Would be great redefining everything through truth matrix instead of using if-else conditions.

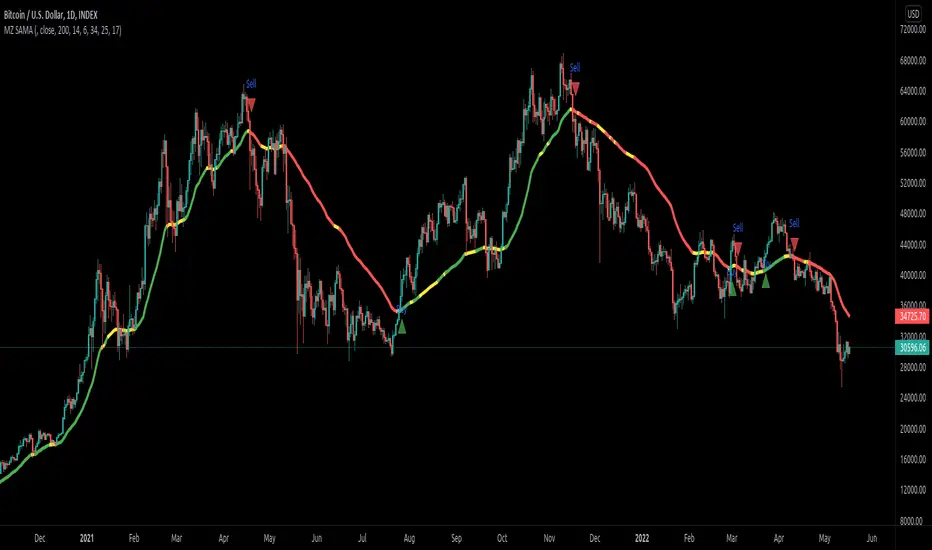
Slope Adaptive Moving Average (MZ SAMA)INTRODUCTION
This script is inspired from "Vitali Apirine (Stocks & Commodities V.36:5: Adaptive Moving Averages)" and a correction to Dynamic Volume Adaptive Moving Average (MZ DVAMA) . I have used slope filtering in order to adapt trends more precisely for better trades.
Slope adaption makes it better for adaptive moving average to detect trend health; making it easier to make decisions based on market strong price momentums, consolidations or breakouts. This isn’t possible with only using simply Adaptive Moving Averages .
Adaptive Moving Averages curve doesn’t change its length based on Slope but it uses slope adaptive color for trend strength detection.
TREND DETECTION
Green Color:
Strong Uptrend with good price momentum.
Red Color:
Strong Downtrend.
Yellow Color:
Market is either choppy, sideways or consolidating. Better to avoid taking new positions and if trade is running then its good to carry it on.
DEFAULTS SETTINGS
AMA length is 200 (Better for timeframes higher than 1H)
Minor length is 6
Major length is 14
Slope period is set to 34 with 25 of initial range. Consolidation is always below 17.
ALERTS
Buy/Sell Alerts will follow on when slope is out of consolidation/choppiness area. Best entry is at absolute alerts timing but other trades can be started midway based on trend condition.
Dynamic Volume Adaptive Moving Average (MZ DVAMA)INTRODUCTION
This indicator is inspired from "Vitali Apirine (Stocks & Commodities V.36:5: Adaptive Moving Averages)" but I have used Volume filtering to in order to adapt trends more precisely for better trades.
Volume adaption makes it better for adaptive moving average to detect trend health; making it easier to make decisions based on market strong momentums, consolidations or breakouts. This isn’t possible with only using simply Adaptive Moving Averages .
Adaptive Moving Averages curve doesn’t change its length based on Volume but it uses dynamic volume adaptive color for trend strength detection.
TREND DETECTION
Green Color:
Strong Uptrend with good volume supported momentum.
Lime Color:
Uptrend is relatively weak but still good enough to follow.
Red Color:
Strong Downtrend with volume support.
Gray Color:
Downtrend is relatively weak but still good enough to follow.
Yellow Color:
Market is either choppy, sideways or consolidating. Better to avoid taking new positions and if trade is running then its good to carry it on.
DEFAULTS SETTINGS
AMA length is 200 (Better for timeframes higher than 1H)
Minor length is 6
Major length is 14
Volume RSI period is considered to be 200 with 50 period for its Hull Moving Average
ALERTS
Buy/Sell Alerts will follow on when volume is breaking up above provided value. Best entry is at absolute alerts timing but other trades can be started midway based on trend condition.
BTC Golden Bottom with Adaptive Moving AverageIntroduction:
This study uses Adaptive Moving Average with 1 year of length to plot on all time history Index Calculated by Tradingview . All previous $BTC bear runs bottomed on this curve which makes it important enough. Use this only on " "
Default Values:
AMA length is 1 year
Minor length is 50
Major length is 100

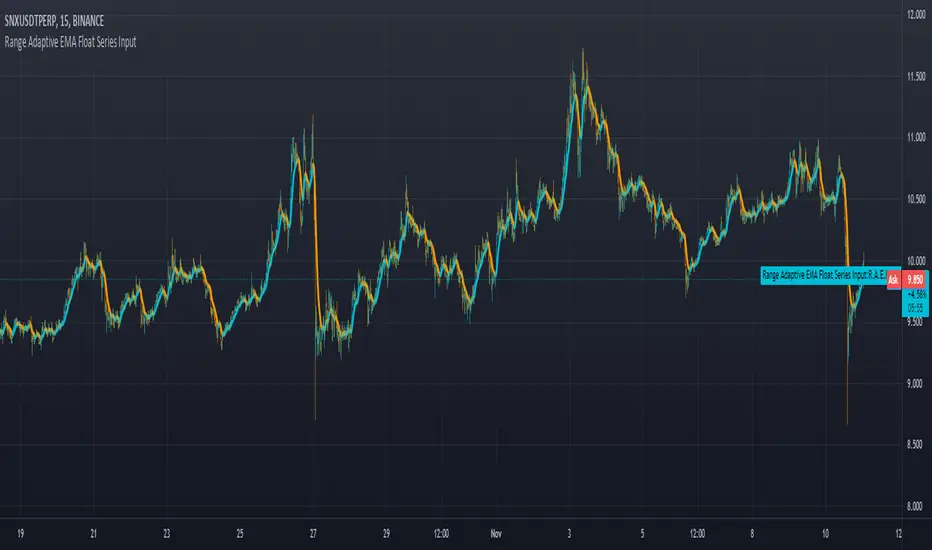
Range Adaptive EMA Float Series Inputuses range and change distance on arrays to allow for more control as well as any choice of input value as a controller for how tightly it grips the input signal.
Adaptive Relative Strength (ARS by Premal Parekh)Dear All,
This is my first public script modified to adapt the concept of Mr. Premal Parekh on Adaptive Relative Strength - ARS)
The original Script is developed by modhelius.
I have proved the version as per my requirement and included concept of ARS.
This script will remove the manual calculation task which is required on daily basis to calculate number of sessions from ARS Date.
Hope this script will be helpful.
If yes, do hit like button and share with your friends.
Ashish Kesarkar
India

Relative Strength Improved (Premal Parekh ASR Version)This script is improved over the existing script developed by Mr. modhelius
I have added ASR Concept of Mr. Premal Parekh.
This script will remove manual calculation of Trading Days from ASR Date.

Ehlers Kaufman Adaptive Moving Average [CC]The Kaufman Adaptive Moving Average was created by Perry Kaufman and this is a variation of that original formula created by John Ehlers. I have included a side by side with an original script (blue line) done by @HPotter that shows that Ehlers version is slightly more reactive compared to the original version. I have included strong buy and sell signals in addition to normal ones and so darker colors are strong signals and lighter colors are normal ones. Buy when the line turns green and sell when it turns red.
Let me know if there are any other scripts you would like to see me publish!

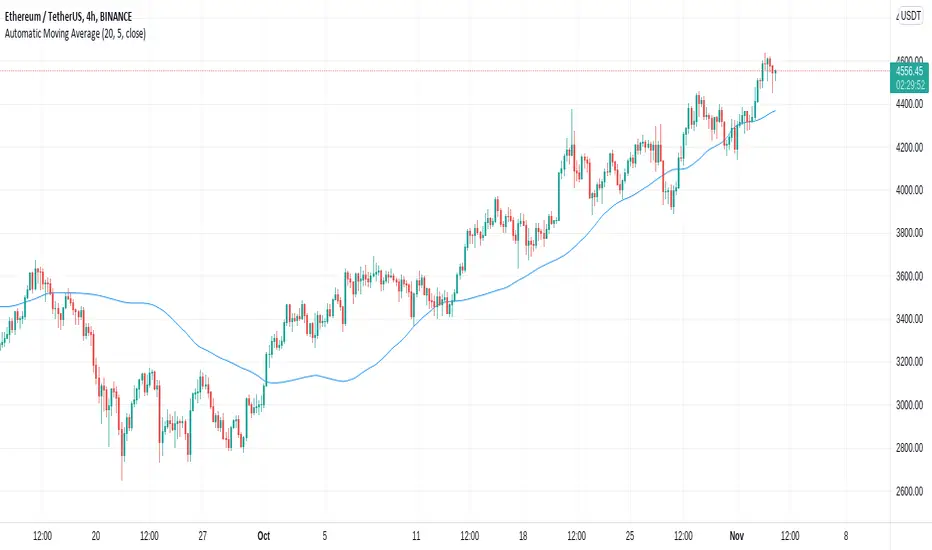
Automatic Moving AverageAutomatic moving average removes the need to set the moving average length manually. The indicator progressively finds a suitable length that minimizes the number of candle body touches and maximizes the number of wick touches.
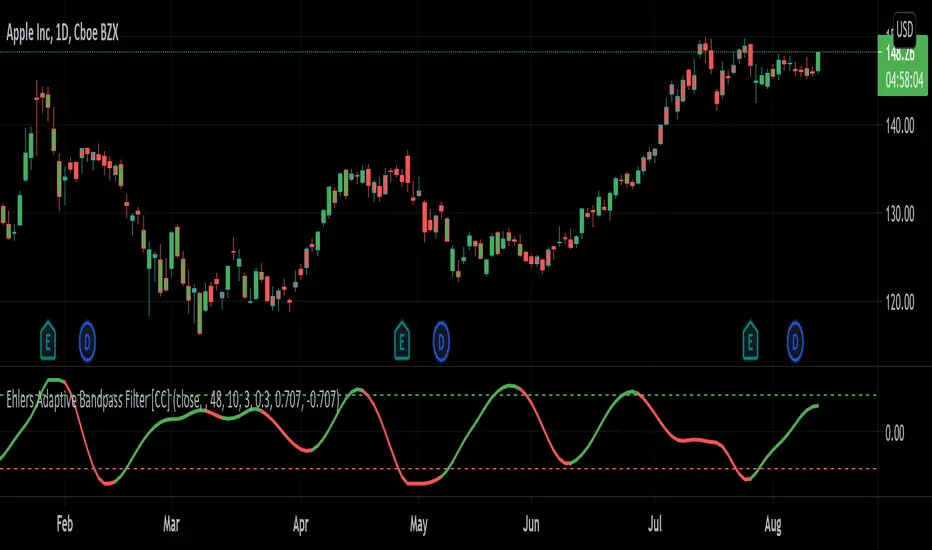
Ehlers Adaptive Bandpass Filter [CC]The Adaptive Bandpass Filter was created by John Ehlers (Cycle Analytics For Traders pgs 153-156) and this uses his autocorrelation code to provide the adaptive lengths to use for the underlying bandpass filter. The bandpass filter is a common way in digital signal processing to filter out the underlying noise in the data. It can actually be turned into a leading indicator by changing the bw variable to a smaller amount. Since this indicator is adaptive using the cycle period, the buy and sell signals are different compared to the normal bandpass filter. Buy signals for this indicator according to Ehlers are when the line is red and the line is under the oversold line (also red) then you buy when the indicator line turns green and then you exit when the indicator line turns red and is above the overbought line. This indicator doesn't provide clear buy and sell signals in all circumstances but generally speaking buy when the indicator line turns green and sell when it turns red. Feel free to experiment with this one.
Let me know if there are any other scripts you would like to see me publish!
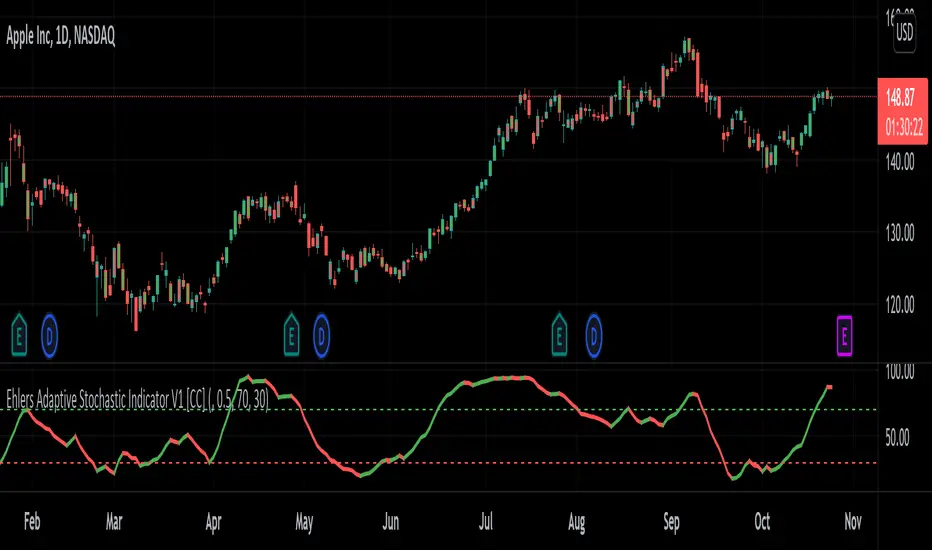
Ehlers Adaptive Stochastic Indicator V1 [CC]The Adaptive Stochastic Indicator V1 was created by John Ehlers (Rocket Science For Traders pgs 233-234) and this indicator uses the same calculations to find a cycle period that is then used for both the creation of the stochastic indicator but also for the smoothing to create a double smoothed stochastic indicator. Because it is calculated this way, this indicator is more reactive than almost any other stochastic indicator and provides clear buy and sell signals especially when the underlying stock is trending. It is interpreted in the same way as a normal stochastic indicator so great buy signals are when the indicator is below the oversold line and starts to move up and vice versa. Buy when the line turns green and sell when it turns red.
Let me know if there are any other indicators you would like to see me publish!
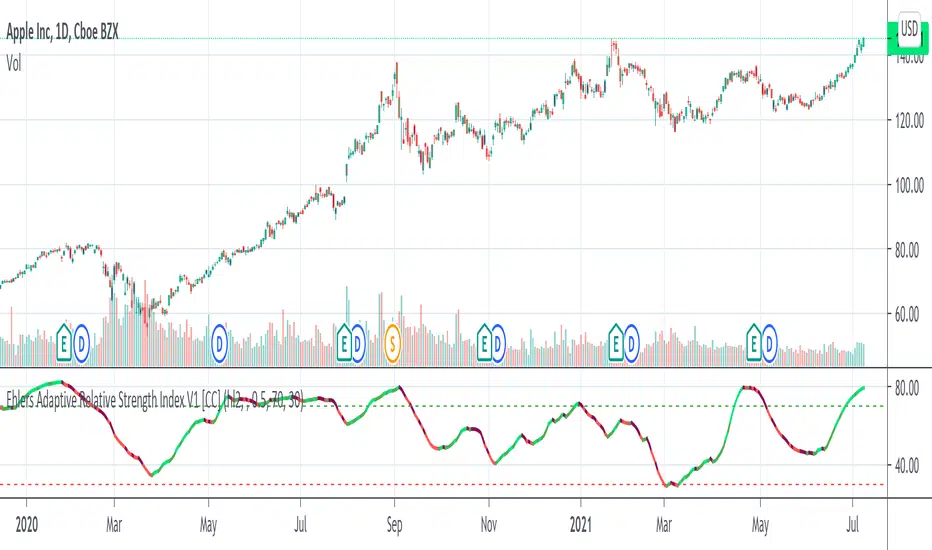
Ehlers Adaptive Relative Strength Index V1 [CC]The Adaptive Relative Strength Index was created by John Ehlers and this is his first version. I will of course publish his updated version at a later date along with publishing the final script from Jim Sloman's Ocean Theory book. I have changed his script to include extra smoothing to provide clear buy and sell signals. This is a version of a RSI that is very adaptive to changes by finding the length of the current cycle and using that to calculate the rsi and I use this same basic process to provide extra smoothing. A great strategy of course is to buy right after the indicator goes from below the oversold level to right above it and stay in until the indicator turns red or when it reaches the overbought level. I have included strong buy and sell signals in addition to normal ones and the darker colors mean strong signals and lighter colors are normal signals.
Let me know what other indicators you would like to see me publish!
Ehlers Smoothed Adaptive Momentum [CC]The Smoothed Adaptive Momentum indicator was created by John Ehlers and this indicator gives a lot of useful information. When the indicator is above 0 then there is very strong upward momentum and when the indicator falls below 0 then there is very strong downward momentum. A very profitable way to use this particular indicator is buy long when the indicator is below 0 and it crosses over it's signal line and then sell of course when you get the first sell signal. I have included strong buy and sell signals in addition to normal ones so darker colors mean strong signals and lighter colors are normal signals. Buy when the line turns green and sell when it turns red.
Let me know if you have any other scripts you would like to see me publish!

Ehlers Adaptive Cyber Cycle [CC]The Adaptive Cyber Cycle was created by John Ehlers and this is a cycle based indicator which you don't find too many of these days. Each stock goes through cycles which are repeating patterns of price movement and cycle indicators help you find the timing of the cycle to capitalize on the underlying cycle. That is an extremely simple explanation but most importantly don't interpret these indicators as the same as other indicators because it may seem like there are very many false signals but that is because of the different cycles the stock is undergoing. Buy when the line turns green and sell when it turns red.
Let me know if there are any other indicators you would like to see me publish.

Cyclic Smoothed RSI MTFAdaptive cyclic smoothed Relative Strength Indicator (csRSI MTF)
The cyclic smoothed RSI MTF indicator is an enhancement of the RSI , adding zero-lag smoothing, adaptive oversold/overbought bands and period color highlighting from higher timeframe to filter signals.
Providing the following advanced features:
using the current dominant cycle length as input for the indicator to ensure more accurate change in trends,
additional smoothing without introducing lag and maintaining clear sharp turns for signal generation,
adaptive upper and lower bands to avoid whipsaw trades and adapt the indicator to trending/cyclic conditions,
using higher time-frame csRSI oversold/overbought conditions to automatically highlight time windows with green/red backgrounds on the indicator panel for signal filtering and/or alert rules,
can be used to trigger alerts on your key symbols to get informed when a red/green windows are reached.
The following common problems with standard indicators are solved by this indicator:
First, normal indicators introduce a lot of false signals due to their noisy signal line. Second, to compensate for the noise, one would normally try to add some smoothing. But this only results in adding more delay to the indicator, which makes it almost useless. Third, oscillators contain static threshold levels to define oversold/overbought conditions. However, the market is not static and changes between trending and cycling periods. In trending periods, these static oversold/overbought levels are useless ore will trigger too much whipsaw trades. Finally, indicators don't take their state from other timeframes into account to filter signals.
All four problems described above are solved by the developed adaptive cyclic RSI with embedded MTF period highlighting.
Examples
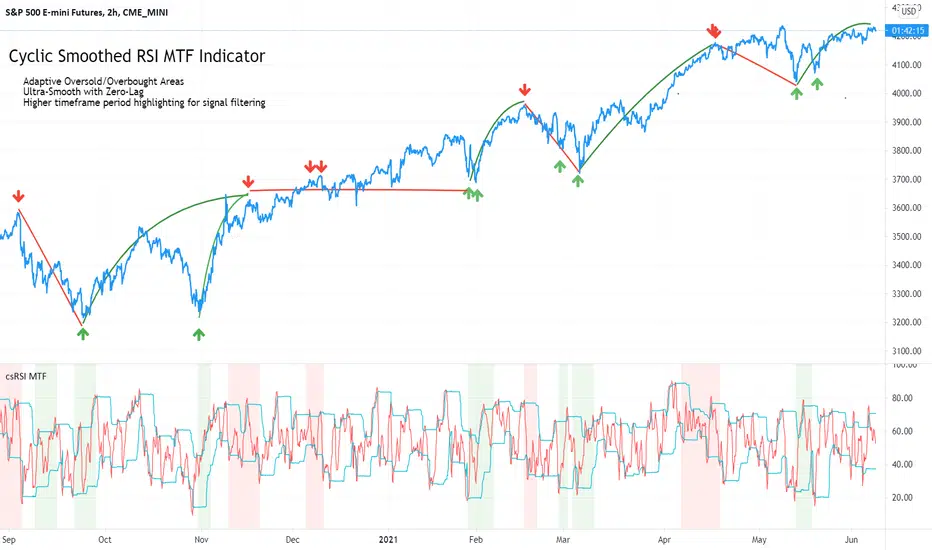
S&P500 EMini Futures - csRSI 2H chart / 1D filter example signals
S&P E-Mini Futures 2h chart with daily higher time-frame filtering period for the csRSI, showing the standard RSI in the lower panel for signal comparison, signals from the csRSI are marked on the price chart
Bitcoin BTC /USD - csRSI 2H chart / 1D filter example signals
Bitcoin BTC /USD 2h chart with daily higher time-frame filtering period for the csRSI, signals marked
EUR/USD Forex - csRSI 20min chart / 2h filter example signals
EUR/USD 20min chart with 2H higher time-frame filtering period for the csRSI, signals marked
Info:
All three examples are setup with the basic standard settings and no additional parameter adjustments. The placed arrows on the price/indicator panel and the projection price areas have been added manually to visualize the signals for an discretionary trading approach. They are derived based on standard technical indicator oscillator readings (signal turn above/below bands). Due to the nature of the indicator (ultra-smooth, sharp curves, dynamic bands), these signals are easy to spot, and will help to avoid whipsaw trades in volatile conditions.
Settings & Parameter
The Inputs section allows you to select the time frame for the indicator signals. We recommend keeping the indicator time-frame according to your chart time frame ("Same as chart"). The cycle length allows to improve the signals by entering the dominant cycle length of the analyzed dataset. This parameter is optional if the current dominant cycle is not known. In that case, leave it at 20. The dominant cycle length can even improve the indicator signal generation. The examples above have not been optimized by using the dominant cycle length and just used the standard setting of 20.
The MTF CYCLE FILTER area is used to set the time-frame used as filter to plot the colored indicator background in red and green areas when the higher time-frame indicator is above (red) or below (green) the dynamic bands. These indicate the period of time with high probability to look for signals on the main indicator line.
The MTF Resolution parameter input is important for generating the highlighted red/green areas on the indicator panel. You must enter a higher time-frame than your indicator time-frame in order to get the reliable highlighting. We recommend the following combinations of trading time-frame and filter time-frame resolutions:
Chart Timeframe | MTF Indicator Highlighting Resolution
------------------------------------------------------------------------
20 min | 2 h
2 h | 1 d
You can enter the current dominant cycle length on the chosen higher time-frame resolution to even further optimize the indicator accuracy in the field "MTF CYCLE FILTER - Cycle Length".
The Style sections allows to active/de-active individual plots. The standard setting disables the higher time-frame csRSI indicator which is only used to indicate the colored areas. If required, you can also enable the MTF indicator and adaptive bands to be plotted in the same indicator panel. The values shown in the style section also indicate which values are available for individual alert generation.
Automatic Signals & Alerts
It is possible to create your own automatic signals with the csRSI MTF indicator using the TradingView alert function. Click on the three dots "More" beside the indicator name label and select "Add Alert on csRSI ..." from the context menu. For example, if you want to receive an alert when the high probability periods (red/green highlighted areas) have been reached for a symbol without manually watching the indicator panel, you can set up a custom alert. The csRSI indicator provides the raw values necessary to set up your alarm conditions. Set the "CSRSI MTF" as the value for the "Out of Channel" condition and select the "HigBand MTF" and "LowBand MTF" indicator values as the upper and lower limit parameters in the alarm's dialog box. Once you have set up this alarm, you will not need to monitor your charts manually. The TradingView alert will inform you as soon as an important time zone is reached. These are the situations when you would open the chart and watch for trigger signals on the indicator line. If you set up this alert as an email, you can even focus on other things and let the csRSI MTF highlighter condition alert you when you should pay attention to the trading chart.
Usage & Trade Signals
Classic rules apply as with every technical oscillator. In addition use this indicator to identify the following conditions:
Indicator turns above/below the adaptive upper and lower bands (expected trend reversals)
Indicator crosses below upper band / crossed above lower band (start of trend reversal)
Indicator crosses above upper band / crossed below lower band (trend continuation/confirmation)
Divergence between price / indicator indicate strong signal confidence
Hidden divergences between price/indicator indicate string signal confidence
After strong price movements, wait for the second signal confirmed by a divergence
Use the mentioned conditions in the highlighted red/green periods indicated by the MTF settings
Purpose & Disclaimer
This indicator is not designed for use as an automated trading strategy. This is an improved technical indicator using the dominant cycle to provide its advanced features. The basic applications of technical analysis for using oscillators apply. The script is intended for use in discretionary trading and can be used as a part of automated systems. Indicator signal failures will occur as you should expect with every technical indicator. If you are not sure if this indicator might help your trading style, please try and check our open source public version which will give you basic understanding upfront.
Basic open-source public version
This indicator is an advanced version of our public available open-source cyclic smoothed RSI indicator named "RSI cyclic smoothed v2". The advanced invite-only version provides fully automatic time frame highlighting by using a cyclically smoothed RSI from a higher time frame to indicate time frames with high probability signals. These high probability windows are highlighted when the indicator from the higher time frame is in dynamic overbought or oversold territory. You will find the basic open-source public version here below for your own review:
How to get access
Please check the "authors instructions" section for further details.
Script a pagamento
QF VZO QF VZO is a leading volume oscillator
Its advantage is in giving leading buy/sell signals based on volume conditions and identifying overbought/oversold volume conditions, along with extreme overbought/oversold situations which lead to a change in sentiment, and most probably, leads to change of the current trend. QF VZO also has leading divergences to potentially spot trend reversals and trend continuation with almost zero lag.

QF FISHERQF fisher is based on John Ehler's fisher transform which converts prices into a Gaussian normal distribution. Its usefulness is in identifying overbought and oversold levels and due to its sharp reversals it provides fast divergences with high accuracy.
QF Fisher is calculated using adaptive period to work on multiple timeframes.

The Trend Oracle - The Ultimate Position ToolThe Trend Oracle is a superadaptive multi-timeframe Indicator
Ideal timeframes are 4H, and 1D
It is based on a combination of several other indicators including:
- The Superstrength Index - An adaptive indicator using volume weighted average of the traditional RSI, MFI and OBV
- The Superfast MACD - An adaptive zero lag MACD
- ADX Trend - A tweaked version of the ADX
- Chop Zones - A combination of 2 Chop indexes to identify trending and non trending conditions.
- The Adaptive Supertrend - An adaptive version of the Supertrend, (switching multipliers based on the market trend)
- Breakout & Breakdown - An algorithm computing volume compression and expansion to indicate breakout & breakdown signals.
- [bBullish and Bearish Divergences - Confirmed Bull and Bear divs shown as green and red dots at the top and bottom of the indicator.
Areas highlighted in Aqua are bullish, red are bearish.
Use this indicator as a tool to position yourself over longer timeframes.
Enjoy!
MM :)

Dominant Cycle Adaptive MACDThis Indicator is based on classic MACD but with an exceptional smoothing.
This smoothing eliminates the noise of the classic MACD as you see in the Chart
Adaptive MACD is compiled using with two adaptive moving averages, one adaptive to the dominant cycle and the other adaptive to twice the dominant cycle. As the basic behind the MACD is the difference of two moving averages we cannot find much difference between the conventional MACD (12, 26) and the adaptive MACD. However the adaptive MACD is less prone for less whipsaws and it catches the trends very well at the same time the catches the turning points in time. The Adaptive MACD is definite one notch better than the conventional MACD.
Dominant Cycle Period is calculated using Ehler's Method {Mentioned in the code}
This is how the Adaptiveness Impacts the Price Chart
1. (12, 26 EMA) VS Adaptive Dominant Cycle EMA
2. See how the Adaptive Lengths {both FastLength and SlowLength changes with time!}
Enjoy!