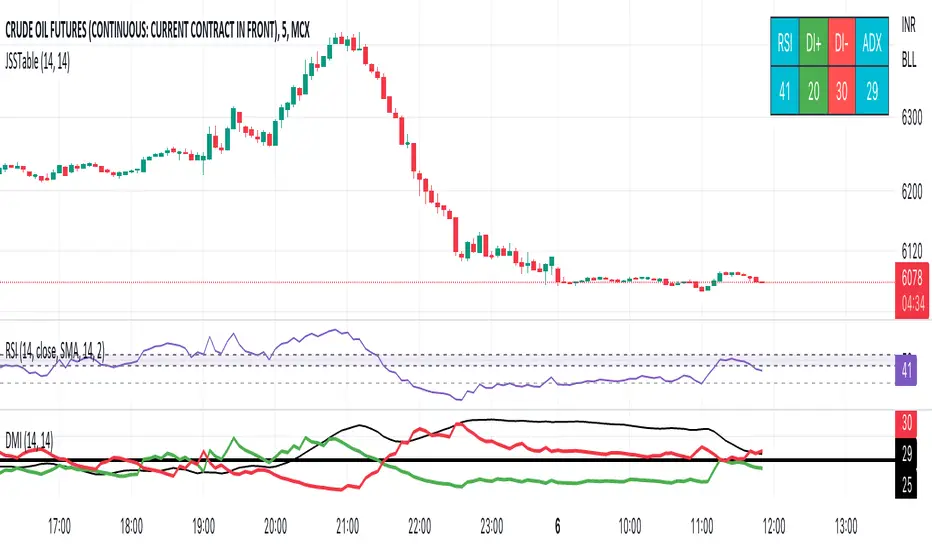
JSS Table - RSI, DI+, DI-, ADXSimple table to show the values for indicators which can be used to initiate trades:
RSI: Long above 55 // Short below 45 // Choppy between 45-55
DI+: Long above 25
DI-: Short above 25
Note when to avoid trend trades:
- If DI+ and DI- are both below 25 then market is choppy
- If RSI is between 45-55 then market is choppy
ADX-DI
adx: Configurable ADX (library) Library "adx"
Calculate ADX (and its constituent parts +DI, -DI, ATR),
using different moving averages and periods.
adx(atrMA, diMA, adxMA, atrLen, diLen, adxLen, h, l, c)
Parameters:
atrMA : Moving Average used for calculating the Average True Range.
Traditionally RMA, but using SMA here and in adxMA gives good results too.
diMA : Moving Average used for calculating the Directional Index.
Traditionally, RMA.
adxMA : Moving Average used for calculating the Average Directional
Index. Traditionally RMA, but using SMA here and in atrMA gives good results
too.
atrLen : Length of the Average True Range.
diLen : Length of the Directional Index.
adxLen : Length (smoothing) of the Average Directional Index.
h : Candle's high.
l : Candle's low.
c : Candle's close.
Returns:

asw Stochastic + DIStochastic and ADX (not plotted) DI positive and negative combined.
This is done to remove the lines of DI +/- and make chart cleaner with just single point plot showing DI crossing.
DI + above DI - = Green dot shown (bullish signal)
DI + below DI - = Red X-cross shown (bearish signal)
Enjoy!

ADX and DI With Coloured Histogram BUY/SELLWe display here the ADX has a colored histogram, which is
- green when ADX and DI+ are higher then DI-, while the ADX is increasing, meaning that we are in a potential uptrend--> we should rather be long (only buy if you have other concordant signals !)
- red when ADX and DI- are higher then DI+, while the ADX is increasing, meaning that we are in a potential downtrend --> we should rather be short (only sell if you have other concordant signals !)
- not visible if none of these conditions are met, meaning that the indicator do not show a potential trend --> don't use this indicator to buy or sell at this stage

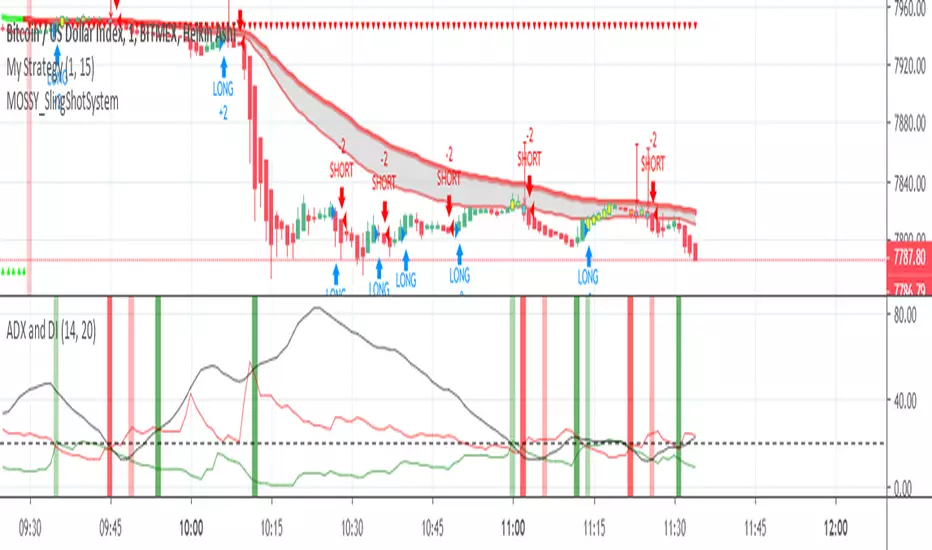
Mossy ADX and DI with Buy/Sell SignalsBasic ADX DI with colored bars to show buy and sell signals , made for 1min but shows general signals of strong or weak buy and sell signals.
Dark Red = Heavy Signal
Light Red = weak signal
Green = buy signal
Dark Green = Heavy Signal
Colors are to confirm or warn, Buy/Sell points are where to enter and exit.
Mossy ADX DI colored bars for quick scalping, works best with Heikin Ashi, confirm with other indicators, Mossy Pop is one shown and works well to confirm.

Mossy ADX and DIBasic ADX DI with colored bars to show buy and sell signals , made for 1min but shows general signals of strong or weak buy and sell signals.
Dark Red = Heavy Signal
Light Red = weak signal
green = buy signal
ADX and DI StrategyThis strategy is a port of famous script from MasaNakamura ADX and DI
Original study from MasaNakamura MasaNakamura at
Scope of this port is to identify corrects inputs to get best results from signals that indicator gives.
I added the possibility to choose stop loss and take profits and to smooth the results also with heikin ashi candles.
Please use comment section for any feedback.
Next improvement (only to whom is interested to this script and follows me): study with alerts on multiple tickers all at one. Leave a comment if you want to have access to study.
********************************** IMPORTANT*******************************
I have developed an expert advisor for metatrader4 (MT4) and for jforex platform: results of expert advisor form 2015-01-01 to 2018-11-25 are very good with low drawdown and good profit.
********************************************************************************

Color CandlesUses 6 most common indicators to color candles when they give buy/sell signals.
Use line view to see candle colors.
Purple = 6 buy signals
Teal = 5 buy signals
Navy = 4 buy signals
Lime = 3 buy signals
Green = 2 buy signals
Pale Green = 1 Buy signal
White = neutral
Gray = 1 sell signal
Yellow = 2 sell signals
Orange = 3 sell signals
Red = 4 sell signals
Firebrick = 5 sell signals
Black = 6 sell signals
Parabolic SAR calculated as .02, .02, .2. Traditional Buy/Sell. Green/Red Dots.
Bollinger Band calculated as 20, 1. Buy/Sell when above or below band. Aqua filled band.
MACD calculated with emas 12, 26, 9. Traditional MACD/Signal cross Buy/Sell. Filled Blue/Orange band.
RSI length 14. Traditional Buy/Sell below 30 and above 70. Green/Yellow/Red line below price.
ADX/DI len 14. Traditional crossover Buy/Sell. Filled Lime/Green above price.
Stochastic 14/3/3. Traditional 20/80 Buy/Sell. Filled teal/orange above price.

ADX and DI by T-GODwe change the way that hoe the adx and di shows.
the background shows the adx.
the red color means di+di-.

ADX coded with DIAn easier to read implementation of ADX and DI, with colour indicating direction of trend, oscillator indicating strength of trend, and below threshold shown with a lack of colour (black).
