Seasonal Strategies V1Seasonal Strategies V1 is a rule-based futures seasonality framework built around predefined calendar windows per asset.
The strategy automatically detects the current symbol and activates long or short trading phases strictly based on historically observed seasonal tendencies. All entries and exits are fully time-based — no indicators, no predictions, no discretionary input.
Key Features
Asset-specific seasonal windows (MMDD-based)
Automatic long and short activation
Fully time-based entries and exits
One position at a time (no pyramiding)
Clean chart visualization using subtle background shading
No indicators, no filters, no curve fitting
Philosophy:
This strategy is designed as a structural trading tool, not a forecasting model.
It focuses on when a market historically shows seasonal tendencies — not why or how far price might move.
Seasonal Strategies V1 intentionally keeps the chart clean and minimal, making it suitable as a baseline framework for research, portfolio-style seasonal approaches, or further extensions in later versions.
Intended Use:
Futures and commodity markets
Seasonality research and testing
Systematic, calendar-driven strategies
Educational and analytical purposes
Disclaimer
This script is provided for educational and research purposes only.
Past seasonal tendencies do not guarantee future performance.
Risk management, position sizing, and portfolio decisions are the responsibility of the user.
Agriculture

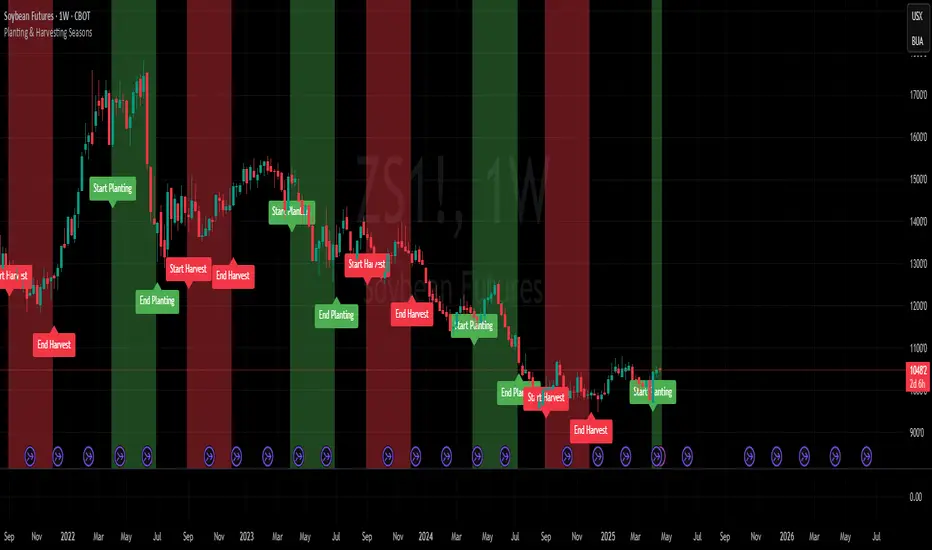
Planting & Harvesting SeasonsHello all,
as a commodity trader, I use a lot of seasonal patterns in my analysis. Some time ago, I came up with the idea to develop a simple script that visually overlays the typical planting and harvesting periods for key agricultural futures directly on the chart.
This script automatically detects the underlying commodity based on the symbol (e.g. ZC, ZW, ZS, CT) and displays color-coded zones for each seasonal window. These zones are based on historical crop calendars and help identify when planting or harvesting typically takes place. The goal is to better align technical setups with fundamental seasonal factors.
This is a basic version and meant as a visual aid — not a trading signal in itself.
Hope you enjoy it and any feedback is highly appreciated!
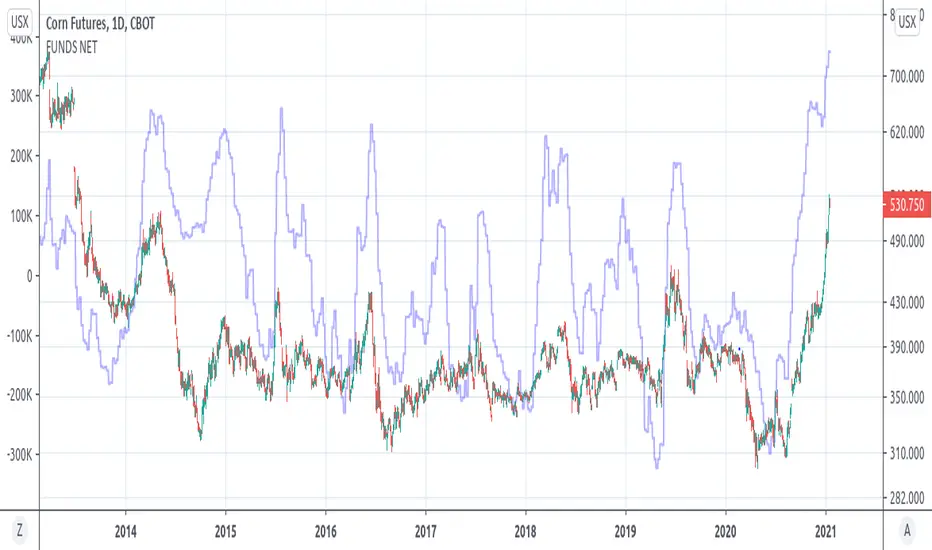
COT GRAINS FUNDS NET POSITION(GRAINSTATS)- Retrieves fund net position from CFTC Commitments of Traders(COT) Reports
- Overlays fund net positions on left y-axis vs price on right y-axis
- Current supported Grain Products
- Corn (CBOT) (QUANDL: 002602)
- Soybeans (CBOT) (QUANDL: 005602)
- Kansas City Wheat(CBOT) (Hard Red Winter) (QUANDL: 001612)
- Oats (CBOT) (QUANDL: 004603)
- Soybean Meal (CBOT) (QUANDL: 026603)
- Soybean Oil (CBOT) (QUANDL: 007601)
- Wheat (CBOT) (Soft Red Winter) (QUANDL: 001602)
(MGEX WHEAT IS UNSUPPORTED)