Unicorn QuantDeeply customizable trading algorithm with instant backtesting. It emulates real trading and displays all the actions it takes on the chart. For example, it shows when to enter or partially close a position, move Stop-Loss to breakeven, etc. The user can replicate these actions in their trading terminal in real time. The algorithm uses up to three Take-Profit levels, and a Stop-Loss level that can move in a trade to protect the floating profit.
The script can send real-time alerts to the user’s Email and to the cell phone via notifications in the TradingView app.
The indicator is designed to be used on all timeframes, including lower ones for intraday trading and scalping.
HOW TO USE
Set the Stop-Loss and up to three Take-Profit levels. Choose the rules for moving the Stop-Loss level in a trade. Adjust the sensitivity of the trading signals. And check the backtest result in the Instant Backtesting dashboard. If the performance of the strategy satisfies you, proceed with the forward testing or live trading.
When using this script, please, keep in mind that past results do not necessarily reflect future results and there are many factors that influence trading results.
FEATURES
Trading Signals
The feature calculates Buy and Sell signals for trend or swing trading. The user can change the Sensitivity parameter to control the frequency of the signals. This allows them to be adjusted for different markets and timeframes.
Position Manager
To make the Position Manager setup as easy as possible, the algorithm calculates Stop-Loss and Take-Profit levels in Average True Range (ATR) units. They are self-adjusting for any market and timeframe, since they account for its average volatility .
You don't have to worry about what market you are trading - Forex, Stocks, Crypto, etc. With the self-adjusting Stop-Loss and Take-Profit, you can find settings that work for one market and use the same numerical values as a starting point for a completely different market.
Instant Backtesting
After changing any settings, you can immediately see the performance of the strategy on the Instant Backtesting panel. Two metrics are displayed there - the percentage of profitable trades and the total return. This information, as well as the historical trades shown on the chart, will help you quickly and easily evaluate the settings.
SETTINGS
TRADING SIGNALS
Sensitivity - controls the sensitivity of the trading signals algorithm. It determines the frequency of the trading signals. The higher the value of this parameter, the less trading signals you get and the longer trends the algorithm tries to catch. The lower the sensitivity value, the more signals you receive. This can be useful if you want to profit from small price movements.
POSITION MANAGER
SL - sets the Stop-Loss level measured in ATR units.
TP1, TP2, TP3 - set the Take-Profit levels measured in the ATR units.
Close % at TP1, Close % at TP2, Close % at TP3 - set portions of the open position (as a percentage of the initial order size) to close at each of the TP levels.
At TP1 move SL to, At TP2 move SL to - set the rules for moving the Stop-Loss level in an open trade to protect the floating profit.
Show Open Position Dashboard - turns on/off a dashboard that shows the current Stop-Loss and Take-Profit levels for the open position.
BACKTESTING
Use Starting Date - turns on/off the starting date for the strategy and backtests. When off, all available historical data is used.
Starting Date - sets the starting date for the strategy and backtests.
Show Instant Backtesting Dashboard - turns on/off a dashboard that shows the current strategy performance: the percentage of profitable trades and total return.
Leverage - sets the leverage that the strategy uses.
Algo

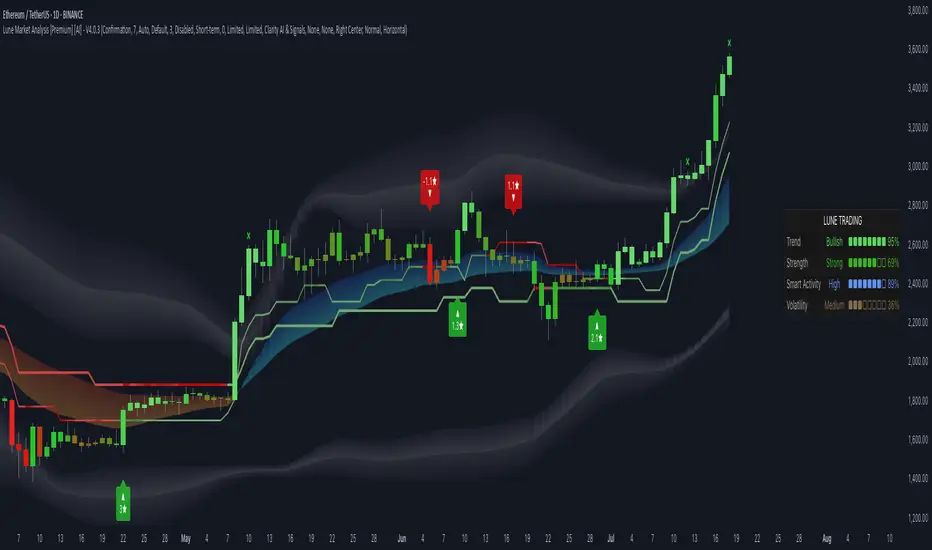
Lune Market Analysis Premium- Version 0.9 -
Lune Algo was developed and built by Lune Trading, utilizing years of their trading expertise. This indicator works on all stocks, cryptos, indices, forex, futures , currencies, ETF's, energy and commodities. All the tools and features you need to assist you on your trading journey. Best of all, Lune Algo is easy to use and many of our tools and strategies have been thoroughly backtested thousands of times to ensure that users have the best experience possible.
Overview
Trade Dashboard—Provides information about the current market conditions, Such as if the market is trending up or down, how much volatility is in the market and even displays information about the current signal.
Trade Statistics—This tool gives you a breakdown of the Statistics of the current selected strategy based on backtests. It tells you the percentage of how often a Take Profit or Stop Loss was hit within a specific time period. Risk and Trade management is very important in trading, and can be the difference between a winning and losing strategy. So we believe that this was mandatory.
Current Features:
Advanced Buy and Sell Signals
Exclusive built-in Strategies
Lune Confidence AI
EK Clouds
Reversal Bands
Vray (Volume Ray)
Divergence Signals
Reversal Signals
Support/Resistance Zones
Built-in Themes
Built-in Risk Management system (take profit/stop loss)
Trade Statistics
Trade Assistance
Trade Dashboard
Advanced Settings
+ More coming soon, Big plans!
Features Breakdown:
Lune Confirmation—Used to help you confirm your trades and trend direction. It uses unique calculations, and its settings can be adjusted to allow traders to adapt the settings to fit their trading style.
Lune Confidence AI—All strategies are equipped with our exclusive built-in Confidence AI. This feature tells you how much confluence there is in a trade. It uses a rating system where signals are given a number from 0 to 5. A rating of 0 indicates that there is not a lot of confluence or confidence in the signal, while a rating of 5 indicates that there is a lot of confidence in the trade. This feature is not perfect and will be improved overtime.
Support/Resistance Zones—Calculates the most important support/resistance levels based on how many times a level has been used as support or resistance. Traders also refer to these as supply and demand zones and key levels.
EK Clouds—Used to further help you confirm trend and was optimized to also be used as support and resistance. This feature is powered by custom moving averages.
Reversal Bands—An optimized and improved version of the infamous Bollinger Bands. When price action takes place within the Reversal Bands it usually indicates that the current symbol is overextended and a reversal is possible.
Vray—Also Known as "Volume Ray", Assists you in better visualizing volume. This helps you find key levels and areas of support that you wouldn't be able to see otherwise. It helps you trade like the institutions.
This indicator's signals DO NOT REPAINT.
If you are using this script you acknowledge past performance is not necessarily indicative of future results and there are many more factors that go into being a profitable trader.
New York Happy HourNew York Happy Hour
Script inspired by Stacey Burke’s 'Trading New York Open 1 Hour a Day'. You know where to search. The algos run on New York time. You’ll be looking to trade from 9.30 AM NY EST using a full day of trading data behind you.
Instruments:
- Gold, major currency pairs, indexes, metals and crypto
Timing: 15 Min
Best Trade Setups:
- 3 Levels (HOD/LOD)
- Trend Trades
- Reversal Trades
- Trading Range
- Or what you see best fit
Script Breakdown:
Sessions:
Asia: 8-11 PM
London: 2-5 AM
New York: 8-11 AM
Other lines:
New York Midnight Open
New York Open
London and NY vertical lines
Previous daily and weekly high and low

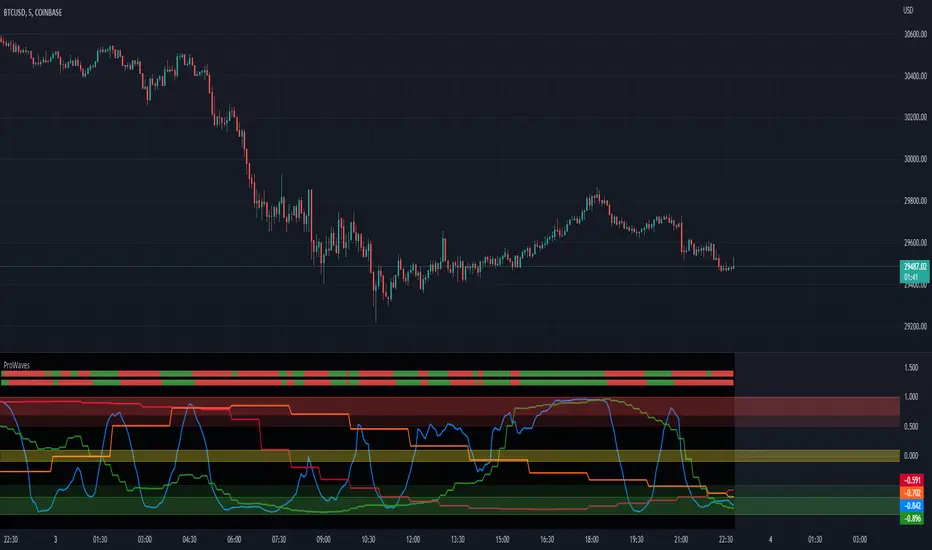
ProWaves - [Soldi]ProWaves
Introducing the latest and greatest tool in the DynaPro Trading Tools! ProWaves is a multi timeframe precision trend tool to help traders identify the waves of the market and trade the convergence, exhaustion points, continuation points of multiple timeframes.
By default you will have a 15m, 1h and 2h Wave on your indicator - this is completely customizable by the user! You can choose up to 3 higher timeframes to display the underlaying wave trend.
How Do I Enter Trades?
To bring ProWaves into a full trading system someone could easily use we have to make a trade trigger system for potential entries - an original and unique Trend Bar system to easily signal a trader that there is an entry present. These trend bars use 2 sensitive weighted moving averages based off the HL2 of the candle, we offset them to create a ribbon like effect to help eliminate any false signals
Include this in your own trading strategy or compile it with DynaPro's other institutional caliber tools!
To use ProWaves effectively you will want to understand wave theory first
This indicator is based off the idea of Elliot wave and fractal cycles of the market, to really understand what this indicator is reading you will need to understand what Elliot Wave is along with fractal cycles in the markets.
What Are The Waves Based On
The waves are primarily a Correlation function to make an oscillated value of "trend", by doing so and measuring this across multiple timeframes we are able to gain a sense of clarity on the tops and bottoms of the markets as well as the trends that take place in between!
NOTE
When the Waves are above/below - 0.5/-0.5 then the wave is in an area of significance for either a reversal or to influence a trend - couple this with the precision of the Trend Bars system then you have a great trading system!
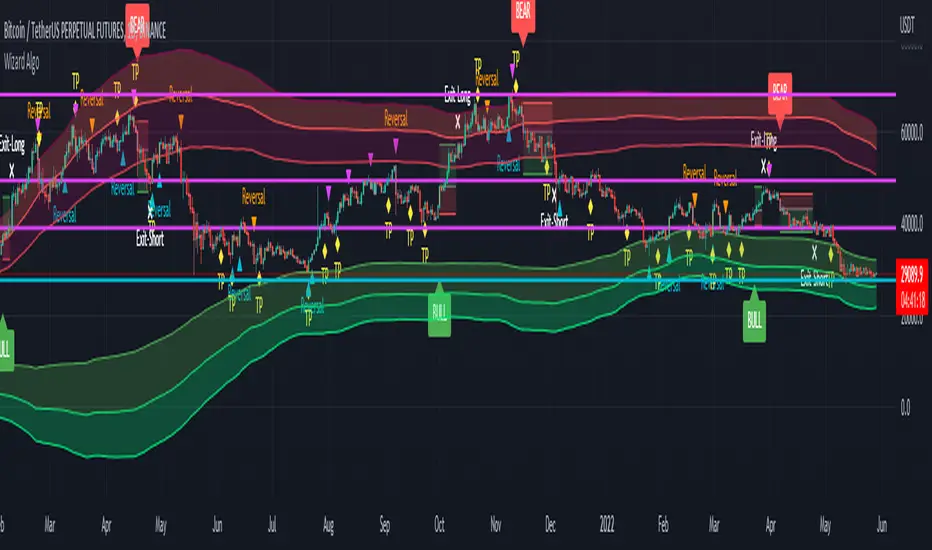
Wizard AlgoWizard Algo:
==============================
Features of the indicator:
- BULL/BEAR Signals
- TP (Take-Profit) and Exit System
- Possible Reversal Signals
- Reversal Scalper
- Reversal Bands
- Trend Bar Colors
- Auto Support/Resistance Levels
- Auto Trend-Lines
================================
Description:
1. Signals: The signals consists of 2 different approaches and the users can choose which signal type they want to use. The indicator gives bull/bear signals based on certain condition, such as trend and momentum. The "TP" signals stands for "Take Profit." These signals help users to decide when to take profits or liquidate all position. The Indicator includes an exit system that can used as another means of closing a position. The exit system uses a 1.5x risk to reward ratio to determine where to keep the take profit and stop loss target.
2.Reversal Scalper: Reversal scalpers are the tiny up(aqua) and down(fuchsia) triangles on the chart. These signals a possible reversal in the price and they can be used to enter a scalping trade. The signals uses mainly momentum and candle price action to determine when there could be a possible reversal in price.
3. Reversal Bands: The reversal band is the green/red cloud like indicator. This can help determine when a price is oversold and therefore, it could reverse. Same goes for the short side, if price is in the overbought territory, then it could reverse to the downside. The reversal bands uses mainly volatility. This is not the same thing as Bollinger bands.
4. Bar Colors: The candle bar colors helps to determine the current trend. The colors are given based on the current trend. The colors lime/red shows strong trend, and orange/cyan/blue shows weak trend.
5. Auto S/R and Auto trendlines: These indicators can be used for determining price actions. Both of these work in similar manner. They mainly look at the previous pivots and draws a line connecting the pivots. S/R are the horizontal lines and the trendline have angles to them.
SIVE 1.0 [Soldi]SIVE 1.0
What is SIVE?
SIVE stands for Systematic Institutional Volatility Expansion, SIVE uses a variety of different statistical indicators to gauge volatility along with trend correlation and other measures to filter and define a price move. This system was originally set out to redefine what a 'Trend Following System' could be; we achieved more than just that. We had created what is considered to be one of the first retail quantitative trading system, that incorporates trend following mechanics as well as trend reversal techniques. All while being aligned/correlated to trend and volatility . Something truly powerful to put into the hands of the every day trader, demystifying what quant trading can be while easily presenting it in a way where even your mom could learn how to use the system without being overwhelmed.
What makes this different from any other trading system?
SIVE raises the bar on what traditional indicators and trading systems can do, traditionally you have lagging indicators that only tell you what happened in the past with no correlation to the market or what can happen in the future. Really providing little to no statistical value, yet completely idolized by the retail world. Where SIVE exceeds these systems is all in the math and the application of those formulas to the time/price, finding the synchronicities to exploit for profits as well as exploiting the high probabilities of non-random events. How we do it? well that's in the secret crabby patty formula.
Where we are now, and where we plan to go
SIVE as it stands right now is the very first iteration of the retail quantitative trading system, it is performing exceptionally well but we aren't take that as our standard as we want to always raise the bar. as it stands, we are already working on the updates to come that will dwarf anything we've done in the past.
Our goal with SIVE is to be able to provide an easy to learn and easy to profit trading system that will provide the retail public with a trust worthy system to use. In the future our updates will carry heavier weight on key aspects like Risk to Reward, Win rates and capturing those big parabolic movements that everyone dreams of. Far fetched? for the traditional indicator junkies, but for a Quant it is just a matter of time.
What does it perform best on?
Simply put, yes... We set out to create this to be used for any trading instrument and any timeframe. Intraday timeframes have been shown to give more trades and typically higher reward trades as your able to execute with a high degree of accuracy 1:2 is very modest and can easily be achieved but we have also seen so so many trades run higher than 1:10 and even 1:20!! but as you already may know the market doesn't always give those favorable conditions to trade that high of a Risk to Reward all the time.
Stocks, Crypto, Forex, Metals, Energies, Indices, etc. are all tradeable with SIVE

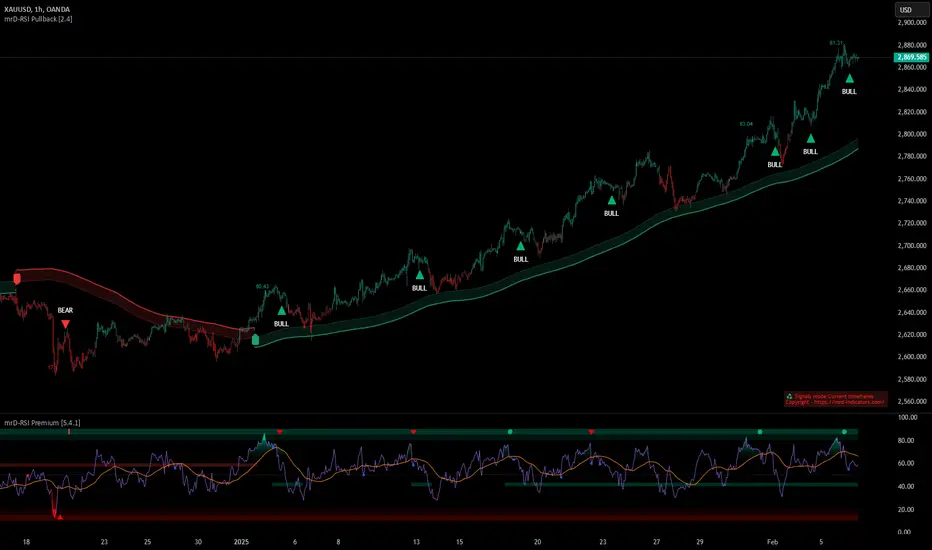
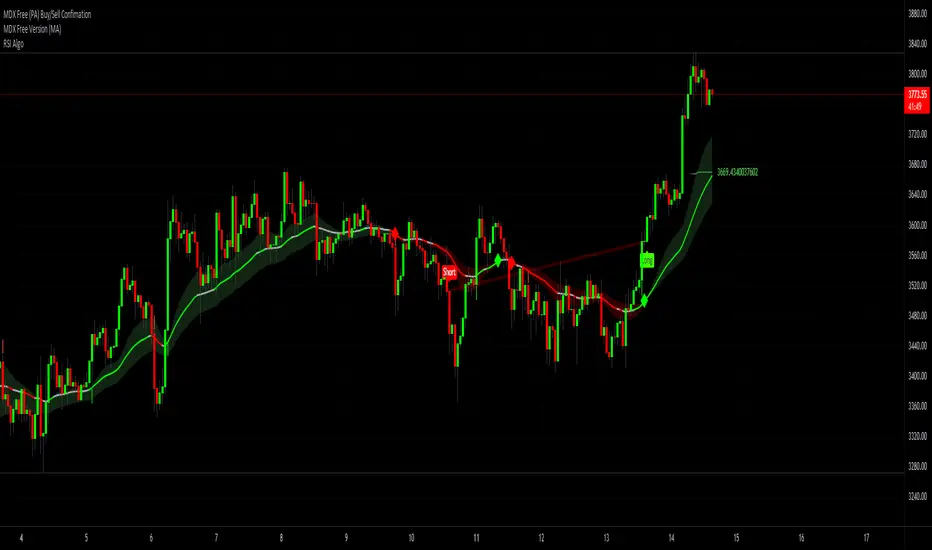
mrDAlgo PremiumBUY / LONG when the Trend Catcher Trend Line cuts upwards and the candle will be green, and the cut candle is above the blue clouds.
SELL / SHORT when the Trend Catcher Trend Line crosses downwards and then the candle cluster will be red, and the prices are below the red clouds.
Moving averages help assess the main trend:
- The price is completely below the moving averages, showing that the downtrend is happening.
- The price is completely above the moving averages indicating an ongoing uptrend.
- The price completely crosses the moving averages showing a sideways trend.
Setting:
A sensitivity setting is recommended for trend confirmation signals.
Show/hide trend catcher
Show/Hide Moving Averages
Alerts: Warn when the signals confirm the trend.
Candle color mode:
Green candle: Strong buy.
Red candle: Strong selling is active.
Purple Candle: Normal buy or sell signal is active.
EQ Cloud: When enabled, a simple "cloud"-like indicator will be displayed on your chart.
The EQ Cloud has a similar effect to the Ichimoku Cloud and can identify the current trend and act as to subsequent support and resistance.
This toolkit is made up of different tools all in one indicator to create your own unique trading strategies.
General disclaimer:
Trading stocks, futures, forex, options, ETFs, cryptocurrency, or any other financial instrument has huge potential rewards but also huge risks.
You must be aware of the risks and willing to accept them to invest in stocks, futures, forex, options, ETFs, or cryptocurrencies.
Don't trade with money you can't afford to lose.
This is not an offer or an offer to Buy/Sell stocks, futures, Forex, options, ETFs, cryptocurrencies, or any other financial instrument.
Do not represent that any account will or is likely to achieve profit or loss of any kind.
Past performance of any trading system or method is not necessarily indicative of future results.
Unreal Algo [UPRIGHT] (cc)Hello Traders,
It's finally that time, I'm releasing my baby out into the world.
Unreal Algo is the answer to the question you didn't know you were asking.
It's for beginners and advanced traders alike. I've made the settings very customizable, but also easy to just jump right in.
How it works:
It uses tons of calculations, confirmations, and filters to bring you the most accurate predictive algorithm possible. The algo will automatically adjust to different volatility in the market to still provide accurate signals and confirmation. It will automatically show support and resistance in real-time. A Moving Average cloud with speeds varying from extra fast to slow; they will help traders confirm whether they should stay in the trade. Also, I added 2 stoplosses, because the importance of risk management should always be emphasized even with strong accuracy.
Features:
---The Most Accurate Signals on the planet.
--------Buy/Sell, Up/Down direction change, and Red/Green arrows.
--- MA cloud with beautiful color blend that can act as a confirmation of direction.
-------- 17 different types/versions of moving Averages to choose from.
--------Easy line transparency and toggle adjustments.
--------Easy cloud transparency adjustments.
--- Support and Resistance .
--- Advanced PSAR that will show red when bearish while in a bullish trend, and visa-versa.
---Potential Orderblocks that can be extended to show a grid (adding additional support/resistance information).
--- Fibonacci Lines.
--- Pivot bar that changes colors based on pivot direction.
---Resistance Breakout and Support Breakdown Signals .
--- Relative volume & momentum bar coloring.
---Two Separate Stoplosses .
--------Circles change color and flip to top and red for Short, bottom and green for long.
--------Horizontal stoploss that tracks the price and flags to take profit. White for Long and Yellow for short.
---As always... Fully customizable .
Different customization options:
Without stoplosses and Support/Resistance.
Without Support/Resistance, arrows and psar removed.
Added back Support/Resistance, lightened MA cloud
Fully loaded (minus trailing stoploss)

[UPRIGHT] Awesome DMI+Hello Traders,
Today I'm releasing a spin on an 'oldie but goodie'; the Directional Movement Index (DMI).
DMI is a combination of 3 different indicators developed by the famous J. Welles Wilder. DMI has 3 different plots: the ADX, +DI, and -DI. The first is the ADX (Average Directional Index), which Wilder created in 1978 to show the strength of a trend by comparing the current price with the previous price range. The other two are the +DI (positive directional indicator) and the -DI show up as two separate lines, +DI is the difference between the highest price of the current day and the highest price of the day before, and -DI does the same calculation with the current and previous day's lows.
How does it work?
When the ADX line is above 25 (as a general rule, some traders use a different threshold, +/- 5), the trend is strong. When the +DI line is above the -DI line, the asset (stock) is moving in an uptrend, and the opposite means the asset is in a downtrend.
How is this different?
Uses multiple calculations to produce signals for an indicator than normally doesn't have any.
Multiple ADX's, +DI's, and -DI's for better accuracy and clearer direction changes.
Ability to use 2 different background highlight signals and several buy/sell signals.
Fully customizable (as always), ability to turn on or off any signals, change any of the colors to suit your needs.
Added pre-filled Alerts.
The ribbons created by the fill make it easier to see the change in direction of each plot.
The chart should look like:
Cheers,
Mike
(UPRIGHT TRADING)

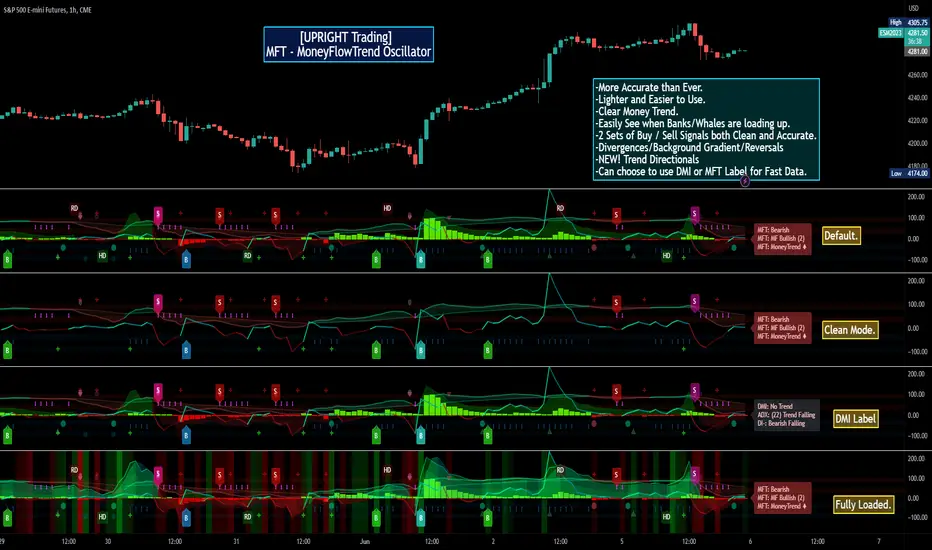
[UPRIGHT Trading] MoneyFlowTrend Oscillator(cc) PremiumHey Traders,
Tonight I'm updating my beloved original MoneyFlowTrend Oscillator with a Premium version.
A little background:
This is an indicator that I've been working to bring to life for years; learning pinescript code has allowed me to do just that.
Built on the idea of Supply & Demand Zones, this utilizes money flow and numerous calculations to create a picture of what is happening underneath the surface of the price action.
Richard Wykoff was one of the first market analysts to explain how the economic cycle can be applied to explain market price action; thus, technical analysis . He described two zones among the total of 4 phases; the two zones are Distribution and Accumulation zones, also known as Supply & Demand zones.
______________________________
Since most of you already know the economic cycle, I will try to be concise.
The basic ideas:
When supply > demand, the price goes up down.
When demand > supply, price goes up.
When demand = supply, the price stays about the same (going sideways).
Price action has --Uptrends, downtrends, and price ranges (consolidation).
Wykoff's 4 phases to explain this price action :
1) Accumulation (Demand zone)
2) Markup (Uptrend)
3) Distribution (Supply zone)
4) Markdown (Downtrend)
______________________________
With all that said, usually you will either see a sharp jump from a supply or demand zone or it will consolidate within it. Until a new one is formed on the chart.
This indicator attempts to put all of that into a lower indicator. I tried to separate the retailers and the banks and then put them back together to get a full picture.
Premium:
-Even MORE (quality & quantity) Accurate signals.
-Reversal Signal added (Circle- shown on chart)
-Cleaner Scaling and Organization.
The chart shown above should look like this:
Good luck traders.
Cheers,
Mike
(UPRIGHT Trading)
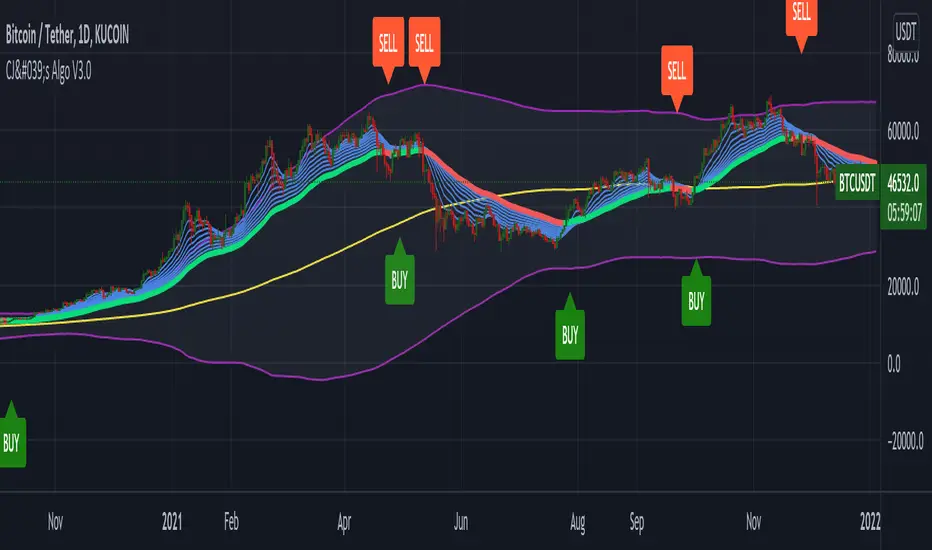
Crypto Jimboo's Algo V3Hey Everyone!
This is the third published version of my algo, Crypto Jimboo's Algo! I am an amateur coder and developer learning each day. This is my attempt at utilizing price action, some market data, and moving averages to make more successful trades. So far, it has proved to be pretty useful. If you are a beginner trader and you are looking for some help on learning how to read charts and understand price action - try this out. I will continue to try to add to it and make it better with time. I have seen success on the 5m, 15m, 1hr, 2hr, 4hr, and daily timeframes to this point. I have left the option of including or not including candlestick indicators/patterns in the settings options of the Algo (it will automatically add the candlestick patterns to the chart until you go into the settings of the indicator and check whatever ones you do not want off). Additionally, I left it so that the colors on the algo can be modified to the user's liking. You can also use the alert dialogue box to set alerts to your computer, email, and phone!
Best of luck and let me know how it works, please!
I have placed my strategy and a snapshot of how my chart looks below.
5m, 15m, 1hr, 2hr, 4hr, and Daily Timeframe Strategy
• For Buy – Ensure the price action is not at the top of the Bollinger Bands (purple lines in the snapshot), the price action is trading above all EMA lines (many blue lines), and check for a green trend catcher (the centerline that turns green and red as the price fluctuates). If the above is true, open a long position.
• For Sell – Ensure the price action is not at the bottom of the Bollinger Bands, the price action is trading below all EMA lines, and check for a red trend catcher. If the above is true, open a short position.
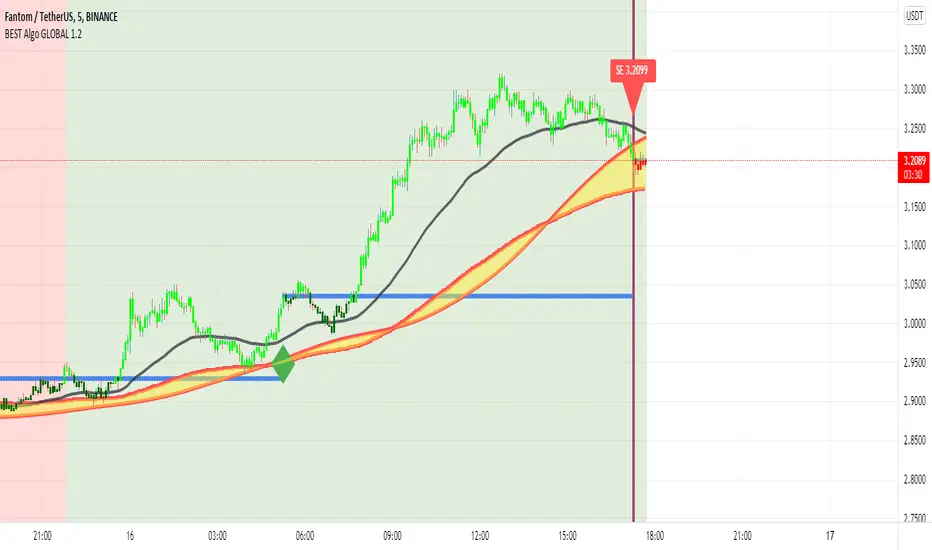
BTI ALGO GLOBALHello traders
I. 💎 SCRIPTS ACCESS AND TRIALS 💎
1. Every trial request access has to be done through my website.
2. My website URL is in this script signature at the very bottom (you'll have to scroll down a bit and go past the long description) and in my profile status available here: Daveatt
3. Many video tutorials explaining clearly how all our indicators work are available on your website > guides section and on our Discord forum.
4. You can also contact me directly for more information regarding the trading method included in the indicator or how to access it
II. Forewords
Algorithm trading has THE ambitious goal to reduce the number of decisions we have to make when trading.
It's so much easier to get a signal whenever all indicators are converging rather than monitoring each one individually.
Even better when that convergence has been found by experienced quant traders - so that our subscribers only worry about managing their trades according to our trading method.
💎 We don't only provide scripts.
💎 The entries and exits are based on our trading method we've built over years across many asset classes (including cryptocurrencies)
Feel free to check us out for more information (links in my profile or signature below)
This indicator is for the Scalpers/Intraday/Swing traders looking for fixed entries based on a trading method designed by 2 experienced traders.
Plus, we iterated during 3 years with our 2K+ traders' community to bring this indicator to life.
We designed this framework for :
- CRYPTO: CRYPTO/USD and CRYPTO/CRYPTO pairing (ex: LTC/ BTC, XRP/ETH, ...).
We're compatible with all crypto brokers (Binance, Coinbase, Kraken, ...) and Decentralized exchanges (Uniswap, Pancakeswap, Anyswap, ...)
If it can be charted on TradingView, we support it.
- International Stocks (US, FR, JP, CA, IN, ...)
- Stocks and Crypto Indices (DOW JONES, DAX, DEFIPERP, SHITPERP, NIKKEI, NFT indices)
- FOREX: All FOREX pairs
- ALL Commodities
It includes :
- our proprietary method with fixed entries
- a hard exit system (built-in stop-loss)
- 🔔 Compatible with dynamic alerts for TradingConnector, Profitview, Autoview, 3commas 🔔
Dynamic alerts are bringing automated trading to a whole new level. The third-party solutions capturing TradingView alerts are able to use them.
- (optional) we let the users decide to use or not our built-in Trade Manager.
Regardless of the Trade Manager is used or not, one must mandatory exit, once a vertical hard exit bar appears.
- the Algorithmic Supports and Resistances used as safeguards and take profit zones.
Final words
We made it as simple as we could (to be honest it's a very simple system for the end-user) - even with several hundreds of calculations in the indicator.
Please hit me up for any questions/feedback/comments
Become the BEST trader that you deserve to be
Dave
RSI Algo (Pinescript v5 + Alerts)Found this the other day and thought it might be useful to have an updated version with alerts:
Credit to the original author.
Fx Crusher Scalping Indicator V1█ OVERVIEW
Scalping Indicator with Buy and Sell Signals for the 15 min and 5 min Chart. Works on all assets (Crypto, Forex, Stocks, Indices, Commodities and Metals)
Only use in trending markets. Signals in a ranging market are useless.
This Scalping Indicator is different from others because most of the Buy/ Sell signals actually make sense. No counter trend trading and most signals can be very profitable when used right.The single most important goal was to have an indicator that shows signals with a big possible risk reward ratio. Most false signals are filtered out. The Fx Crusher Scalping Indicator is not perfect but it is amazing. You can customize the indicator to get the highest signal quality.
█ HOW DOES IT WORK?
The indicator determines the trend direction by using 3 different smoothed moving averages. A green background shows an uptrend and a red background shows a downtrend.
The strength of the trend is determined by the slope of the individual SMMAs. You can set the slope of every single SMMA for buys and sells individually.
The indicator only shows signals when there is a clear trend on the current timeframe.
Entry signals are generated by a combination of Williams fractals, SMMA crossover, trend angle and RSI condition.
█ HOW TO USE?
Draw Support & Resistance lines on the 4H Chart
Determine the overall trend on the 1H Timeframe
Go to the 15 min or 5 min Time Frame and have a look at the signals
Adjust the slope of every single SMMA in 0.01 steps until the signals look good
Adjust the RSI settings for overbought and oversold condition if necessary
Only enter a trade after the candle that prints a signal is closed.
Only take buy positions when all SMMAs are going up and don’t touch each other
Only take sell positions when all SMMAs are going down and don’t touch each other
Only use this Scalping Indicator with proper Risk management and a risk reward ratio of around 1:2.
Trail your stop to get the most pips out of the signals. Very often the indicator shows signals right before major moves.
█ ADDITIONAL INFO
Be careful with buy signals when the market on the higher timeframe (4H and 1H) is in a downtrend and vice versa.
You can make the most profit out of this Indicator when you enter with 2 positions. A quick scalp and a runner. Because there's a lot of signals with huge risk reward ratios but also some unprofitable signals . Therefore make sure you make the best out of the good signals and apply proper risk management to limit losses with bad signals. Stop loss placement according to market structure.
Multiple Signals in a row can show a high probability of a very strong upcoming move. Monitor your trades and secure partials to make the best out of it.
You can select how many signals it is going to show once trend conditions are met. Please be aware that the longer a trend goes, the higher is the probability of a reversal. Therefore the first few signals after all conditions are met are most likely the most profitable.
By setting the slope of the slow SMMA correctly you can filter out most signals in a ranging market.
█ DISCLAIMER
This is not financial advice. I do everything I can to provide the most accurate buy and sell signals for scalping but past results are no guarantee for future performance.

Smart Oscillator PremiumThe Smart Oscillator Premium indicator is a clever oscillator that helps you estimate the direction of trends. It is adaptive to a variety of markets and timeframes and provides rich and colorful visuals using a vibrant color scheme. Aiming to keep things simple, the oscillator only needs one parameter, the length of your base moving average, which defaults to 32.
Overview
As seen in the image above we provide key metrics to assist in choosing smart entry and exit points.
Key Features:
Get a better idea of the trend direction.
Spot divergences in price movements from your chosen moving average.
Using our Smart Candle technology better estimate tops and bottoms.
Using our Whale Sonar technology spot opportunities to enter and exit.
Smart Bollinger Bands using custom Fibonacci levels.
While we believe our default theme is attractive, we expose all style settings to the user to meet their preferences.
Alerts for divergences, with more coming soon.
Road Map:
While we believe this indicator should currently be used in a discretionary manner, we are currently working towards providing you with automated entry/exit signals. We also believe user feedback is a big part of the development process. You can leave us any suggestions or features you may want implemented via our Discord server.
Disclaimer:
By using this script you acknowledge past performance is not necessarily indicative of future results and there are many more factors that go into being a profitable trader.
Access:
See the authors instructions below to get access to our Premium Indicator suite.

Angel Algo PremiumAngel Algo provides a set of tools, combined into one solution. Each tool complements each other and is made to uniquely support your trading decisions for your daily trading tasks. You can immerse yourself into our customizable tools to create your own strategies using them.
With Angel Algo you can:
* Find trend direction using three different algorithms designed for trend following, swing and intraday traders.
* Determine market sentiment, overall trends and volume with our full custom dashboard.
* Get real-time support and resistance levels plotted automatically
* Get trend confirmation using one of the two custom candle coloring algorithms
Trading signals
We have 3 different algorithms for entry signals you can choose from
Regular Buy And Sell Signals
Our regular Buy And Sell Signals are finding optimal times to enter for any security. This algorithm uses our original trend filter based on market volatility that adapts to different assets and market conditions.
We give traders the ability to adjust the sensitivity and aggression of these signals to market price changes, as well as the option to make them less sensitive to ranging markets so you can adjust to any market.
We added Auto Best Settings toggle to automatically optimize the settings for you if you'd like.
By adjusting the sensitivity and aggression parameters you can adopt the signal algorithm to different trading styles. For trend following which tries to capitalize on longer trends you should make the signals to be less frequent by adjusting this parameters. The settings that lead to more frequent signals suit to swing trading style.
Strong Signals Algorithm
The Strong Signals use an algorithm based on trend filtering coupled with confirmation signal based on higher time frame trend direction. It finds "Strong" buy or sells that are a tad different from the regular buy & sell signals you will see, a lot of the time they land on top of each other which can be used as an extra confirmation tool. Traders can also use this as a stand alone on higher timeframes.
Angel Intraday algorithm
We constantly try to push Pine script to its limits developing new features. Angel Intraday is our machine learning algorithm in beta that scans for intraday contrarian signals.
To find entry points it forecasts price range for a trading session using linear regression analysis and Kalman filtering.
If an asset is trading 24 hours a day it works with 12 hour sessions, for stocks it forecasts a price range for 7 hour trading sessions which represent the full trading day.
You can use this algorithm to get intraday trading signals for any asset. One of the advantages of this algorithm is that it gives identical signals for all intraday timeframes. The optimal time frames to view the signals and to enter positions are any.
What is the information in our Dashboard?
We offer real-time dashboard showing useful information to analyze market conditions:
- Angel Algo Trend Detection
- Directional Movement
- Angel Cloud for moving average detection
- Relative Volume
- Overall Market Sentiment
All of this information is aimed to help traders understand when the market regime is changing. The first three features help you to judge about trend strength. Relative volume shows current activity of market participants. Overall market sentiment reflects the actual bias for market direction.
Trend weakness, low market activity and neutral sentiment are the signs that can help you in early detecting of ranging market and avoid false trend signals or switch to contrarian mode.
The tools provided by Angel Algo are designed to help you perform rational actions based on the market data in a systematic way and to reduce emotional factor in your trading.
Using this script, please, keep in mind that that past performance does not necessarily represent future results and that there are trading.

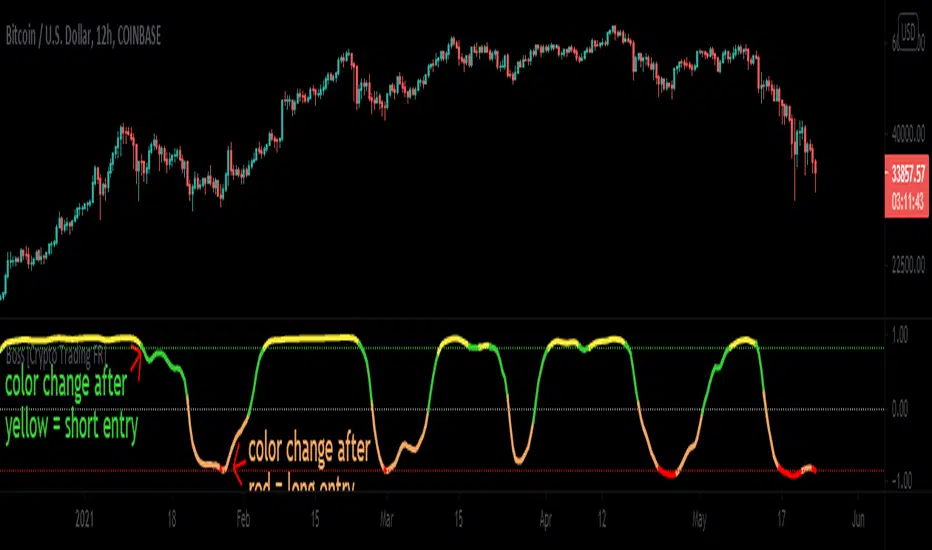
Boss Oscillator [Crypto Trading FR]The Boss Oscillator is a momentum indicator using support and resistance levels and refers to the position of the closing price in relationship to the price range over a period of time. It is calculated as the difference between the close and the low, divided by the price range (the difference between the high and low over a certain period of time). Thus, the indicator takes a value between 0,1 and -0,1 and is expressed in percentage points.
A Boss Oscillator value over 0,92% (yellow) indicates that the security is OVERBOUGHT and a crossover below that threshold represents a potential sell signal while a value below -0,92% (red) indicates that the security is OVERSOLD and a crossover above that threshold indicates a potential buy signal.
Optimal conditions for considering a short Entry
During an uptrend, sell when you get a short signal: the "Boss Oscillator" (yellow overbought line) drops below 0,92% (higher band) and is turning green.
Optimal conditions for considering a long Entry
During a downtrend, buy when you get a long signal: the "Boss Oscillator" (red oversold line) rises above -0,92% (lower band) and is turning orange.
Triggers for scaling/adding into your position = Keeping in mind that this oscillator on its own is not meant to be the sole reason for taking a trade, here are some triggers you will see for getting into position (preferably with the optimal conditions being met) The Oscillator flips from yellow color into a red slide and vise versa. The Oscillator crosses the midline up or down. The Oscillaor begins going up/down and is crossing the midline levels at 0. The Oscillator shift from one color to the next in the favored direction of the trade you wish to make.
Signs for taking profit and protecting your trade = the Boss Oscillator changes colors at the top or bottom.
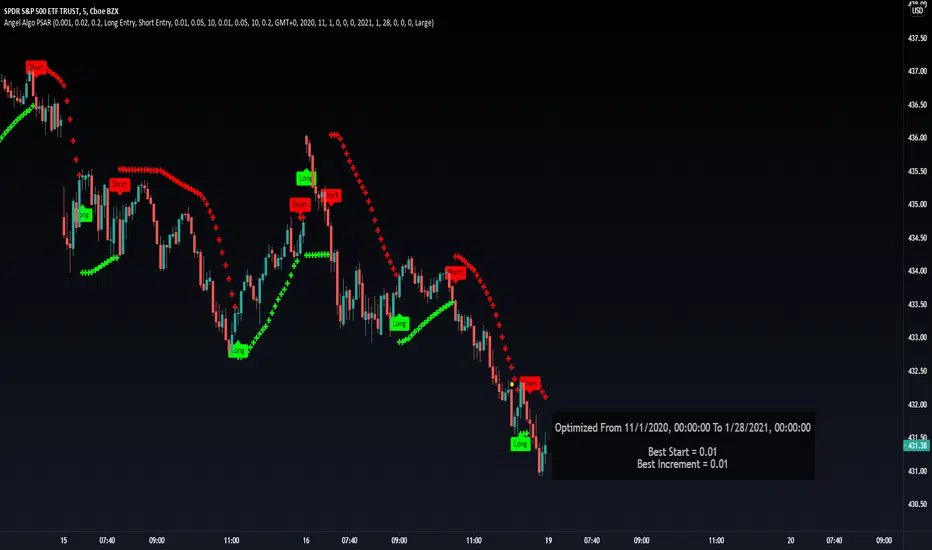
Angel Algo PSARHello, wanted to drop this self learning PSAR Algorithm for you guys
This input is equivalent to "Max Value" in the built-in SAR . It's fairly self-explanatory.
This is the acceleration factor's limit.
I kept it at 0.2 like the standard. You won't typically notice much of a difference when changing this value, unless you decrease it.
The inputs control your date and time settings for the "learning" phase.
The start and end times are also displayed within the info panel.
You can also select your timezone for this. By default, it uses the exchange's timezone. But you can set a custom time zone for this as well.
When time is within this range, the optimizer is actively running and identifying the best settings for start and increment. Once time is outside of this range, the values are finalized.
The last input group is for the info panel.
From here, you can toggle it, as well as select size and colors.
Naturally, this script is quite different from your "run of the mill" PSAR since it uses a form of algorithmic learning to automatically identify the best settings. Or in other words, the inputs are optimized to deliver the best returns over the testing range.
Leave a like or comment!
Had to update the this public script
Percentile Rank Market FilterA simple script to filter bull and bear markets by using percentile rank filter. Using market regimes to filter by bull/bear/sideways markets helps to understand how your strategy will
behave in various market regimes and allows you to avoid unprofitable regimes and only trade in profitable ones.
The idea of market regime filtering is used in the most successful technical algorithmic trading strategies, as one should always design a trading strategy with a particular market in mind according to trading legend, Larry Connors
Feel free to use this script in your strategies to improve your profits and lower drawdowns.

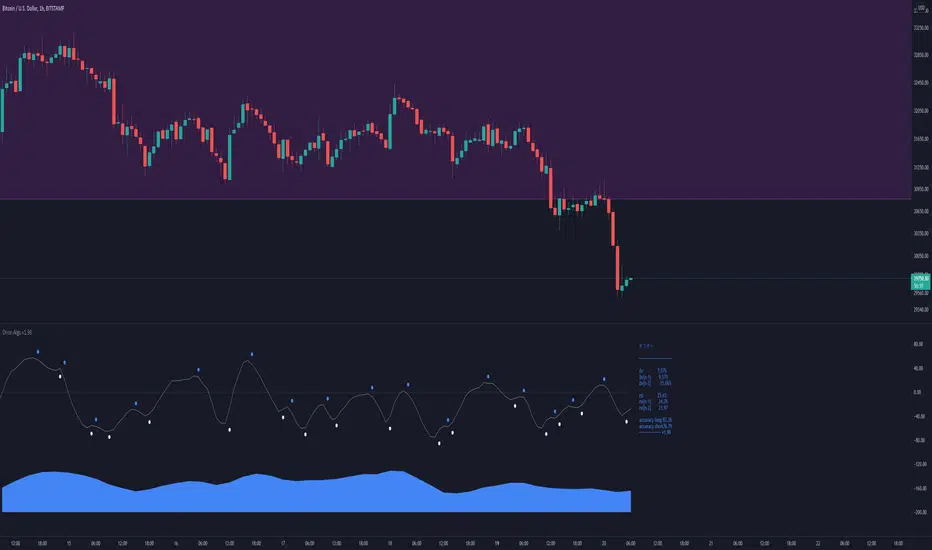
Orion AlgoOrion Algo is a next-gen trading algorithm designed to help traders find the highs and lows of the market before, during, and after they happen. We wanted to give an indicator to people that was simple to use. In fact we created the algorithm in such a way that it currently only needs a single input from the user. Since no indicator can predict the market perfectly, Orion should be used as just another tool (although quite a sharp one) for you to trade with. Fundamental knowledge of price action and TA should be used with Orion Algo.
Being an oscillator, Orion currently has a bias towards market volatility. So you will want to be trading markets over 30% volatility. We have plans to develop future versions that take this into account and adjust automatically for dead conditions. Also, while there are some similarities across all oscillators, what sets ours apart is the prediction curve. The prediction curve looks at the current signal values and gives it a relative score to approximate tops and bottoms 1-2 bars ahead of the signal curve. We also designed a velocity curve that attempts to predict the signal curve 2+ bars ahead. You can find the relative change in velocity in the Info panel. The bottom momentum wave is based on the signal curve and helps find overall market direction of higher time-frames while in a lower one.
Future Roadmap:
Create secondary on-bar indicator to pair with Orion Algo
Automatically adjust internal variables based on market volatility
Indicator style selection
Simple Strategy:
1. Start at a high time-frame to get an overview of the market you are wanting to enter. Daily is usually a good starting time.
2. If you can, add Orion to a second chart with a lower time-frame such as 4H.
3. Check the lower time frame to find potential medium term entry points based on where the trend was heading from the higher time-frame.
4. Step even lower to the 1H to find your optimal entry based on the higher times and technical analysis of the charts (support/resistance, patterns, etc)
5. The momentum wave can be used to find overall trend of the market. When it starts curving up, the market is bullish. When it curves down, the market could be bearish.
Intermediate Strategy:
1. Use simple strategy first.
2. Use the Prediction and ∆v curves to see future reversals in the works.
3. You can use these curves as potential entries as well as exit points.
4. Take into account potential divergence of the signal lines and price action.
Settings and How to Use them:
User Agreement – Orion Algo is a tool for you to use while trading. We aren’t responsible for losses OR the gains you make with it. By clicking the checkbox on the left you are agreeing to the terms.
Super Smooth – Smooths the main signal line based on the value inside the box. Lower values shift the pivot points to the left but also make things more noisy. Higher values move things to the right making it lag a bit more while creating a smoother signal. 8 is a good value to start with.
Theme – Changes the color scheme of Orion.
Info – Turns on a dashboard with useful stats, such as Delta v, Volatility, Rsi, etc. Changing the value box will move the dashboard left and right.
Pivots – Toggles main bull/bear dots.
Prediction – A secondary prediction model that attempts to predict a reversal before it happens (0-2bars). This can be noisy some times so make your best judgement. Curve will toggle a curve view of the prediction. Pivots will toggle bull/bear dots.
∆v – Delta v (change in velocity). This shows momentum of the signal. Crossing 0 signals a reversal. If you see the delta v changing direction, it may signify a reversal in the several bars depending on the overall momentum of the market.
Divergence – Toggles divergence lines. Hidden will show hidden divergences. Cross will show divergences that cross the 0 line.
Momentum Wave – Uses the signal as a macro trend indicator. Changes in direction of the wave can signify macro changes in the market. Average will toggle an averaging algorithm of the momentum waves and makes it easy to understand.
OBOS – Overbought/Oversold lines. Dyn will convert them to dynamic OBOS lines. The value box will adjust the smoothing.
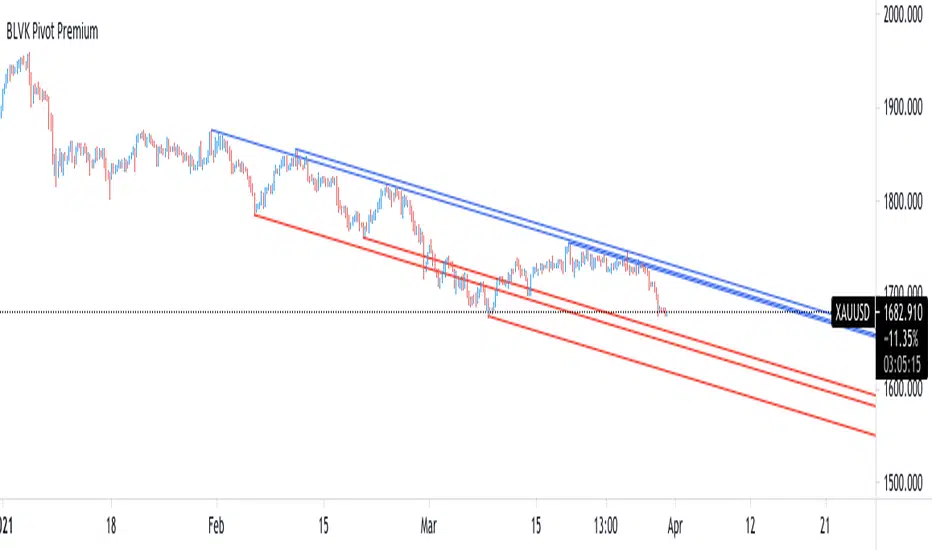
BLVK Pivot PremiumDisplays lines connecting past pivot high/low points with each line having the slope of a linear regression . This slope can also be controlled by the user with the 'Slope' setting. Each line can be used as a support or resistance by the user.
Settings
Length : Pivot length. Use higher values for having lines connected to more significant pivots points.
Lookback : Number of lines connecting a pivot high/low to display, with a total of lines equal to Lookback*2
Slope : Allows the user to multiply the linear regression slope by a number within -1 and 1
Limitations
The script has currently several real time behavior limitations. Lines are displayed retrospectively and will not update with the arrival of new bars. Readjusting the indicator to newer pivots will require the user to either hide/unhide the indicator or change its settings.
High Length or Lookback values might not return any lines if the location of a pivot point is outside the defined buffer size of the indicator (set as 5000 bars).
How To Use
The indicator can be used to get supports and resistances and is more so closer to a drawing tool due to its limitations. The lines not updating with the arrival of new bars have the advantage of providing fixed supports/resistances.
The Slope setting allows the user to control the angle and direction of the lines. Using a Slope of 1 will return lines with the same slope as the one of a linear regression fit from the farthest pivot point displayed by the indicator to the most recent bar.
Conclusion
We hope you like this indicator (drawing tool) and find it useful for drawing your support & resistances in a unique way!
Extreme Money [Crypto Trading FR]Extreme Money aims to smooth out market fluctuations and predict trend changes.
The algorithm shows the turning points in the market and uses multiple filters to present the best potential turning points. Although this is its core functionality, Extreme Money also incorporates a series of popular other indicators (see below) allowing full identification of trends on the chart.
The tool aims to calculate market strength and then show potential turning points in the market signalled with small circles. Once the trend confirmation has changed, the algorithm signals a circle, giving the trader the potentially desired entry with an audible or pop-up alert if needed. The more circles there are when setting up the entry, the greater the chances of a trend reversal.
This algorithm can be used on all time intervals, as well 5, 15 or 30 minutes but it is particularly recommended on the 1H, 2h and 4H intervals for maximum efficiency. The indicator works as well for swing-trading as for intra-day trading: whatever the time interval selected, it filters potential entries with great precision.
The algorithm can also be used with any cryptocurrency or currency pairs from traditional markets, the parameters of the algorithm can be customized and adapted without difficulty.
Extreme Money also includes 8 indicators assembled in a single script, which can be activated or deactivated manually:
1) Algo (main indicator)
2) EMA
3) Hull
4) Trend
5) Pivots
6) Trend line
7) VWAP Line
8) RSI Swing
Benefits :
- Notifies the trader of potential entries
- Color coded entries for buying and selling
- Creates cluster signals at potential turn points
- Aims to avoid market noise
- Used on all types of timefames
- Analyze the current market trend
- Assists in Predicting Market Turn Points
- Cryptocurrency, FX, stock indices and gold trades
- Maximize profits
- Analyzed market strength and weakness

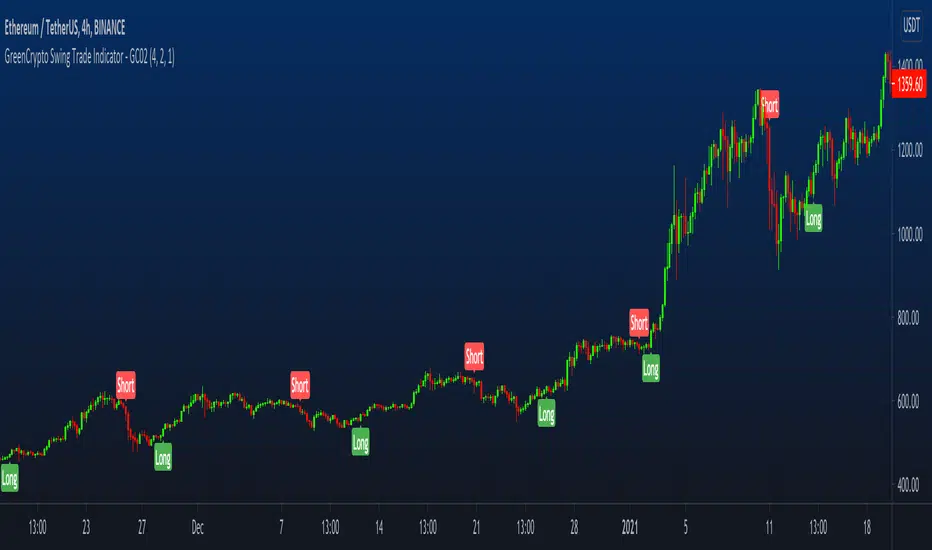
GreenCrypto Swing Trade Indicator - GC02Overview: This is a swing trading Indictor works using support & resistance and market trend, it is designed for all type of markets (crypto, forex, stock etc.) and works on all commonly used timeframes (preferably on 1H, 4H Candles).
How it works:
Core logic behind this indicator is to finding the Support and Resistance, we find the Lower High (LH) and Higher Low (HL) to find the from where the price reversed(bounced back) and also we use a custom logic for figuring out the peak price in the last few candles (based on the input "Strength" ). Based on the multiple previous Support and Resistance (HH, HL, LL LH) we calculate a price level, this price level is used a major a factor for entering the trade. Once we have the price level we check if the current price crosses that price level, if it crossed then we consider that as a long/short entry (based on whether it crosses resistance or support line that we calculated). Once we have pre long/short signals we further filter it based on the market trend to prevent too early/late signals, this trend is calculated based on the value from the input field "Factor". Along with this if we don't see a clear trend we do the filtering by checking how many support or resistance level the price has bounced off.
Stop Loss and Take Profit : We have also added printing SL and TP levels on the chart to make the it easier for everyone to find the SL/TP values. Script calculates the SL value by checking the previous support level for LONG trade and previous resistance level for SHORT trades. Take profit are calculated in 1:1 ratio as of now.
Available Inputs:
Strength : Define the strength of the support resistance that we calculate. The lower value means less number of candles used for calculating the support & resistance and vice versa
Factor : Specify what level of trend to use. Using higher value will result script looking using the larger trend (zoomed out trend) and using lesser value will result in using the short trends
Note: For most of the charts you don’t need to change the default values. However, feel free to try it out.
How to use:
Add the script to the chart and once the indicator is load it will display the "long" and "short" entry points along with the stopLoss and takeProfit points.
How to get access:
Send a DM to us for getting access to the script.