Alma
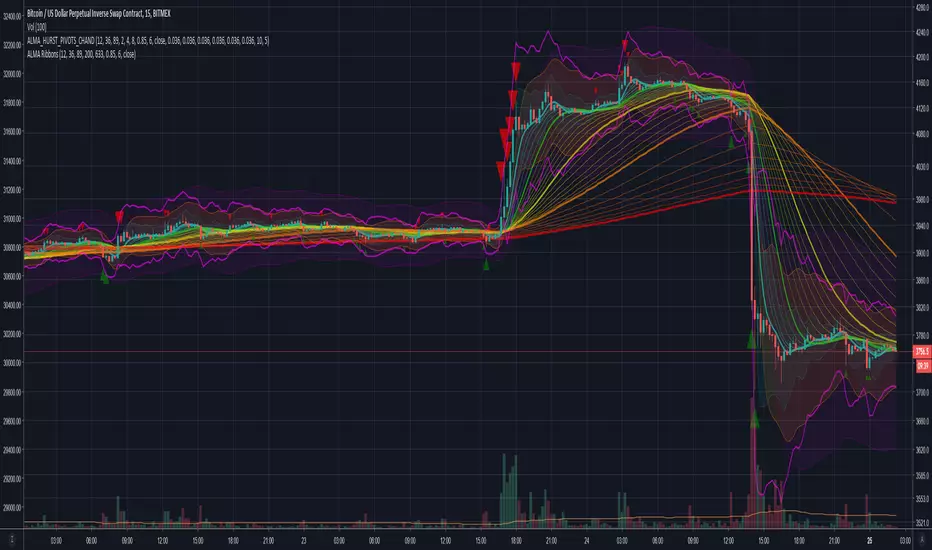
ALMA Hurst Cycles V2 - Potential Pivot Points Chandelier VersionAlternative version to this script
Uses the calculation for creating chandelier stops as a basis for the bands. Seems to be more consistent especially over higher TFs. Still needs to be tuned for a good price fit.

ALMA Hurst Cycles - Potential Pivot points.Experiment in finding potential pivots using using multiple period volatility measurements (ATR) and ALMA.
------------------------------------------------------------------------------------------------------------------------------------
Warning!!! Must be tuned to obtain a good price fit for your time frame and instrument (and probably general market conditions). Default settings are only eyeball fit for XBTUSD 5M
So proper write up for a change :p
So a single ATR measurement say ATR(5) doesn't give much information alone, it doesn't give us direction for example. However if we plot a MA (in this case the Arnaud Legoux MA) and plot bands which are a multiple of the ATR around the MA we get a potential trading range based on recent volatility.
The assumption being that if volatility remains approximately the same AND if price moves beyond this ATR range it is highly probable to result in a reversion to the mean. Having reached the limit of recent volatility, available buying/selling pressure is exhausted and price pivots from that point back to the mean.
Now, if we plot multiple MA's of different lengths, they alone don't tell us too much alone either. But we also find reversions to the mean occurring between say a long and short MA. The short MA will rise above/below the long MA, return to the mean etc creating crossovers.
So we combine the two concepts. Three different length MAs with corresponding ATR lengths. The smallest band cycles above/below the median of the medium band (diverging from and reverting to the mean) and the medium band cycles above/below the median of the large band.
We want to find extreme points where a pivot is probable. The small band "bounces" or cycles back and forth within the medium band and the medium band "bounces" or cycles back and forth within the large band. Approximate short, medium and long trading ranges relative to MAs.
So for example and theoretically when the small band cycles to the top of the medium band AND the medium band cycles to the top of the large band and the price has risen above all of them, there is a high probability of there being a reversal.
So here's the interesting bit. There is far more going on than is immediately apparent. If you take the bands and normalize them (ie you pulled the median, upper and lower bands so they're straight horizontal lines), the price's position relative to the bands would give you something very, very close to an RSI.
The bands effectively give you three different length RSI's. When price exceeds all three bands is roughly equivalent to seeing the confluence of overbought/sold on three different length RSI's.
However unlike RSI, we also get an approximate trading range and price levels that that RSI would have to reach to indicate it is overbought/sold that takes into account recent volatility.
------------------------------------------------------
Caveats :
Similar to RSI downsides. Multi leg pumps/dumps can remain overbought/sold and give false signals.
Extended, narrow and declining ranges/ squeezes don't require much change in price action to trigger false signals.
Performs the best when ranging.
------------------------------------------------------
Signals and Bar Colors :
Bar colors (optional in settings) :
Green - Short MA > Medium MA > Long MA
Red - Short MA < Medium MA < Long MA
Three "tiered" signals:
Large triangles. High probabilty pivot. Price exceeded all bands at the top/bottom.
Medium triangles. Price exceeded the small and medium bands, DIDN'T exceed the large band AND the small band HAS exceeded the medium band.
Small triangles. Price exceeded the small and medium bands, DIDN'T exceed the large band AND the small band DIDN'T exceed the medium band.

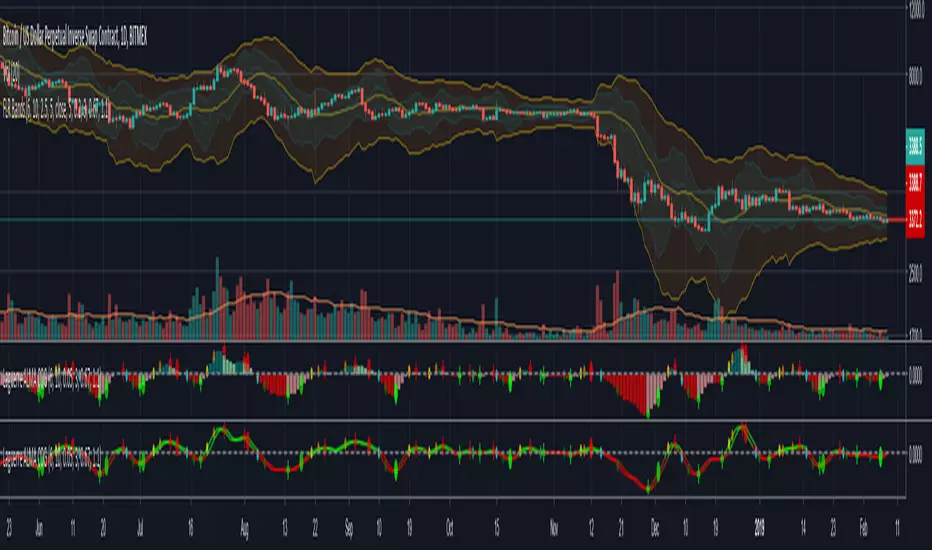
Filtered/Unfiltered Linear Regression BandsOptionally filtered linear regression bands/channel. Unfiltered : low lag.
Trend, support/resistance, overbought/sold and all that jazz....

Laguerre ALMA COGOptional Laguerre and ALMA applied to Ehler's Center of Gravity.
Optional histogram or oscillator display. Can also display the COG lines used to generate the signals.
Crossovers act as signals/histogram peaks, with pre and post dots early warnings & confirmation.
COG is very low lag, applying the filters cleans up the signals at the expense of introducing lag.
Seems to work better in trends and higher time frames. Not so much in chop/sideways action.
Will work best with another indicator to determine trend.
Quad Moving Avarage-Ichimoku Cloud-ALMA-Bollinger BandsAll-in-One
Ingradients:
* Ichimoku Cloud,
* 2 Simple Moving Avarage (SMA),
* 2 Exponential Moving Avarage (EMA),
* 2 Arnoud Legoux Moving Avarage (ALMA),
* Bollinger Bands and
* Volume Based Colored Bars (developed by KIVANÇ fr3762).
Compiled for limitations. Thank you.

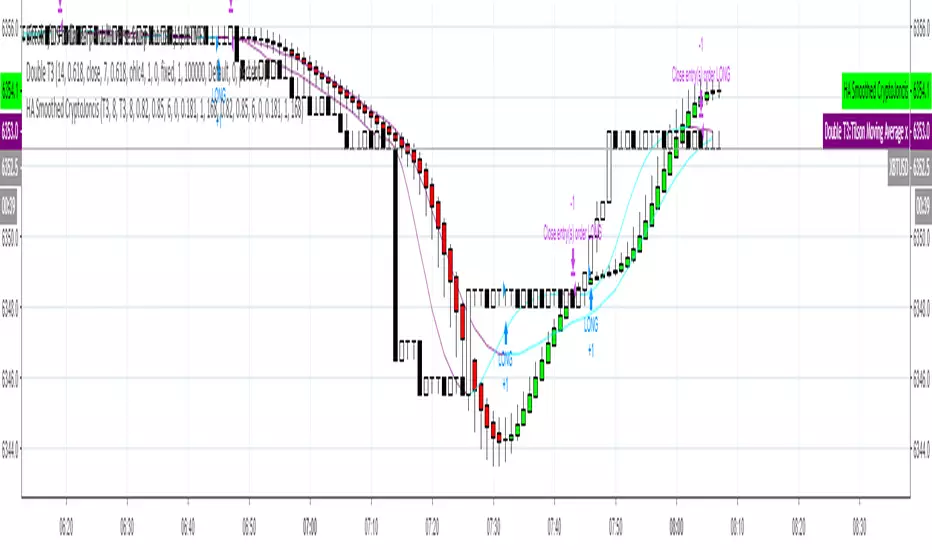
Heikin-Ashi Smoothed with option to change MA types CryptoJoncisPine Script version=3
Author CryptoJoncis
Heikin-Ashi Smoothed
The Heikin-Ashi Smoothed study is based upon the standard Heikin-Ashi study with additional moving average calculations. The following is the calculation formula for the bars:
1. The current bar Open, High, Low, Close values are smoothed individually by using the moving average type specified by the Moving Average Type 1 Input with a length/period specified by the Moving Average Period 1 Input.
2. The Heikin-Ashi bar Open, High, Low, Close values are set using the smoothed values from step 1. This is performed using the standard Heikin-Ashi formula.
3. The final Heikin-Ashi Open, High, Low, Close values are calculated by doing a second smoothing of the bar values from step 2 by using the moving average type specified by the Moving Average Type 2 Input with a length/period specified by the Moving Average Period 2 Input.
If you choose to tick the box where it offers to use only one smoothed HA then it skips the third/final step and you do not need to choose the second MA type for it to work.
Remember, using FRAMA, always make sure you use even number for length.
For simple Heikin-Ashi, please tick single smoothed and DEFAULT (Not smoothed as there are no MA used)
Heikin-Ashi bars are calculated:
1. Close = (Open + High + Low + Close) / 4
This is the average price of the current bar.
2. Open = (Open of Previous Bar + Close of Previous Bar) / 2
This is the midpoint of the previous bar.
3. High = Max of (High, Open, Close)
Highest value of the three.
4. Low = Min of (Low, Open, Close)
Lowest value of the three.
Any questions/suggestions/errors or spelling mistakes? Please leave a comment and let me know. I will try to fix it.
This took me few days to finish, so I hope you will find it useful.
Would you like to have more MA type choices? Please comment down with any other which aren't included in this indicator and I will research them and add.
MA included in this script:
Tillson Moving Average (T3)
Double Exponential Moving Average (DEMA)
Arnaud Legoux Moving Average (ALMA)
Least Squares Moving Average (LSMA)
Simple Moving Average (SMA)
Exponential Moving Average (EMA)
Weighted Moving Average (WMA)
Smoothed Moving Average (SMMA)
Triple Exponential Moving Average (TEMA)
Hull Moving Average (HMA)
Adaptive moving average (AMA)
Fractal Adaptive Moving Average (FAMA)
Variable Index Dynamic Average (VIDYA)
Triangular Moving Average (TRIMA)
You can use,publish,modify this code in any way as you wish, but only if you reference me after.
You are not allowed to sell it as it is.
If this code is useful to you, then consider to buy me a coffee (or better a pint of beer) by donating Bitcoin or Etherium to:
BTC: 3FiBnveHo3YW6DSiPEmoCFCyCnsrWS3JBR
ETH: 0xac290B4A721f5ef75b0971F1102e01E1942A4578
References:
www.sierrachart.com
www.investopedia.com
www.binarytribune.com
www.investopedia.com
www.stockfetcher.com
www.mql5.com
www.incrediblecharts.com
help.cqg.com
www.blastchart.com
All Moving averagesI have added an option to turn on or off any Moving average by choice and if needed, Heikin-ashi used as source (instead of close)
List of Moving Averages which you can use
T3 - Tillson Moving Average
DEMA - Double Exponential Moving Average
ALMA - Arnaud Legoux moving average
LSMA - Least Squares Moving Average
MA - Simple Moving Average
EMA - Exponential Moving Average
WMA - Weighted Moving Average
SMMA -The Smoothed Moving Average
TEMA - triple exponential moving average
HMA - The Hull Moving Average
AMA - Adaptive Moving Average
FAMA - Fractal Adaptive Moving Average
VIDYA - Variable Index Dynamic Average
TRIMA - Triangular Moving Average
Consider a tip in ETH to
0xac290B4A721f5ef75b0971F1102e01E1942A4578
Thank you and have a nice day
CryptoJoncis
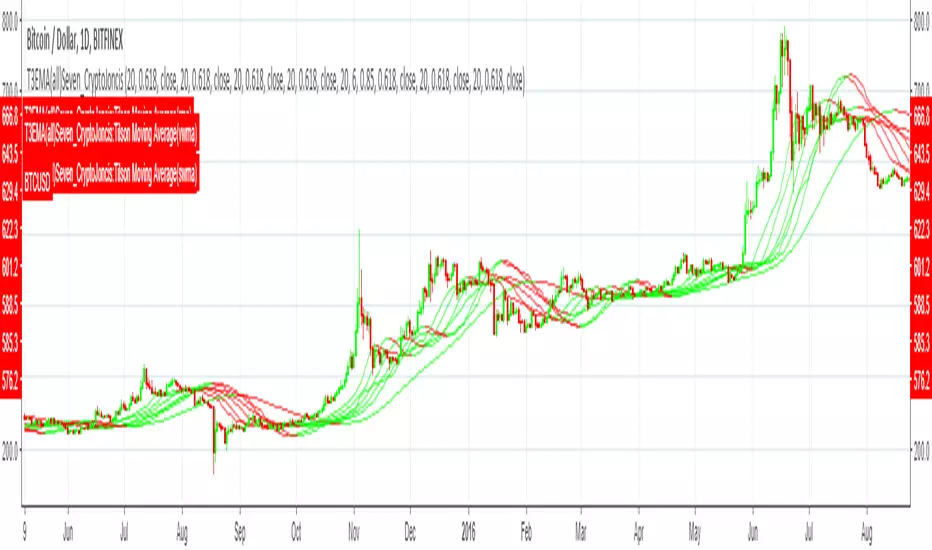
Tillson Moving Average(all_basic) SevenT3 Moving Average indicator was originally developed by Tim Tillson in 1998/99.
T3 Moving Average is considered as improved and better to traditional moving averages as it is smoother and performs better in trending market conditions.
It offers multiple opportunities when the price is in the state of retracement and therefore allows to minimize your exposed risk and allowing your profits run.
This version provides T3 MA
Source options - all standard + HA
T3 based on 6x ema, sma, rma, wma, alma, swma, vwma
Adds up to 7 different T3 on chart
Consider a tip in ETH to
0xac290B4A721f5ef75b0971F1102e01E1942A4578
Thank you and have a nice day
CryptoJoncis
Tillson Moving Average(alma) singleT3 Moving Average indicator was originally developed by Tim Tillson in 1998/99.
T3 Moving Average is considered as improved and better to traditional moving averages as it is smoother and performs better in trending market conditions.
It offers multiple opportunities when the price is in the state of retracement and therefore allows to minimize your exposed risk and allowing your profits run.
This version provides simple T3 MA
Source options - all standard + HA
T3 based on 6x alma
Only adds 1 T3 MA on chart
Consider a tip in ETH to
0xac290B4A721f5ef75b0971F1102e01E1942A4578
Thank you and have a nice day
CryptoJoncis

Moving Average SelectorEvery type of Moving Average (MA) that is built into TradingView, rolled into one color-coded Moving Average Selector (MAS). Mix-n-match and compare all seven: 1) Simple Moving Average (SMA), 2) Exponential Moving Average (EMA), 3) Running Moving Average (RMA), 4) Symmetrically Weighted Moving Average (SWMΑ), 5) Volume-Weighted Moving Average (VWMA), 6) Weighted Moving Average (WMA), and/or 7) Arnaud Legoux Moving Average (ALMA).
View any or all 7 averages together for comparison, or average one or more together into your own custom Averaged Moving Average! Better still, each Moving Average comes complete with independent Crossover and/or Crossunder Alerts, and an option in Settings to Require Candle Confirmation prior to alert-firing.
All seven moving averages averaged together into a new moving average (build your own):
Easily control the line-width of all your averages at once, and enjoy clearly labeled style tab in MAS Settings:
If you'd like to see more Moving Averages added to MAS, write your requests in the comments below.
PLEASE NOTE:
When using Alerts on TradingView, the alerts you create will retain the settings that were set at the time you created the alert, and will not update as you change the indicator settings later, after you created the alert. This is true of all custom tradingView alerts. For example, if "Require Candle Confirmation for Crossover Alerts" is unchecked in MAS Settings, and then you create an alert for "ALMA Crossunder", and then later decide to go to MAS Settings and check "Require Candle Confirmation for Crossover Alerts", the alerts you created beforehand will not respect your settings changes, but will continue to operate without requiring candle confirmations. Currently, TradingView policy is that the alert should be created anew, and the original alert should either be "Stopped" or "Deleted".
Moving Averages (gotta plot them all!)The length of the lookback period and the type of moving average can be changed in the inputs tab of the indicator.
The type of moving average can be selected from:
Simple Moving Averages
Exponential Moving Averages
Symmetrically Weighted Moving Average
Weighted Moving Averages
Volume-weighted Moving Averages
Moving average used in RSI
Arnaud Legoux Moving Averages
The source of prices to use in the calculation can be selected from:
close
open
high
low
(high + low + close + open)/4
(high + low)/2
(high + low + close)/3
Line-weight and colours can be edited in the style tab of the indicator.
The default is to plot the SMAs using a length of 20, 50, 100 and 200.
A simpler version of this script is available here:

Moving Averages (SMA and EMA)Plot the simple moving averages (SMA) and/or exponential moving averages (EMA).
The length of the lookback period and the type of moving average can be changed in the inputs tab of the indicator.
Line-weight and colours can be edited in the style tab of the indicator.
The default is to plot the SMAs using a length of 20, 50, 100 and 200.

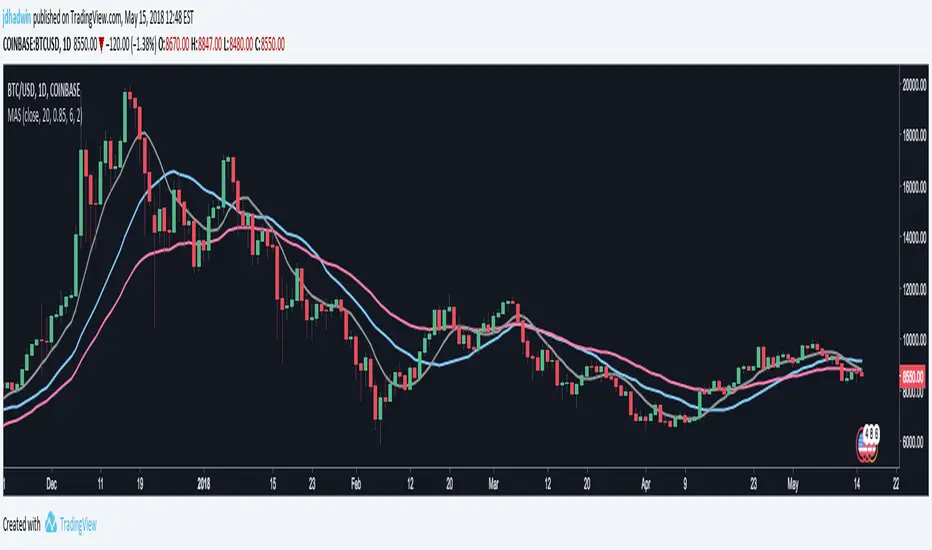
Customizable MACDCustomizable MACD - let's tune! This approach let you specify not only lengths and price source but also a type of used movings for the fast, slow and signal lines.
Here is the list of all available movings:
ALMA (Arnaud Legoux)
ARSI (Adaptive RSI)
DEMA (Double Exponential)
EMA (Exponential)
FRAMA ( Fractal Adaptive)
HMA (Hull)
LSQMA (Least Squares)
LWMA (Linear Weighted)
MD (McGinley Dynamic)
REMA (Regularized Exponential)
RMA (EMA with alpha = length - 1)
SMA (Simple)
SMMA (Smoothed)
TEMA (Triple Exponential)
TMA (Triangular)
T3
VIDYA (Variable Index Dynamic)
VWMA ( Volume Weighted)
WMA (Weighted)
WWMA (Welles Wilder’s Moving Average, EMA with alpha = 1 / length)
ZLEMA (Zero Lag Exponential)

Customizable Multiple Moving AveragesCustomizable Multiple Moving Averages - more than twenty movings available in one script!
Besides source/period customization you can specify one of the following moving averages for every plot:
ALMA (Arnaud Legoux)
ARSI (Adaptive RSI)
DEMA (Double Exponential)
EMA (Exponential)
FRAMA (Fractal Adaptive)
HMA (Hull)
LSQMA (Least Squares)
LWMA (Linear Weighted)
MD (McGinley Dynamic)
REMA (Regularized Exponential)
RMA (EMA with alpha = length - 1)
SMA (Simple)
SMMA (Smoothed)
TEMA (Triple Exponential)
TMA (Triangular)
T3
VIDYA (Variable Index Dynamic)
VWMA (Volume Weighted)
WMA (Weighted)
WWMA (Welles Wilder’s Moving Average, EMA with alpha = 1 / length)
ZLEMA (Zero Lag Exponential)

Kozlod - Yet Another Moving Average Cross Alerts (9 MA types)You can choose one of these MA types in params:
Simple Moving Average ( SMA )
Exponential Moving Average ( EMA )
Weighted Moving Average ( WMA )
Arnaud Legoux Moving Average ( ALMA )
Hull Moving Average ( HMA )
Volume-weighted Moving Average ( VWMA )
Least Square Moving Average ( LSMA )
Smoothed Moving Average ( SMMA )
Double Exponential Moving Average ( DEMA )
Also you can select SL/PT % levels.
There are 4 alerts available: LONG/SHORT/EXIT LONG/EXIT SHORT
Same script as strategy:

Multi-Bollinger [DW]This is an experimental study designed to visualize trend activity and volatility using a set of two Bollinger Bands calculated with a basis moving average type of your choice.
The available moving averages in this script are:
-Exponential Moving Average
-Simple Moving Average
-Weighted Moving Average
-Volume Weighted Moving Average
-Hull Moving Average
-Least Squares Moving Average
-Arnaud Legoux Moving Average
-Coefficient of Variation Weighted Moving Average
-Fractal Adaptive Moving Average
-Kaufman's Adaptive Moving Average
In addition, a middle filter is calculated by taking the median of the two basis lines.
Multi-Timeframe functionality is included. You can choose any timeframe that Tradingview supports as the basis resolution for the bands.
Custom bar color scheme is included with four options to choose from.

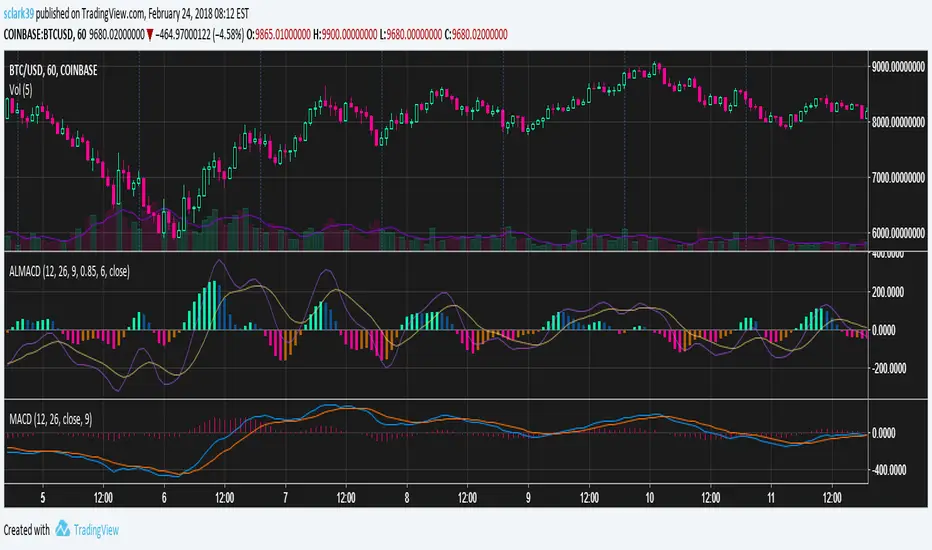
Arnaud Legoux MACD (ALMA, 4 Color, Color-blind Friendly)MACD built out of two Arnaud Legoux Moving Average lines of different periods. The signal line is still an EMA of the MACD line, just like with the normal MACD.
Colors are picked to be friendly with partial colorblindness, and can be modified in the indicator settings.
Squeeze Box [DW]This is an experimental study designed using data from Bollinger Bands to determine price squeeze ranges and active levels of support and resistance.
First, a set of Bollinger Bands using a Coefficient of Variation weighted moving average as the basis is calculated.
Then, the relative percentage of current bandwidth to maximum bandwidth over the specified sampling period determines the relative squeeze.
The box is outlined by drawing the current highest and lowest source value over the sampling period whenever a squeeze is active.
I've included the COVWMA in the visualization for additional confirmation of price activity.
Custom Bar color scheme is included.

Stratus [DW]This is an experimental study designed to identify trend activity, and potential support and resistance areas.
First, Coefficient of Variation Weighted Moving Average (COVWMA) is calculated, and its intersection points are used as anchor values.
Next, a fast period COVWMA calculated for a signal line.
For the cloud, its mid level is calculated first by taking the median of the range between price and the last anchor value.
The upper and lower cloud values are calculated by slicing the range in half two more times on each side. The result looks similar to stratus clouds, hence the name.
Finally, the result is offset by half of the specified period.
Custom bar colors are included.

Ultra RSI [DW]This is an RSI Variation with six different averaging methods to choose from.
The averaging methods I've included in this script are:
- Exponential Moving Average
- Simple Moving Average
- Smoothed Moving Average
- Weighted Moving Average
- Volume Weighted Moving Average
- Arnaud Legoux Moving Average
Each method produces a different, yet significant gauge of relative strength.
Custom bar colors are included.

Ultra MACD [DW]This is a variation of Gerald Appel's MACD with seven moving average source types to choose from.
The MA types I've included in this script are:
- Kaufman's Adaptive Moving Average
- Geometric Moving Average
- Hull Moving Average
- Volume Weighted Moving Average
- Least Squares Moving Average
- Arnaud Legoux Moving Average
- Exponential Moving Average
Custom bar color scheme is included with two different colorization methods - one based on the MACD, and the other based on the histogram.

Moving Average Range Channels [DW]This study is an experiment based off the concept used in my Dynamic Range Channel indicator.
Rather than using a McGinley Dynamic, a moving average of your choice is used in this calculation.
There are eight different moving average types to choose from in this script:
- Kaufman's Adaptive Moving Average
- Geometric Moving Average
- Hull Moving Average
- Volume Weighted Moving Average
- Least Squares Moving Average
- Arnaud Legoux Moving Average
- Exponential Moving Average
- Simple Moving Average
For a more refined picture of volatility, I've added upper and lower extension channels. They are calculated by adding the upper half range to the channel high, and subtracting the lower half range from the channel low.
The new custom bar color scheme indicates trends, midline crosses, MA crosses, and overbought and oversold conditions.
