Dragon Flow Arrows (Smoothed LITE)🚀 DRAGON FLOW ARROWS — LITE | Smart Trend Engine + Clean Reversal Arrows
A lightweight but highly-optimized trend system designed for clean charts, powerful visual signals, and no-noise directional flow.
Built for traders who want simplicity, clarity, and professional-level momentum-filtered signals without over-complication.
🔥 Dragon Channel (Clean 3-Line Ribbon)
A smooth adaptive channel formed from ATR + EMA, giving you structural trend zones without clutter. No double bands, no messy overlaps just a clear upper/lower boundary.
✅ Dragon Flow Gradient
A horizontal, color-shifted flow:
🟢 Bull flow → green glow
🔴 Bear flow → red glow
Automatic blend based on trend direction
Smooth visual transitions (no vertical stripes)
✅ Momentum-Filtered Arrows (No Spam)
BUY/SELL arrows only print when:
Price breaks outside the Dragon Channel
Momentum confirms (RSI + MACD filters)
Trend flips → one clean arrow per direction
Text labels sit outside the channel for better readability.
✅ Smart Header Panel
At the top of your chart:
📌 Trend: Uptrend / Downtrend / Neutral
⚡ Impulse Strength: Weak / Normal / Strong
© FxShareRobots.com brand bar
Everything compact. Everything professional.
📊 How to Use
BUY Setup
Price moving above baseline
Dragon Flow turns bullish (cyan side)
Arrow appears below channel
SELL Setup
Price breaks below baseline
Dragon Flow turns bearish (magenta side)
Arrow pops above channel
Exit / Filter
Opposite arrow
Flow color shift
Trend panel flips
Works on Forex, Crypto, Stocks, Indices — all timeframes.
🆚 LITE vs PRO
Feature LITE PRO
Dragon Channel ✔ ✔ +Enhanced
Trend Panel ✔ ✔ +Multi-TF
Reversal Arrows ✔ ✔ + Confirmation
Momentum Filter ✔ ✔ +Expanded
Alerts ✖ ✔ +Full Suite
Reversal Zones ✖ ✔ +Predictive Map
Trade Strategy ✖ ✔ +Included + PDF
🔓 Upgrade to DRAGON FLOW — PRO
Unlock alerts, HTF confirmation, advanced momentum engine, and predictive reversal zones:
👉 fxsharerobots.com/itp/
❤️ If this helped your trading — please Like & Follow!
This supports future updates and keeps the LITE version source code free for the community.
Happy trading,
FxShareRobots Team
ATR

AI AAdaptive Supertrend ChannelAI Supertrend Channel – The Adaptive Trend System
Beyond Basic Supertrend: An Intelligent Trading Framework
The AI Adaptive Supertrend Channel transcends traditional trend following indicators by delivering a self-optimizing trading system. Its core innovation is a triple-adaptive engine that automatically adjusts channel width based on real-time market conditions:
Market Efficiency Detection – Widens during clean trends, tightens in choppy ranges
Normalized Volatility – Scales appropriately to any asset's price level
Dynamic Momentum Response – Expands aggressively during powerful directional moves
The Result: A smarter tool that reduces false signals in consolidation while giving trends ample room to run—eliminating the constant parameter tweaking required by static indicators.
Visual Signal Framework & Strategic Applications
Channel Architecture:
Primary Trend Line (Thick Green/Red): Your dynamic trailing stop and core trend indicator. Green signals an uptrend (buying bias), Red signals a downtrend (selling bias).
Upper & Lower Bands: Form a dynamic support/resistance channel around the trend.
Mid-Line: A critical mean reversion level and the trigger for key early signals.
Trading Signals & Strategic Meaning:
Primary Signal: Momentum Diamonds (High Conviction)
💎 Green Diamond (Higher High): Price closes above the Upper Band after making a new high. Signals strong bullish momentum continuation. Ideal for adding to long positions or entering new longs in an established uptrend.
💎 Red Diamond (Lower Low): Price closes below the Lower Band after making a new low. Signals strong bearish momentum continuation. Ideal for adding to short positions or entering new shorts in a downtrend.
Secondary Signal: Mid-Line Crosses (Early Action)
🔼 Green Triangle (Bullish Mid-Line Cross - bullMidCross): Price crosses above the Mid-Line. This is an early bullish pullback signal within a larger uptrend or a potential early reversal sign in a downtrend. Use for early entries or to confirm the end of a bearish pullback.
🔽 Red Triangle (Bearish Mid-Line Cross - bearMidCross): Price crosses below the Mid-Line. This is an early bearish pullback signal within a larger downtrend or a potential early warning of weakness in an uptrend. Use for early short entries or to take profits on longs.
Practical Trading Strategies
Trend Following: Align trades with the Primary Trend Line color. Use the line itself as a dynamic stop-loss. The Momentum Diamonds confirm the trend's strength.
Pullback Trading: Use the Mid-Line Cross triangles (bullMidCross/bearMidCross) to identify high-probability entries during trend retracements. The channel bands provide natural profit targets.
Breakout Confirmation: A Momentum Diamond following a period of consolidation often confirms a genuine breakout, offering a signal to enter with the new momentum.
Optimal Settings Guide
Default (Universal)
For most markets, timeframes
ATR: 13 | ER: 144 | Channel Width: 0.7
Volatility Factor: 100 | Vol MA: HMA | Trend MA: EMA
Day Trading (Fast, Responsive)
*15M-1H charts, scalping*
ATR: 8 | ER: 89 | Channel Width: 0.6
Volatility Factor: 120 | Vol MA: EMA | Trend MA: WMA
*Swing Trading (Smooth, Conservative)*
*Daily-Weekly, position trading*
ATR: 21 | ER: 200 | Channel Width: 0.9
Volatility Factor: 80 | Vol MA: HMA | Trend MA: LINREG
Channel Width × Factor
0.5-0.7 → Tighter (more signals, less room)
0.8-1.2 → Wider (fewer signals, more room to run)
Volatility Regime Factor
50-80 → Less sensitive to volatility (stable markets)
100-150 → More sensitive (volatile markets like crypto)
Base ATR Length
8-13 → Faster signals (lower timeframes)
17-21 → Smoother signals (higher timeframes)
Quick Adjustments:
Whipsaws → Increase Channel Width × Factor
Lagging → Decrease ATR Length
Volatile markets → Increase Volatility Regime Factor
Start with Default, adjust one parameter at a time based on your market and trading style.

Volume Crisis Created by Alphaomega18
🎯 What is the Crisis Detector Pro?
The Crisis Detector Pro is an advanced multi-component indicator that detects market crisis situations by simultaneously analyzing:
Volume: Anomalies and volume spikes
VIX: Volatility Index (S&P 500)
ATR: True volatility (all assets)
Open Interest: Estimated open interest (futures contracts)
The indicator calculates a Composite Crisis Score (0-100) that combines these elements to alert you to critical market moments.
📊 Indicator Components
1️⃣ Volume Analysis
Anomaly detection: Compares current volume to its moving average
Classification:
🟡 Moderate: 1.5x - 2x average
🟠 High: 2x - 3x average
🔴 Extreme: > 3x average
Bollinger Bands: Detects volume breakouts
Clusters: Identifies 3+ consecutive days of anomalies
2️⃣ VIX (Fear Index)
S&P 500 only
Default thresholds:
🟡 Moderate: VIX > 20
🟠 High: VIX > 30
🔴 Extreme: VIX > 40
3️⃣ ATR (Average True Range)
Measures true volatility
Compatible with all assets (stocks, futures, forex, crypto)
Compares current ATR to its average
4️⃣ Open Interest (OI)
Estimation based on Volume / 2
Detects changes > 25%
Inverted colors:
🔴 Red: OI increase (new positions)
🟢 Green: OI decrease (position closing)
⚙️ Main Parameters
Calculations:
Moving Average Period: 20 (default)
Standard Deviation Period: 20
ATR Period: 14
Volume Thresholds:
Moderate: 1.5x
High: 2.0x
Extreme: 3.0x
Composite Score (Weights):
Volume: 35%
VIX: 25%
ATR: 20%
Open Interest: 20%
📈 Visual Signals
Top of Chart:
🟡 Yellow triangle: Moderate alert (Score 50-70)
🟠 Orange triangle: High alert (Score 70-85)
🔴 Red triangle: EXTREME CRISIS (Score 85-100)
⚠️ Purple cross: Reinforced signal (Volume + Volatility simultaneous)
Bottom of Chart:
💎 Purple diamond: 50-day volume record
⬛ Fuchsia square: Cluster (3+ abnormal days)
Volume Bars:
Gray: Normal volume
🟡 Yellow: Moderate volume
🟠 Orange: High volume
🔴 Red: Extreme volume
Open Interest Curve:
🔵 Blue: Normal variation
🔴 Red: Increase > 25%
🟢 Green: Decrease > 25%
🎯 How to Use the Indicator
1. Initial Setup
For S&P 500 / US Indices:
Enable VIX ✅
Enable ATR ✅
Enable OI ✅
Composite Score ✅
For Other Assets (Forex, Crypto, Stocks):
Disable VIX ❌
Enable ATR ✅
Enable OI (optional)
Composite Score ✅
2. Crisis Score Interpretation
ScoreLevelMeaningAction0-50Normal ✅Calm marketNormal trading50-70Vigilance 🟡Volatility risingIncreased monitoring70-85Danger 🟠Critical situationReduce exposure85-100Crisis 🔴MAXIMUM ALERTCapital protection
3. Trading Strategies
Directional Trading:
Reinforced signal ⚠️ = Powerful move in progress
Enter in direction of movement with confirmation
Tight stops, quick targets
Risk Management:
Score > 70 → Reduce position size by 50%
Score > 85 → Stop trading or ultra-short positions
Cluster detected → Avoid new trades
Scalping/Day Trading:
Extreme volume 🔴 = Scalping opportunities
Wait for confirmation before entering
Exit quickly on spikes
Swing Trading:
Avoid opening swings during crises
Protect existing positions (trailing stops)
Wait for return to normal (Score < 50)
4. Open Interest (Futures):
OI Increase (🔴 Red):
New positions opened
Strong market conviction
Movement may intensify
OI Decrease (🟢 Green):
Position closing
Profit-taking or stop losses
Possible reversal
🔔 Configurable Alerts
The indicator includes 8 types of alerts:
🟡 Moderate Crisis Alert: Score 50-70
🟠 HIGH Crisis ALERT: Score 70-85
🔴 MAJOR CRISIS: Score 85-100
⚠️ REINFORCED SIGNAL: Extreme Volume + Volatility simultaneous
💎 RECORD Volume: Highest volume over 50 days
📊 Cluster DETECTED: 3+ consecutive abnormal days
📈 OI SPIKE >25%: Sharp Open Interest increase
📉 OI DECLINE >25%: Sharp Open Interest decrease
Setup: Right-click on chart → "Add Alert" → Select alert
💡 Optimization Tips
Scalping (1-5min):
MA Period: 10-15
Moderate Threshold: 1.3x
High Threshold: 1.8x
Volume Weight: 50%
Day Trading (15min-1H):
MA Period: 20 (default)
Thresholds: Default
Composite Score: Enabled
Swing Trading (4H-Daily):
MA Period: 30-50
StdDev Multiplier: 2.5
ATR Period: 20
Volatile Markets (Crypto):
Moderate Threshold: 1.8x
High Threshold: 2.5x
Extreme Threshold: 4.0x
ATR Weight: 30%
📊 Statistics Table
The real-time table displays:
Crisis Score: 0-100 with color coding
Current volume: Value and ratio
Volume Score: Contribution to total score
Open Interest: Estimated value and % change
VIX: Current value (if enabled)
ATR: Ratio to average
Global STATUS: Normal ✅ / Vigilance 🟡 / Danger 🟠 / Crisis 🔴
⚠️ Warnings and Limitations
❌ Limitations:
Open Interest is estimated (Volume / 2), not real value
VIX only works for S&P 500
False signals possible in very volatile markets
✅ Best Practices:
Always combine with classic technical analysis
Never trade solely on alerts
Adapt thresholds to your asset and timeframe
Backtest before using live
Respect your risk management plan
🎓 Real Use Cases
Example 1: Flash Crash
Extreme volume 🔴 + Extreme ATR 🔴 + Reinforced signal ⚠️
Composite score > 90
Action: No new trades, protect existing positions
Example 2: Fed Announcement
VIX > 35 + Moderate volume 🟡 + OI rising 🔴
Composite score: 65
Action: Reduce position size, widen stops
Example 3: Volatility Squeeze
Cluster detected + Volume record 💎 + OI declining 🟢
Action: Scalping opportunity in breakout direction
📈 Performance
Real-time detection (0 lag)
Compatible all markets and timeframes
Low resource consumption
Complete history preserved

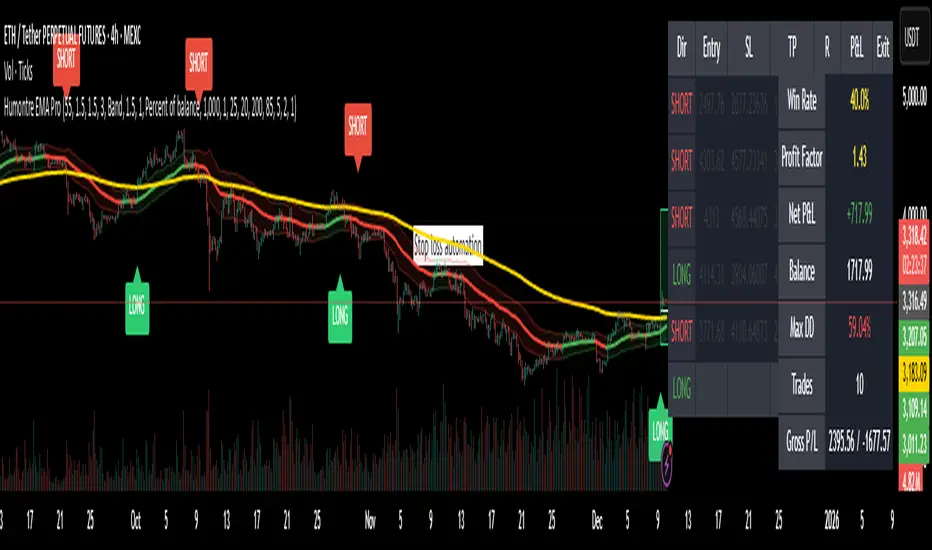
Adaptive Breakout & Risk Engine — Humontre EMA ProHumontre EMA Pro is a professional-grade trading system built for traders who want structure, clarity and real risk management integrated into every trade.
✔ No repainting
Instead of chasing signals or relying on unrealistic “high winrate” promises, this tool provides a consistent, repeatable process based on:
✔ Adaptive EMA breakout logic
✔ ATR-driven volatility channels
✔ Automatic SL/TP placement
✔ True R-multiple tracking
✔ Live trade visualization
✔ Smart signal filtering
✔ Performance statistics directly on the chart
This is more than an indicator — it’s a fully structured framework for traders who want discipline, confidence and objective risk management.
What’s included
✔ Private access to Humontre EMA Pro on TradingView
✔ Full feature set: breakout signals, EMA channel, risk engine
✔ Trailing stop system
✔ Live trade box & trade history table
✔ Win rate, profit factor, drawdown & R-metrics panel
✔ Alerts with Entry, SL, TP & risk-to-reward
✔ Continuous improvements & updates
Whether you're learning structure or refining your current system, this tool offers a clean and objective approach to trending markets: crypto, forex, metals and indices.
👤 About Humontre
I'm a trader and IT engineer who enjoys building tools that bring structure and clarity to the markets.
Humontre EMA Pro was designed to help traders visualize risk and understand trend dynamics with precision.
⚠️ Important
This is educational software. It does not guarantee profit.
Trading always carries risk.
Key Features
✔ Adapts to market volatility for precise SL/TP placement
✔ Trailing stop system
✔ Calculates Entry, Stop Loss, Take Profit and R-Multiples
✔ Filters duplicate entries and only signals the first valid setup per trend
✔ Visualizes active/past trades with P&L, R-values and exit reasons
✔ Detects high-quality trend breakouts using a dynamic EMA channel
BT SpikeBT Spike is a lightweight but highly effective alert engine designed to identify
moments of unusual volatility and volume expansion . These spikes often appear
at the very beginning of major moves, giving traders early insight into:
Momentum ignition
Breakout confirmation
Liquidity shifts
Stop runs & displacement moves
Trend acceleration
High-impact expansions before news or volatility events
Rather than watching charts all day, BT Spike allows traders to receive
instant alerts whenever the market enters an abnormal volatility regime.
---
■ What BT Spike Measures
1. ATR Spike
Detects sudden expansion in true range (micro-volatility).
This often marks the beginning of a displacement candle.
2. Volume Spike
Identifies candles where volume exceeds typical market participation.
3. Combined Spike
A powerful signal triggered only when both conditions occur together:
ATR Spike AND Volume Spike
4. Spike Score (0–100)
A normalized measure of spike intensity.
• Higher score → Stronger anomaly
• 90+ → Extreme event (liquidity shifts, stop runs, institutional activity)
---
■ Visual Elements
• True Range Line
Shows per-candle volatility relative to baseline ATR.
• Volume Bars (Color-Scaled)
Volume bars turn:
Green for bullish spikes
Red for bearish spikes
Intensity based on Spike Score
Gray during normal activity
This creates a clear volatility heatmap directly in the volume panel.
• Spike Score Histogram
Helps visually identify:
Minor spikes
Major volatility clusters
Extreme anomalies
• Threshold Lines
Yellow = Minor
Orange = Major
Red = Extreme
---
■ Why BT Spike Is Useful
Spike-based analysis helps traders:
Catch large moves early
Confirm breakouts and avoid fake ones
Identify when smart money enters the market
Find the start of momentum legs
Monitor many charts with alerts instead of manual watching
A spike is often the first footprint of a meaningful move.
---
■ Practical Trading Uses
1. Breakout Confirmation
A breakout with no spike is often weak.
A breakout with a spike is typically genuine and sustained.
2. Reversal Detection
Extreme spike after a sweep often signals a reversal event.
3. Trend Ignition
Spikes frequently occur at the beginning of:
Trend legs
News-driven surges
Momentum continuation moves
4. Divergence With Price
High-volume, high-ATR spikes with little price movement can indicate:
Absorption
Trap conditions
Exhaustion
5. Alert-Driven Market Monitoring
Set alerts for:
ATR Spike
Volume Spike
Combined Spike
Major Spike (Score ≥ threshold)
Extreme Spike (Score ≥ threshold)
This allows traders to walk away while still catching every volatility event.
---
■ Spike Score Guide
0–30 → Mild noise
30–60 → Minor shift
60–80 → Strong volatility expansion
80–95 → Major spike (high-impact)
95–100 → Extreme event (institutional presence, sweeps, stop runs)
---
■ Final Summary
BT Spike gives traders:
Early detection of volatility expansion
Bull/Bear intensity visualization
Powerful alert automation
A universal signal layer that fits any strategy
Cleaner insight into where major moves originate
BT Spike = Your volatility radar .
It tells you when to look at a chart—before the move happens.
BT Delta AbsorptionBT Absorption detects aggressive counterflow volume—moments where one side
of the market (buyers or sellers) attacks aggressively, yet price fails to move
proportionally.
This is the classic definition of absorption:
"Large market orders are being absorbed by strong passive limit orders."
Absorption is one of the most reliable early signals for:
Reversals
Trap conditions
Failed breakouts
Liquidity grabs
Fake displacement moves
---
■ What BT Absorption Measures
1. Delta Imbalance
Identifies when buying or selling pressure becomes unusually one-sided.
2. Volatility Mismatch
Shows when large delta does NOT translate into meaningful price movement.
3. Absorption Strength Score
A normalized reading (often 0–100) showing the intensity of counterflow activity.
4. Wick & Structure Absorption
Wick-driven absorption helps identify:
Failed sweeps
Stop hunts
Rejection zones
Trapped traders
---
■ Why Absorption Matters
Absorption almost always precedes:
Reversals
Failed breakout moves
SMC/ICT-style displacement
Order block formation
Trend continuation after a trap
When aggressive traders cannot move price toward their desired direction,
the move typically reverses quickly—and with force.
---
■ Visual Elements
• Bull Absorption Marker
Often appears near lows—signals seller aggression failing to push price down.
• Bear Absorption Marker
Often appears near highs—signals buyer aggression failing to break higher.
• Absorption Score Heatmap (optional)
Shows intensity of absorption per candle.
• Threshold Levels
Identify when absorption becomes statistically significant.
---
■ How to Use BT Absorption in Trading
1. Reversal Detection
Look for absorption after:
Equal highs/lows
Sweeps
Stop runs
Breakout failures
This is often the earliest possible signal that a reversal is coming.
2. Filter Breakouts
A breakout without absorption is usually weak.
A breakout with absorption against it is likely a fakeout.
3. Confirm SMC/ICT Concepts
The indicator pairs perfectly with:
Fair Value Gaps
Order Blocks
Liquidity sweeps
Displacement legs
If your setup triggers and absorption confirms → high confidence.
4. Identify Trap Conditions
Absorption often marks:
Trapped breakout chasers
Trapped trend shorts
Imbalanced orderflow
These create ideal high-R trades.
5. Alert-Driven Market Monitoring
Use alerts for:
Bull Absorption
Bear Absorption
High-strength absorption
Absorption clusters
This allows traders to step away from charts while still catching
high-probability reversals.
---
■ High-Probability Absorption Setups
A) Sweep + Absorption
Swept level → absorption → enter opposite direction.
B) Failed Breakout Absorption
Breaks structure → delta fails → absorption prints → strong reversal.
C) Trend Continuation Absorption
Absorption against the correction often precedes continuation.
D) Absorption Clusters
Multiple absorption signals indicate a structural market shift.
---
■ Final Summary
BT Absorption provides:
Early reversal signals
Counterflow pressure detection
Confirmation for existing setups
Identification of liquidity traps
Alert-based monitoring across multiple markets
BT Absorption is the perfect complement to BT Spike:
• BT Spike = detects volatility ignition
• BT Absorption = detects failed aggression + reversals
Combined, they form a complete liquidity and orderflow toolkit.

TradePulse ProTradepulse is a proprietary trading tool that combines a directional signal engine, a trend-adaptive trailing stop system, and a momentum confirmation oscillator into a unified decision framework. Instead of simply stacking separate indicators on a chart, TradePulse integrates these components into a single rules-based system designed to help traders act with structure rather than emotion by identifying conditions where trend and momentum are aligning.
How It Works:
Directional Signals - TradePulse uses a custom price-average model with ATR-based volatility thresholds to detect transitions between bullish and bearish environments. Buy and Sell markers appear only when price strength and volatility conditions confirm a shift. Reducing noise and late entries.
Trend-Adaptive Trailing Stop - A dynamic trailing system combines smoothed moving averages with ATR expansion logic. As price develops, the trailing level adjusts automatically and target projections update based on symmetry extensions. Helping guide structured exits and trade management.
Momentum Confirmation - A proprietary oscillator blends stochastic positioning with center-of-gravity transformation and dual smoothing. It highlights whether momentum aligns with the directional shift, helping traders avoid weaker setups and focus on higher-quality conditions.
Key Features:
- Clear Buy/Sell transitions based on multi-factor confluence
- Adaptive trailing stop + projected targets for structured management
- Momentum filtering to support higher-quality opportunities
- Sensitivity adjustments to suit different markets & styles
TradePulse is original work protected under invite-only access. It is provided for educational and informational purposes only. Trading involves risk, and signals should always be validated with your own analysis and risk management.

Combined: Net Volume, RSI & ATR# Combined: Net Volume, RSI & ATR Indicator
## Overview
This custom TradingView indicator overlays **Net Volume** and **RSI (Relative Strength Index)** on the same chart panel, with RSI scaled to match the visual range of volume spikes. It also displays **ATR (Average True Range)** values in a table.
## Key Features
### Net Volume
- Calculates buying vs selling pressure by analyzing lower timeframe data
- Displays as a **yellow line** centered around zero
- Automatically selects optimal timeframe or allows manual override
- Shows net buying pressure (positive values) and selling pressure (negative values)
### RSI (Relative Strength Index)
- Traditional 14-period RSI displayed as a **blue line**
- **Overlays directly on the volume chart** - scaled to match volume spike heights
- Includes **70/30 overbought/oversold levels** (shown as dotted red/green lines)
- Adjustable scale factor to fine-tune visual sizing relative to volume
- Optional **smoothing** with multiple moving average types (SMA, EMA, RMA, WMA, VWMA)
- Optional **Bollinger Bands** around RSI smoothing line
- **Divergence detection** - identifies regular bullish/bearish divergences with labels
### ATR (Average True Range)
- Displays current ATR value in a **table at top-right corner**
- Configurable period length (default: 50)
- Multiple smoothing methods: RMA, SMA, EMA, or WMA
- Helps assess current market volatility
## Use Cases
- **Momentum & Volume Confirmation**: See if RSI trends align with net volume flows
- **Divergence Trading**: Automatically spots when price makes new highs/lows but RSI doesn't
- **Volatility Assessment**: Monitor ATR for position sizing and stop-loss placement
- **Overbought/Oversold + Volume**: Identify exhaustion when RSI hits extremes with volume spikes
## Customization
All components can be toggled on/off independently. RSI scale factor allows you to adjust how prominent the RSI line appears relative to volume bars.

QuantMotions - TPR SentinelQuantMotions – TPR Sentinel
The TPR Sentinel Band is a full trade-assistant for discretionary traders.
It combines an adaptive trend engine, directional TPR logic, volume intelligence, ATR-based risk management, a brute-force parameter optimizer, and a modern on-chart UI (entries/TP/SL panel + stats). The goal: fewer fake flips, clearer trend shifts, and visually guided trade management.
1. Core Concept
The Sentinel Line is built from a blend of:
- SMA + EMA
- Midline of highest/lowest high/low (Kijun-style)
- Donchian-style mid close
On top of that, the script calculates a Directional TPR (Time-Price-Ratio):
- Short / medium / long slopes of price
- Normalized by ATR
- Converted into a trend state:
+1 = Uptrend
-1 = Downtrend
0 = Neutral / transition
Hysteresis (Flux) controls how easily the trend flips:
- Higher hysteresis → harder to reverse → fewer fake-outs in chop.
2. Signals, Filters & Volume Intelligence
Signals
- Trend Flip Long: TrendState changes from −1/0 → +1.
- Trend Flip Short: TrendState changes from +1/0 → −1.
Filters
- ADX Filter (optional):
- Only allows trades if ADX is above a chosen threshold.
- Avoids trading in flat, low-energy markets.
R:R Filter:
- Before any signal is accepted, the script checks whether the distance to TP1 is at least the configured Risk:Reward ratio relative to the distance to SL.
- Only if that minimum R:R is reached, a signal becomes valid.
Volume Intelligence & Clouds
- Aggregates up/down volume (optionally across multiple tickers you define).
- Builds Volume Clouds around the Sentinel Line:
a) Positive intensity → buying pressure (bullish cloud).
b) Negative intensity → selling pressure (bearish cloud).
Optional Volume Direction Filter:
- Long only when volume intensity ≥ 0.
- Short only when volume intensity ≤ 0.
3. Risk, Exits & Trailing Stop
The indicator includes a complete exit framework (for visual/manual trading):
Stop Loss Modes
- ATR Fixed: SL placed at a fixed ATR multiple from the entry.
- Trend Line (Dynamic): SL placed directly on the Sentinel Band (structural stop).
Take Profits
- TP1 – “safe target”:
a) Based on ATR distance.
b) Closes a configurable percentage of the position (e.g., 50%).
- TP2 (optional):
Second fixed target used only when Trailing Stop is OFF.
- Trend Runner Mode (Use TP = OFF):
Ignores fixed TP levels and rides the trend until the trend state flips.
Trailing Stop
- Activates after TP1 is hit (if enabled).
- Moves with price at a configurable ATR distance:
a) Long: trail creeps up under price.
b) Short: trail creeps down above price.
- Visually plotted as a purple trail line, dynamically replacing the original SL as the effective exit point.
Each trade is tracked internally and drawn as a green/red box with PnL labels between entry and exit.
4. UI & Stats
Candle Coloring (TRON Theme)
- Cyan = active uptrend & valid environment.
- Orange = active downtrend & valid environment.
Modern Trade Panel (on last bar)
- Live overlay of:
a) Entry
b) TP1
c) TP2
d) SL or active Trail (with dynamic label text: “SL (ATR)”, “SL (Struct)”, “TRAIL”)
Info label shows:
- Historical win rate in the current direction (Long/Short).
- Distance to SL, TP1, TP2 from current price.
- Box color blends from red → green depending on whether price is closer to SL or TP.
Stats Table (Bottom Right)
- Separate stats for Long and Short trades:
a) Win rate (%)
b) Cumulative PnL
Alerts
- Generates JSON alerts on signals, for example: {"side":"buy","ticker":"XYZ","price":123.45}
Perfect for webhooks, bots, or external automation.
5. Brute Force Optimizer (TPR Lab) – Important Limitations
The built-in Optimizer is a numerical helper, not a full strategy optimizer.
What it does:
- Runs brute-force simulations over a sliding window of historical data.
- Scans user-defined ranges for:
- Best Period (“Best Cycle”)
- Best Hysteresis (“Best Flux”)
Uses an efficiency score (average profit per trade) to rank combinations.
Displays results in the bottom-left TRON panel:
- Best Cycle
- Best Hysteresis
- Efficiency Score
What it does NOT optimize or take into account:
- It does not include your actual minimum R:R filter.
- It does not simulate or optimize your Stop Loss modes.
- It does not simulate Trailing Stops.
- It does not use the ADX filter.
- It does not use the Volume filters or Volume Clouds.
Because of this, the suggested “best” Period and Hysteresis are purely computational recommendations based on a simplified internal model.
In real trading, with your full setup (R:R filter, SL mode, Trailing, ADX, Volume confirmation, personal style), other parameter combinations can be superior to what the Optimizer suggests.
You should treat the Optimizer as:
A starting point or a research tool, not the final truth.
Always validate its suggestions visually, in the context of your full system and risk management.
6. Practical Usage
- Works on FX, indices, crypto, commodities – anything with decent liquidity.
- Scalping → use lower Period values, higher responsiveness.
- Swing → use higher Period values, more stability.
Recommended:
- Keep ADX filter ON to avoid dead markets.
- Use Volume Clouds as directional bias.
- Use the Info Panel and Stats to align with your own R:R and risk rules.
Disclaimer
This script is for educational/analytical purposes only and does not constitute financial advice. It does not execute trades or manage your risk automatically. Always combine it with your own strategy, money management, and independent decision-making.
Use the Info Panel and Stats to align with your own R:R and risk rules.

Session Dynamics & Pivot Overlay (Arjo)## **OVERVIEW**
The **Session Dynamics & Pivot Overlay (Arjo)** is a visual analysis tool that displays session-based price ranges, anchored volume-weighted averages, daily pivot levels, and smoothed trend conditions on the chart. It highlights how price interacts with custom sessions, midpoint levels, and dynamic ranges, providing a structured visual layout that helps users observe market behavior over time without implying any form of prediction or trading signal.
## **CONCEPTS**
This indicator incorporates several widely used analytical concepts:
- **Session Ranges:** Identifies user-defined time windows and visually displays their high, low, and midpoint behavior throughout the session.
- **VWAP (Morning Session):** Shows volume-weighted average price calculations for a defined morning period, assisting with visual comparison between price and weighted averages.
- **Daily Pivot Levels:** Displays R1–R2, S1–S2, central pivot, and associated levels derived from prior daily price data.
- **Trend Smoothing:** Uses SuperSmoother filtering and an additional EMA to highlight whether the smoothed trend is rising or falling.
- **EMA + ATR Bands:** Plots a 20-period EMA with upper and lower ATR-derived bands to help visualize short-term price displacement relative to average true range.
All of these elements are presented solely for structural and comparative chart analysis.
## **FEATURES**
- **Custom Session Visualization:** Automatically draws session boxes, capturing the evolving high, low, and midpoint throughout the defined intraday window.
- **Dynamic Midline Calculation:** A midpoint line is updated continuously during the session to visually anchor price within the session’s range.
- **Morning Session VWAP:** Displays a dedicated VWAP line for the morning window with adjustable source and configuration options.
- **Daily Pivot Lines:** Automatically plots pivot, BC/TC, R1–R2, and S1–S2 levels with customizable colors, widths, and line styles.
- **Trend-Responsive Pivot Display:** Optionally toggles visibility of R2 or S2 depending on the direction of the smoothed trend.
- **EMA + ATR Zones:** Renders a 20-EMA and ATR-based support/resistance zone using filled regions for enhanced visual clarity.
- **Full Customization:** Multiple color, transparency, line-style, and display options allow users to adapt the presentation to their charting preferences.
- **Overlay Compatible:** Designed to work directly on price charts without obstructing candles or other overlays.
## **HOW TO USE**
Users can interact with the indicator entirely through the settings panel:
- Adjust session timings to match preferred market hours or custom internal zones.
- Enable or disable the display of pivot levels, VWAP, or the ATR/EMA zone.
- Customize colors and line styles to improve visibility according to the chart background or personal preference.
- Observe how price behaves relative to the session box, midpoint, VWAP, and pivot levels for contextual understanding.
- Utilize the smoothed trend condition to see when the indicator chooses to display certain pivot extensions.
These elements help users interpret chart structure, volatility, and intraday behavior in a visually organized manner.
## **CONCLUSION**
The ** Session Dynamics & Pivot Overlay (Arjo) ** indicator offers a consolidated view of session structure, pivot levels, VWAP, and smoothed trend conditions. Its purpose is to improve visual clarity and assist users in understanding market context without issuing directives or trade suggestions. It functions as an educational tool that enhances chart interpretation and supports structured analysis.
---
## **DISCLAIMER**
This indicator is for educational and visual analysis purposes only. It does not provide trading signals, financial advice, or guaranteed outcomes. Users should conduct their own research and consult a licensed financial professional when necessary. All trading decisions are solely the responsibility of the user.
Happy Trading (Arjo)

Pure xATR ProUncover the hidden rhythm of the market with Pure xATR Pro. This indicator is designed for serious traders who need to understand "Price Extension". It calculates the precise distance between the price and the baseline Moving Average (MA) relative to market volatility (ATR). Instead of guessing top and bottom, visualize exactly where the price stands in the cycle—from extreme panic selling to euphoric profit-taking.
Key Features:
4-Stage Market Zoning System:
Panic Zone (Oversold): Identifies extreme price drops (statistically rare deviations). Often presents high-reward mean reversion opportunities.
Buy Zone (Entry): The sweet spot for trend initiation.
Hold / Winner Zone: Detects strong momentum. Keeps you in the trade while the trend is healthy (Ride the trend).
Profit Taking Zone (Overbought): signals when the price is statistically overextended and liable to pullback.
Adaptive Volatility Logic:
Includes a dynamic algorithm that analyzes historical volatility (Lookback Period) to automatically adjust Overbought/Oversold percentiles, adapting to changing market conditions.
Professional Dashboard:
Real-time Status: Displays current Zone, Volatility State (Breakout/Normal), and Actionable Advice.
Risk Management: Auto-calculates Dynamic Stop Loss (based on Supertrend, ATR, or MA) and Fixed % Risk.
Multi-Level Targets: Automatically projects 3 profit targets (TP) based on ATR multiples.
Clean & Customizable Visuals:
Smart Highlighting: Background colors automatically highlight key zones (Panic/Buy/Hold/Profit).
Style Control: Full color customization available directly in the "Style" tab for a clutter-free input menu.
------------------
ค้นพบจังหวะที่แท้จริงของตลาดด้วย Pure xATR Pro อินดิเคเตอร์ระดับมืออาชีพที่ออกแบบมาเพื่อวิเคราะห์ "ระยะการยืดตัวของราคา" (Price Extension) โดยคำนวณระยะห่างระหว่างราคากับเส้นค่าเฉลี่ย (MA) เทียบกับความผันผวน (ATR) ช่วยให้คุณเห็นภาพชัดเจนว่าราคา ณ ปัจจุบันอยู่ในสถานะใด ตั้งแต่จุดที่คนเทขายด้วยความตกใจ (Panic) ไปจนถึงจุดที่ราคาแพงเกินไปและควรขายทำกำไร
ฟีเจอร์หลัก (Key Features):
ระบบแบ่งโซนตลาด 4 ระดับ (4-Stage Zoning):
Panic Zone (โซนของถูก/Oversold): จับจังหวะที่ราคาดิ่งลงแรงผิดปกติ ซึ่งมักเป็นจุดกลับตัวที่ให้ผลตอบแทนสูง (High Reward)
Buy Zone (โซนสะสม): จุดเริ่มต้นของเทรนด์ เป็นระยะปลอดภัยในการเข้าออเดอร์
Hold / Winner Zone (โซนรันเทรนด์): แยกแยะช่วงที่เทรนด์แข็งแกร่ง ให้คุณ "ถือสถานะต่อ" (Let Profit Run) ไม่ขายหมู
Profit Taking Zone (โซนขายทำกำไร): แจ้งเตือนเมื่อราคาวิ่งไปไกลเกินค่าเฉลี่ยทางสถิติ (Overextended) เพื่อพิจารณาขาย
ระบบปรับตัวตามความผันผวน (Adaptive Logic):
อัลกอริทึมอัจฉริยะที่คำนวณค่า Percentile ย้อนหลัง เพื่อปรับระดับ Overbought/Oversold ให้เหมาะสมกับสภาวะตลาดที่เปลี่ยนไปโดยอัตโนมัติ
หน้าปัดสถานะครบวงจร (Professional Dashboard):
แสดงสถานะปัจจุบัน (Action), ระดับความผันผวน, และคำแนะนำแบบ Real-time
Risk Management: คำนวณจุด Stop Loss ให้อัตโนมัติ (เลือกสูตรได้: Supertrend, ATR, หรือ MA)
Target Projection: คำนวณเป้าหมายทำกำไร (TP) ให้ล่วงหน้า 3 ระดับตามระยะ ATR
กราฟสะอาดตา ปรับแต่งง่าย (Clean Visuals):
Smart Highlight: ไฮไลท์สีพื้นหลังตามโซนต่างๆ อัตโนมัติ (Panic/Buy/Hold/Profit) ทำให้ดูเทรนด์ง่ายเพียงกวาดตา
Customizable: ปรับแต่งสีและความโปร่งใสได้อิสระผ่านแถบ "Style" เพื่อกราฟที่ดูเป็นระเบียบและไม่รกสายตา

Volatility Radar [upslidedown]💎 Overview
Volatility Radar visualizes extreme volatility conditions in a clean, intuitive oscillator format.
Unlike traditional momentum oscillators, it transforms average true range (ATR) behavior into a directional volatility structure, making it easier to spot moments when markets may be shifting into expansion, compression, or potential pivot zones.
💎 How to Use
The oscillator highlights moments when the internal volatility condition becomes active as well as when that condition breaks. These events may coincide with structural turning points, breakout conditions, or volatility expansions. While not a prediction tool, Volatility Radar helps traders identify moments worth paying closer attention to.
💎 Signal Markers
■ Square icons on top/bottom identify when the Volatility Radar condition is ACTIVE
▲▼ Triangle icons on top/bottom identify when the Volatility Radar condition BREAKS
📌 Chart Example:
💎 Oscillator Trends
One of the core features of Volatility Radar is its ability to highlight positive or negative volatility trends. The oscillator automatically colors its components to reflect uptrending vs. downtrending volatility structure, making trend context easier to interpret at a glance.
📌 Chart Example:
💎 Histogram Trends
For users who prefer a more compact or traditional visual style, Volatility Radar includes an optional histogram display mode. This mode provides a clean representation of the detected trend and can be helpful for validating price-action concepts within the broader volatility context.
📌 Chart Example:
💎 Volatility Moving Average
The yellow moving average line offers a volatility moving average that can aid in determining longer term trend strength.
Interpret the trend direction by observing whether the average is increasing/decreasing or above/below the zero line.
Reversals may be observed when values move into oversold territories.
Trend continuation may occur during periods when the average is near the zero line.
Evaluate opportunities when the moving average is "touched" or "pinged" by the radar line (setting available to highlight these crosses).
📌 Chart Example:
💎 Backtesting Support
Volatility Radar outputs external signals designed for use with automated backtesting on TradingView. It integrates with @jason5480’s open-source Template Trailing Strategy and its supporting signal libraries.

ZynIQ Pullback Zones Lite - (Lite Pack)Overview
ZynIQ Pullback Zones Lite identifies dynamic EMA-based retracement areas inside trending markets. These zones highlight where price is most likely to pull back before continuing in the dominant direction. The tool is intentionally simple, visual, and designed to complement the rest of the ZynIQ Lite package without adding noise or complexity.
This is a contextual tool — ideal for timing continuation entries, filtering counter-trend trades, and improving overall trend structure awareness.
Key Features
• Dynamic pullback zones using profile-based EMA + ATR
• Smart trend detection with optional HTF confirmation
• Fresh-touch recognition for potential continuation setups
• Clean ZynIQ-themed visuals (teal/fuchsia zones)
• Lightweight chart footprint for intraday and swing traders
• ZynIQ Lite HUD with profile, trend and HTF status
• Moveable watermark for clear branding on streams and screenshots
• Alerts for long and short pullback opportunities
Use Cases
• Identifying pullback areas within established trends
• Avoiding early entries during retracements
• Timing continuation setups more cleanly
• Filtering false breakouts and counter-trend traps
• Combining with breakout or momentum tools for confluence
• Works on crypto, forex, indices and commodities
Notes
This tool provides structure and context for pullback-based trend trading.
It is not a standalone strategy and should be combined with your preferred confirmations and risk management rules.

IDWM Master StructureExecutive Summary
The IDWM Master Structure is a Multi-Timeframe (MTF) trading tool designed to force discipline by aligning traders with the "Parent" trend. It functions by locking onto the "Completed Auction" of a higher timeframe candle (like a Daily or Weekly bar) and projecting that structure onto your lower timeframe chart. Its primary goal is to define the "Dealing Range"—the hard boundaries where value was previously established—so you don't get lost in the noise of smaller price movements.
1. The Principle of Completed Auctions (Hierarchy)
Most technical indicators curve dynamically with every price tick. This script acts differently because it relies on "Settled Arguments." A closed Daily candle represents a finished battle between buyers and sellers; the High and Low are the historical results of that battle.
To enforce this, the script automatically selects a "Parent" timeframe based on your view:
Scalping (charts below 15 minutes) uses the 4-Hour Auction.
Intraday trading (15 minutes to 4 Hours) uses the Daily Auction.
Swing trading (Daily chart) uses the Weekly Auction.
2. Liquidity Pools & The Sticky Range
The High and Low lines drawn by the indicator are not just support and resistance; they represent Liquidity Pools. In market theory, stop-losses (Sell Stops below Lows, Buy Stops above Highs) accumulate at these edges.
Smart money often pushes price just past these lines to grab this liquidity (a "Stop Hunt") before reversing direction. To account for this, the script uses a "Sticky Range" mechanism. It refuses to redraw the box simply because price touched the line. Instead, it uses an Average True Range (ATR) Buffer. A new structure is only formed if the candle closes decisively outside the range plus this volatility buffer. This ensures you are trading real breakouts, not liquidity sweeps.
3. Internal Range Mechanics (Premium vs. Discount)
Inside the Master Box, the script applies Equilibrium Theory to help with trade location.
The most important internal line is the Equilibrium (EQ), which marks the exact 50% point of the range.
Premium Zone (Above EQ): Price is mathematically "expensive" relative to the recent range. Algorithms generally look to establish Short positions here.
Discount Zone (Below EQ): Price is considered "cheap." Algorithms generally look to establish Long positions here.
It also plots the Master Open, which acts as a "Line in the Sand." If price is currently trading above the Master Open, the higher timeframe candle is Green (Bullish), suggesting longs have a higher probability. If below, the candle is Red (Bearish).
4. Wick Theory (Failed Auctions)
The script places special emphasis on the wicks of the Master Candle because a wick represents a "Failed Auction"—a price level the market tried to explore but ultimately rejected.
The indicator highlights the background of the wick area (from the High to the Body). On a retest, these zones often act as supply or demand blocks because the market remembers the previous failure.
It also calculates the "Consequent Encroachment," which is the 50% midpoint of the wick. The rule of thumb here is that if a candle body can close past 50% of a wick, the rejection is nullified, and price will likely travel to fill the entire wick.
5. Energy Expansion (Breakout Targets)
Market energy transfers from Consolidation (inside the box) to Expansion (the breakout). When the price finally breaks the "Sticky Range" (confirming via the ATR buffer), the script projects where that energy will go.
It uses the height of the previous range to calculate Fibonacci extensions. Specifically, it targets the 1.618 Extension, often called the "Golden Ratio." This is a statistically significant level where expansion moves tend to exhaust themselves and reverse.
6. Safety Protocol: Live Detection
A dashboard monitors the state of the parent candle. If the text turns Magenta with a warning symbol, it means the Higher Timeframe candle is "Live" (still forming).
Trading off a live structure is considered higher risk because the "Auction" isn't finished—the High or Low can still shift. The safest approach is to trade when the dashboard indicates a standard, locked, historical structure.

MA + ATR Channel V2This script creates a dynamic volatility channel (similar to a Keltner Channel). It plots a central Moving Average (SMA or EMA) to represent the baseline trend and uses the Average True Range (ATR) to calculate the Upper and Lower bands. The channel automatically widens during high volatility and narrows during low volatility.
Usage
Mean Reversion: In sideways markets, prices touching the outer bands often tend to revert back to the central line.
该脚本构建了一个基于波动率的动态通道(类似肯特纳通道)。它以**移动平均线(SMA或EMA)为中轴判断趋势,并利用真实波幅(ATR)**计算通道宽度。通道范围会随市场波动加剧而变宽,随波动平缓而收窄。
用法
震荡回归: 在横盘行情中,价格触及通道边缘时,往往有回调至中轴的倾向。

Hash SupertrendHash Supertrend is a visually enhanced Supertrend-based indicator designed by Hash Capital Research, tuned specifically for crypto trend trading on Solana (SOL) and Bitcoin (BTC). It combines institutional-style color coding, an optional session time filter, and production-ready alerts for systematic and discretionary traders alike.
What This Indicator Is
Hash Supertrend is a trend-following volatility band indicator built on TradingView’s native ta.supertrend() function.
It’s optimized and visually styled for:
High-volatility crypto pairs (especially SOL/USDT, SOL/USD, BTC/USDT, BTC/USD)
Timeframes typically used by crypto traders (from 5m scalping to 4H swing and 1D trend following)
The script is an indicator, not a strategy:
It does not place trades or show backtest results.
It provides clear trend states, flips, and alerts that you can plug into your own execution stack or manual trading.
Key Features
✅ Tuned for Crypto (Solana & Bitcoin)
Parameters are chosen to respond well to the volatility profile of SOL and BTC, reducing noise while still catching strong moves.
✅ Non-repainting Supertrend Core
Uses TradingView’s built-in ta.supertrend — values may move intrabar as the bar forms, but once a bar closes, the historical line and signals do not repaint.
✅ Fluorescent Trend Visualization
Bright green for bullish phases
Bright red for bearish phases
Adaptive color intensity based on user setting
✅ Glow Layer & Trend Zones
Glow effect around the Supertrend line for instant visual recognition
Optional filled zones between price and line for “trend cloud” style visualization
✅ Time Filter (Session Control)
Option to only mark signals during specific hours for those wanting to integrate with webhooks
Designed for traders who avoid certain sessions (e.g., low-liquidity hours)
✅ Signal Dots & Alerts
Tiny green dots for bullish flips
Tiny red dots for bearish flips
Professional, preconfigured alerts for:
Long Entry
Short Entry
Any Trend Change
Filtered signals outside trading hours (for monitoring only)
The core logic is built on:
ATR Length (ATR Length) Default: 16
Lower values (7–10): more sensitive, more signals, more noise
Higher values (12–20): smoother, fewer but stronger trend signals
Factor (Factor) Default: 3.11
Lower values (1.5–2.5): tighter bands, earlier entries, higher whipsaws
Higher values (3.0–4.0+): wider bands, later entries, stronger trend confirmation
The indicator reads direction from ta.supertrend and classifies:
Bullish Trend: direction < 0
Bearish Trend: direction > 0
A trend flip happens when direction changes sign:
longSignal: Supertrend flips from above price to below price (bearish → bullish)
shortSignal: Supertrend flips from below price to above price (bullish → bearish)

AMS Adaptive Supertrend - v1.0The ATMOS MARKET SUITE (AMS) Adaptive Supertrend is a volatility-responsive trend framework designed to keep structural context clear across changing market conditions. It expands on the traditional Supertrend by incorporating ATR percentiles, regime detection, and optional higher-timeframe and VWAP overlays.
Instead of issuing buy/sell signals, this tool helps traders understand trend direction, structural stability, volatility environment, and potential transitions. Its adaptive architecture allows the Supertrend to remain steady during chop while responding more dynamically during strong expansions.
Best Uses
• Identifying clear structural trend during intraday trading
• Filtering for aligned conditions before trend continuation setups
• Understanding volatility regimes (compressed vs expanding)
• Monitoring HTF structural influence on lower-timeframe trades
• Using as a standalone trend backbone or as part of the full ATMOS MARKET SUITE suite
This indicator provides context, not predictions. It is fully functional on its own and also integrates naturally with the Momentum Engine, Consensus Strip, and Cx3 ORB system.

BT MA BandsThe BT MA Bands indicator is built around a central moving average (MA) with upper and lower bands derived from it, similar to Bollinger Bands but focused on exponential moving averages (EMAs) for smoother responsiveness.
The core idea is to visualize trend strength, volatility squeezes, and potential reversal points through dynamic bands that expand/contract based on price deviation. It includes trend-based color fills, entry/exit signals, an optional ATR (Average True Range) overlay for additional volatility bands, and flexible MA source options to adapt to different market conditions.
Inputs
MA Type and Length: Choose from EMA (default), SMA, WMA, or HMA. Default length is 20 periods, but adjustable (e.g., 10-50) for short-term scalping or longer swings.
Deviation Multiplier: Sets the band width as a multiple of the standard deviation from the MA (default: 2.0). Higher values create wider bands for trending markets; lower for ranging ones.
Source Data: Select price source for the MA calculation—close (default), open, high, low, (high+low)/2, or weighted (hlc3/hlcc4) to emphasize different aspects of price action.
ATR Toggle and Multiplier: Optional ATR-based outer bands (default off). When enabled, multiplier (default: 1.5) adds volatility sensitivity, helping filter noise in choppy conditions.
Signal Sensitivity: Threshold for generating buy/sell alerts (e.g., 0-100 scale; default 50) based on band crossovers or squeezes.
Style Options: Enable/disable fills, signals, and colors for personalization.
Visual Elements
Central MA Line: A solid line (e.g., blue by default) representing the chosen moving average, acting as the baseline.
Upper and Lower Bands: Dotted or dashed lines (green/red defaults) that flank the MA, widening during volatility and narrowing in consolidations.
Color-Changing Fills: The area between bands fills with color shifts—bullish (green) when price is above the MA and bands are expanding, bearish (red) when below and contracting, or neutral (gray) during flat trends.
Entry Signals: Arrow plots (up green for bullish, down red for bearish) appear on the chart when price crosses the bands or a squeeze resolves, with optional text labels like "Buy" or "Sell."
ATR Overlay (if enabled): Additional dashed outer bands in a lighter color (e.g., purple) to highlight extreme volatility zones.
How to Use It in Trading
Trend Identification: Use the central MA and band fills to gauge direction—price above the MA with green fills signals an uptrend (favor longs); below with red indicates downtrends (favor shorts). Narrow bands suggest a "squeeze" setup, often preceding big moves.
Entry Points:
Bullish Entries: Enter long when price breaks above the upper band on a bullish signal arrow, especially after a squeeze. Confirm with volume spike or RSI >50 on timeframes like 5m-1h for quick trades.
Bearish Entries: Enter short on a break below the lower band with a bearish arrow, post-squeeze. Ideal on 4h+ frames for swings, paired with MACD crossovers.
Exits and Risk Management: Exit longs when price hits the lower band or a bearish signal fires; vice versa for shorts. Set stops just beyond the opposite band (e.g., below lower for longs). Target 1.5-3x risk-reward, using ATR bands for trailing stops in volatile markets.
General Tips: Best in trending environments; avoid during news events causing false breakouts. Backtest parameters on historical data, and combine with other indicators like RSI or volume for confluence. It's great for spotting reversals but not infallible—always apply position sizing and monitor for band "walks" (price hugging one band) as continuation signals.

BT LigmaThe BT Ligma indicator combines momentum-based signals with volatility filters to identify potential trend reversals and high-probability entry points.
It uses a set of Exponential Moving Averages (EMAs) – typically a fast EMA (e.g., 9-period) crossing over a slower one (e.g., 21-period) – to generate baseline buy/sell signals. These are enhanced by a proprietary "Ligma Spread" filter, which measures the dynamic spread between short-term price action and a volatility envelope (similar to Bollinger Bands but customized with ATR multipliers). This filter helps weed out false signals in choppy markets by requiring a minimum spread threshold before confirming a trade alert.
BT Ligma allows a user to select up to 3 EMAs, the MA calculation method, and signal individual candles that cross EMA 1 & 2, or all 3 bands in the same bar.
Version 1.4, includes refined alert logic, including audio/visual notifications and optional trailing stops based on EMA alignments.
To use it effectively for trade entries:
Long (Buy) Entries: Look for a bullish EMA crossover (fast EMA above slow) combined with a positive Ligma Spread expansion (indicating increasing momentum). Enter when the signal fires on a close above the recent swing high, ideally on a timeframe like 15m or 1h for scalping/day trading. Pair this with volume confirmation or RSI above 50 to avoid overbought traps.
Short (Sell) Entries: Wait for a bearish EMA crossover (fast below slow) with a contracting or negative Ligma Spread (signaling potential downside volatility). Enter on a close below the recent swing low, using higher timeframes (e.g., 4h) for swing trades to capture larger moves.
General Tips: Always apply risk management – set stops below/above the slow EMA, target 2-3x risk-reward ratios, and avoid trading during low-liquidity periods. Backtest on historical data to tweak parameters, and combine with fundamentals like news events for better context.
Institutional Edge Pro v1.0 - 9.3/10 ConfidenceEducational 5-layer confirmation system combining institutional order flow concepts, trend analysis, and risk management principles. Features Order Block detection, adaptive stop losses (EMA 9x21), and probability scoring. For educational purposes only.
## ⚡ KEY FEATURES
### 🔍 5-Layer Confirmation System
- **Layer 0:** Market Regime Detection (30% weight) - ADX, Choppiness Index, Volatility, Volume
- **Layer 1:** Golden/Death Cross Trend Filter (20% weight) - EMA 50/200 with gradient confirmation
- **Layer 1.5:** Fast Death Cross Stop Loss - EMA 9/21 dynamic exits
- **Layer 2:** Smart Order Block Detection (20% weight) - Institutional footprint tracking
- **Layer 3:** Probabilistic Confirmations (20% weight) - RSI, MACD, Volume, Structure, Volatility
- **Layer 4:** Dynamic Risk Management (10% weight) - ATR-based adaptive stops
### 📊 Visual Dashboard
- **Regime Score:** 0-100 market health indicator
- **Trend Status:** Real-time BULL/BEAR/NONE classification
- **Trend Quality:** Freshness metric (degrades over time)
- **Order Block Status:** Active OB tracking with validation
- **Probability Scores:** Live Long/Short setup probabilities

Clean Industry DataClean Industry Data – Overview
Clean Industry Data is a utility tool designed to give traders an instant, structured view of key fundamental and volatility metrics directly on the chart. The script displays a compact, customizable information panel containing:
Industry & Sector
Market Cap and Free-Float Market Cap
Free-Float Percentage
Average Daily Rupee Volume
Relative Volume (R.Vol) based on daily volume
% from 10 / 21 / 50 EMAs (calculated on daily closes)
ADR (14-day) with threshold-based indicators
ATR (current timeframe) with colour-coded risk cues
All volume-based statistics are anchored to daily data, ensuring the values remain consistent across all timeframes. The display table supports flexible positioning, custom background/text colours, and adjustable text size.
This script is ideal for traders who want a quick, accurate snapshot of a stock’s liquidity, volatility, and broader classification — without digging through multiple menus or external sources.

ATM PROThe world’s strongest indicator that combines multiple indicators together, providing you with entry points, targets, and stop-loss levels with extreme accuracy. You can adjust its inputs to suit Forex and crypto pairs according to your needs. It contains these tools, and you can modify them based on your requirements.
المؤشر الاقوى عالميا الذي جمع عدة مؤشرات معا , من خلاله سيعطيك نقاط ( دخول واهداف وايقاف خسارة ) بدقة متناهية وتستطيع ان تعدل المدخلات ليتناسب مع ازواج الفوركس والكريبتو بشكل يتناسب مع ما تحتاجه
يحتوي على هذه الادوات ويمكنك تعديلها حسب متطلباتك
SHORT EMA
LONG EMA
TREND EMA
MACD SHORT
MACD LONG
MACD SIGNAL
RSI LENGTH
ATR LENGTH
VOLUME MULTIPLIER
ATR TARGET 1.2.3.4.5
STOP LOSS MULTIPLIER
BY ATM TEAM

Simple Price ChannelSimple Price Channel
This indicator plots a basic volatility-based channel around a moving average.
Features:
Midline using Simple Moving Average (SMA)
Upper & lower bands using ATR or true range
Channel fill for easy trend visualisation
This script is designed for educational and analytical purposes only.
It does not provide signals, alerts, or financial advice.
