ATR
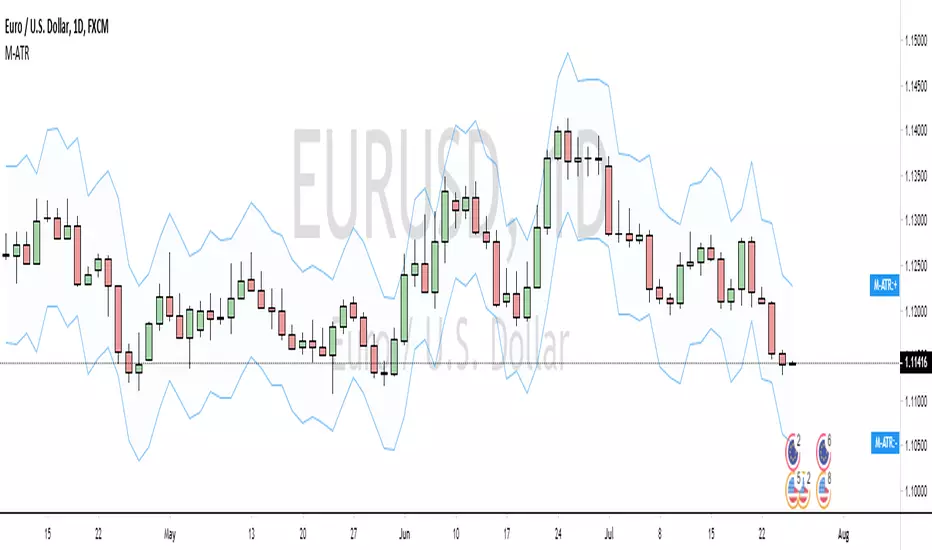
Alert-QuarryLake Indicator Map - ATR Trend Following Strategy A lot of times I don't like my chart crowding with indicators, thus the reason for creating this script for my strategy QuarryLake.
This script also comes with alert.
Below is the explanation for QuarryLake
I have also updated the script in version 4.
This strategy consists of 3 indicators that I found works quite well together.
Keltner Channel, Waddah Attah Explosion, and Volatility Stop.
You can find WAE here
KC Period = 200
KCATR = 5
Vstop Period = 3
Vstop Mult = 1.5
Long when close > KC, close > Vstop, WAE trendUp
Short when close < KC, close < Vstop, WAE trendDown
Works well on BTCUSD XBTUSD, as well as other major liquid Pair.
Feel free to follow me on Twitter @Lancelot_Auger for more free Alpha.
Please acknowledge my effort by like and follow.
And lastly,
Save Hong Kong, the revolution of our times.


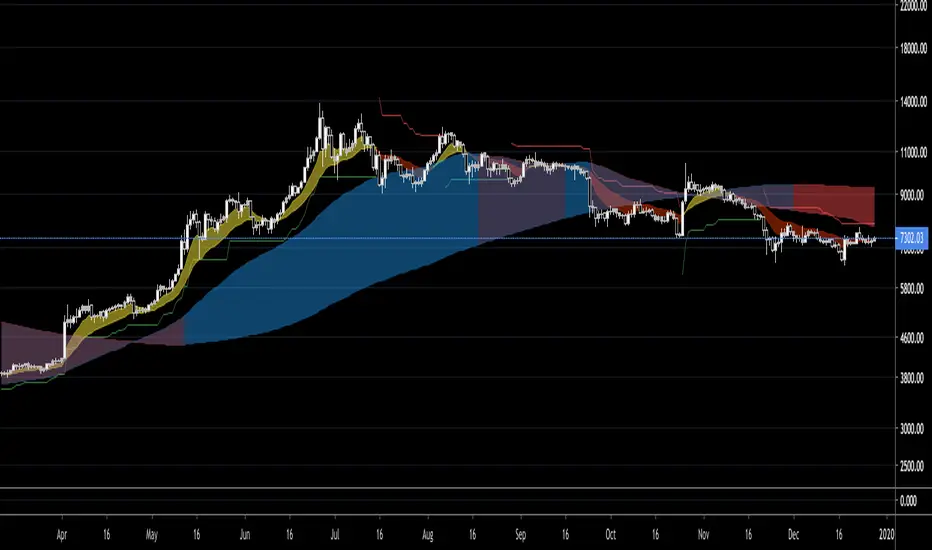
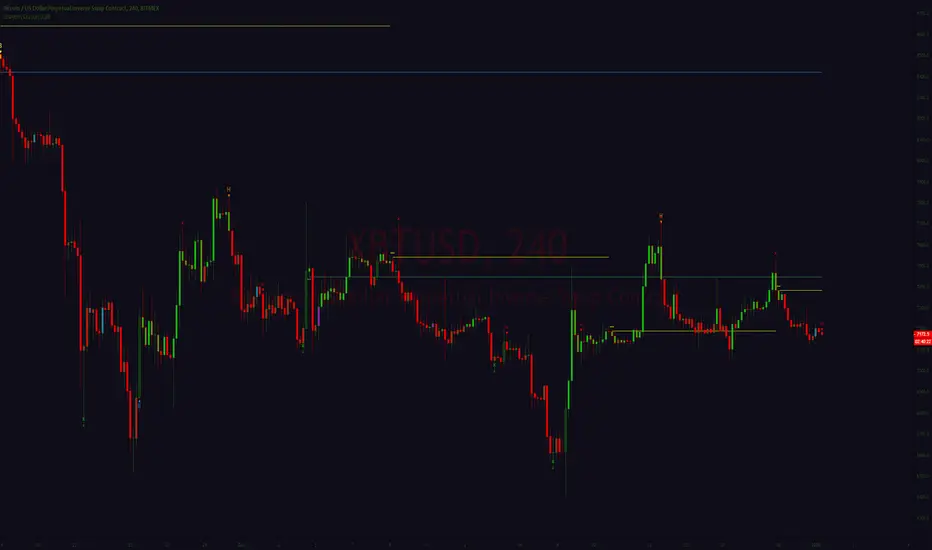
CloudRest ATR based cloudThis is an indicator I have been working on for the past 2 years, developed specifically for cryptocurrency.
It is primarily a trend following indicator with great success and it performs the best in 4hrs to the weekly chart.
There are two components of this indicator.
The baseline from Ichimoku cloud and volatility stop .
baseline period = 26
volatility stop = 1.5ATR, 3
You can view this as the main component of a trend following system but you will need other confirmation indicators to confirm your entry.
Feel free to modify the script for your own system.
Feel free to follow me on twitter @Lancelot_Auger
I will be posting more content in the future, stay tuned.
And lastly,
Free hong kong, the revolution of our time!

Moar MAsJust a bunch of things I like, to determine trend direction.
This script uses faster EMAs and slower SMAs. Also ATR for stops and trend reversals.
Acmillions Double ATR BandsDouble ATR Bands
ATR can be used to calculate stop loss and take profit
Recommended to take action one candle after the current candle
hits the support or resistance.
Long position
Inner green line - take profit for long position
Outer red line - stop loss for long position
Short position
Inner red line - take profit for short position
Outer green line - stop loss for short position
Cheers and happy trading. ^_^

Average True Range Trailing Stops TFAverage True Range for trailing stops, can be set to any timeframe independently of currently-displayed timeframe
This indicator is derived from
but more customizable.
Many thanks to HPotter for the original version

ATR ChannelsATR Channels help you to identify where to place your stop-loss or trailing stop-loss based on price volatility, according to the Average True Range (ATR).


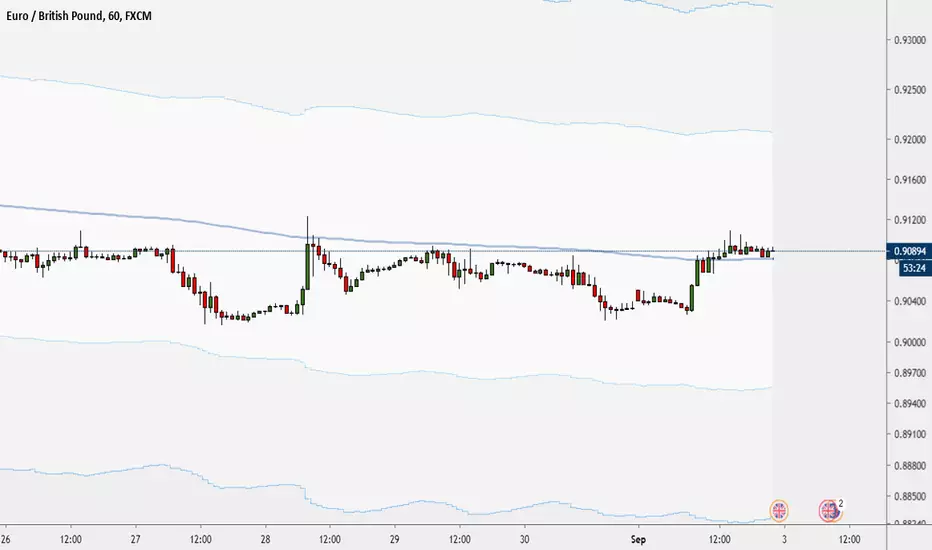
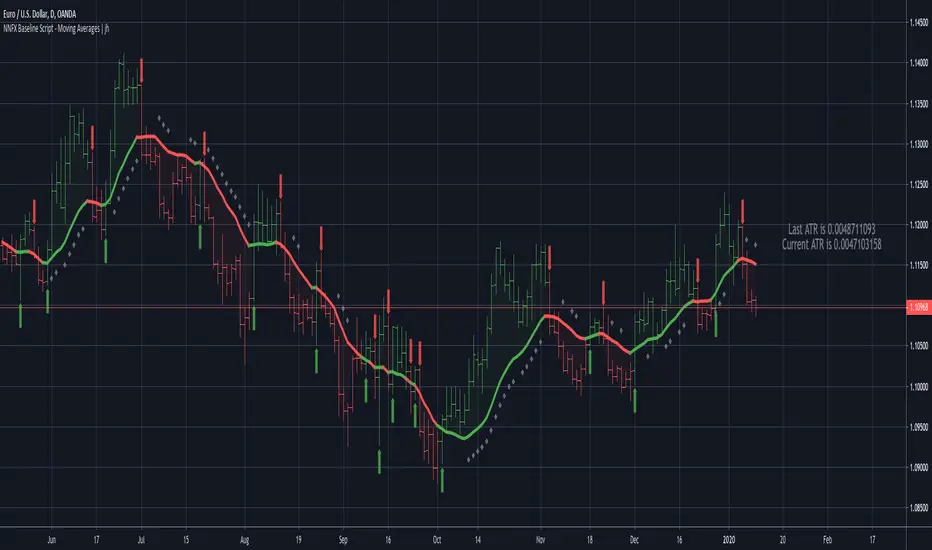
NNFX Baseline Script - Moving AveragesCredits to @Fractured
Adapted the "Many Moving Averages" script to VP's NNFX No Nonsense Forex method.
Includes:
- ATR bands and labels
- Price is > 1 ATR away from baseline indication
Without ATR Bands and bar colors
Available MAs
"ALMA", "EMA", "DEMA", "TEMA", "WMA", "VWMA", "SMA", "SMMA", "HMA", "Kijun", "McGinley"

Double EMA + ATR Trend FollowerThis indicator consists of a fast and slow EMA (default lengths are 50 and 9 periods) and an upper and lower ATR band. When combined, this combination gives traders an accurate picture of both trend strength and direction.
Users can modify the lengths of the fast and slow EMA , as well as the multipliers and length for the upper and lower ATR bands.

Maximum ATR BandsSlight modification on my previous script "ATR-Overlay"
This script plots the max value of the ATR in a given period.
Really straight forward, but has given me better stop-loss levels on trade entries.

Crayons GrayonsUpdate for
Crayons 0.2
Crayons is early onset hyper customizable trend reversal trading suite
There is some big changes for Signal and Pivot generation and its set as Default mode so in case of nostalgia for white noise there is an option to "rollback" placed at the top of input menu
As always- hyper customizable
Every singal core crayon signal group will be turned on by default so open input menu for personalizing signals to charts and personal character
Crayons 0.2-
Greatly improved Signal quality
Improved Pivot detection logic
Two Set's of Pivots "Cleaned" and "Vanilla"
Optional Polichrome candle painter mode to provide additional information on demand
Optional Labels for signals and pivots
Secondary risk filter filtering "riskier" signal sequences (Experimental)
Second MA is changed by ATR modified to work as trailing S/R (Source is ohlc4 for whip protection model is experimental ,filters used is not suitable for micro tf so atr calls for higher periods, its experimental and will be fixed or removed with later updates, added for testing purposes)
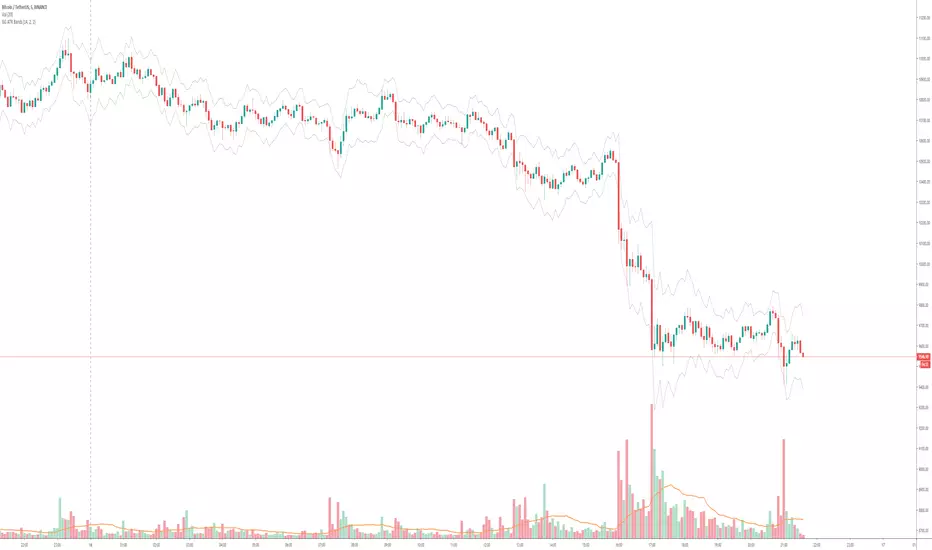
Scott’s volatility histogramATR shows volatility. SMA of ATR measures the average volatility over a chosen look-back period (default 200).
Divergence of ATR and sma is represented as a histogram.
Low periods of volatility are below the zero line. High periods of volatility are above the zero line.
Average volatility over a 200 period look-back is the zero value.

Average True Range with EMAIncreasing and decreasing volatility in respect to ATR crossing an ema of ATR.
Ema acts as a proxy for look-back period as per Historical Volatility Percentile.
ATR is a proxy for Volatility as per standard deviation.
Divergence below ema means low volatility: the more divergence, the lower.
Divergence above the ema means high volatility.

GG ATR bands
ATR plotted above and below price with a multiplier. Defaults to 2x ATR. Makes it easier to use ATR for stop or take profit.
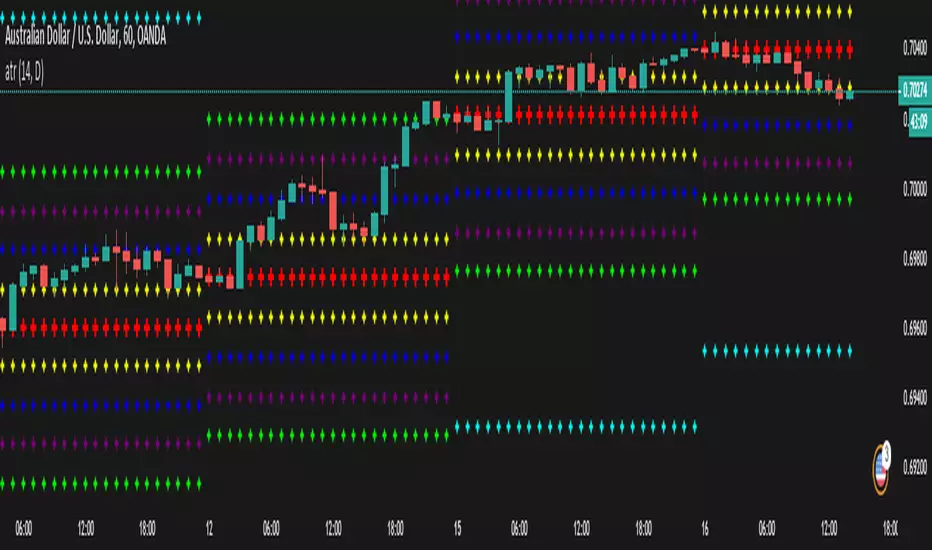
ATR LevelsThis is a script request by trader emma that calculates atr and plots the appropriate levels based on the multiplier

erasei's Swing Points with ATRA simple indicator to overlay high and low swing points with the ATR at each point to quickly see an ATR-based stop.

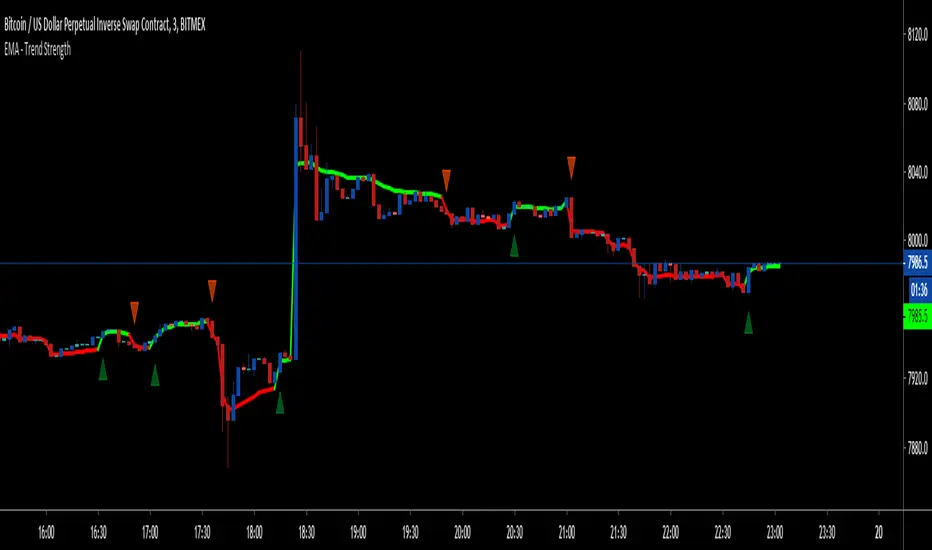
EMA - Trend Strength - 1m ScalperThis is a very special script based on volume, supertrend and ATR which works successfully on a 1m chart for bitmex.
ETH/USD
LTCM19
XRPM19
EOSM19
ADAM19
BCHM19
*private use only
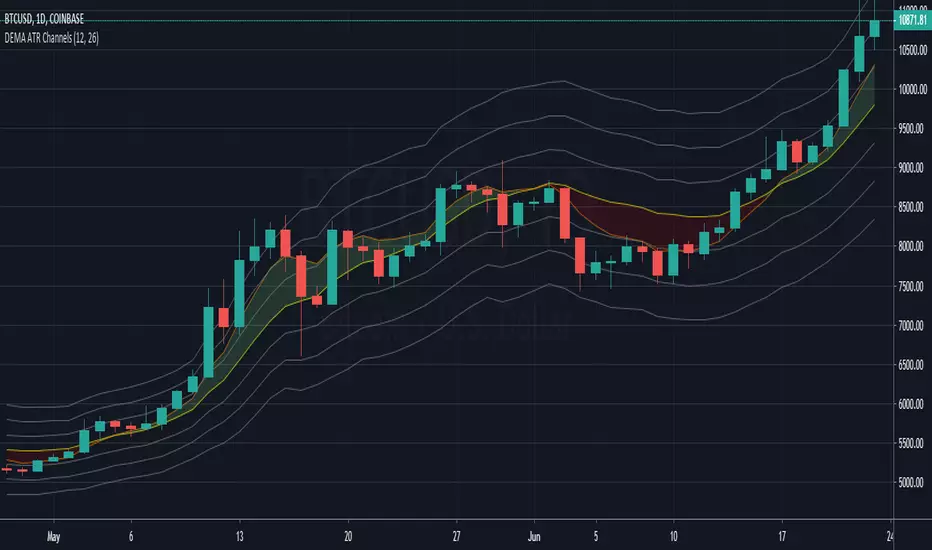
DEMA ATR Channels - New IndicatorA Double Exponential Moving Average (DEMA) with three sets of channel lines each one Average True Range (ATR) apart, above and below the DEMA.
Similar to my "ATR Channels" indicator, but using a DEMA instead of an EMA for the base. In addition, this indicator also plots a fast DEMA as well as a fill between the two. Fully customizable, you can toggle both DEMAs, the fill, and each set of ATR Channels.
ATR channel idea from Kerry Lovvorn as mentioned in Elder's "New Trading for a Living", page 93: "Kerry Lovvorn likes to plot 3 sets of lines around a moving average: at one, two, and three ATRs above and below an EMA . These can be used for setting up entry points and stops, as well as profit targets."