Liquidity Trap Detector (LTD)The Liquidity Trap Detector is an advanced trading tool designed to identify liquidity zones and potential traps set by institutional players. It provides traders with a comprehensive framework to align with smart money movements, helping them avoid common retail pitfalls such as bull and bear traps.
The indicator focuses on detecting liquidity sweeps, breaker blocks, and areas of institutional accumulation/distribution. It integrates multiple technical analysis methods to offer high-probability signals and insights into how liquidity dynamics unfold in the market.
Note : This indicator is not designed for beginners; it is intended for traders who already have a solid understanding of trading fundamentals. It is tailored for individuals who are familiar with concepts like liquidity, order blocks, and traps. Traders with at least 6 months to 1 year of trading experience will fully appreciate the power and potential of this indicator, as they will have the necessary knowledge to leverage its features effectively. Beginners may find it challenging to grasp the advanced concepts embedded in this tool.
Why Combine These Elements?
The components of the Liquidity Trap Detector are carefully chosen to address the core challenges of identifying institutional activity and liquidity traps. Here’s why each element is included and how they work together:
1. Order Blocks:
• Purpose: Identify zones where large institutional players accumulate or distribute positions.
• Role in the Indicator: These zones act as primary liquidity areas, where price is likely to reverse or consolidate due to significant order flow.
2. Breaker Blocks:
• Purpose: Highlight areas where liquidity has been swept, leading to potential price reversals or continuations.
• Role in the Indicator: Confirms whether a liquidity trap has occurred and provides actionable levels for entry or exit.
3. ATR-Based Volatility Zones:
• Purpose: Filter signals based on market volatility to ensure trades align with statistically significant price movements.
• Role in the Indicator: Defines dynamic support and resistance zones, improving the accuracy of signal generation.
4. Volume Delta:
• Purpose: Measure the imbalance between aggressive buyers and sellers, often indicating institutional activity.
• Role in the Indicator: Validates whether a liquidity trap is backed by smart money absorption or retail-driven momentum.
5. Trend Confirmation (EMA):
• Purpose: Align liquidity trap signals with the broader market trend, reducing false positives.
• Role in the Indicator: Ensures trades are executed in the direction of the prevailing trend.
What Makes It Unique?
1. Gen 1 Liquidity Zones and Traps:
• The indicator identifies Gen 1 Liquidity Zones, which represent the first areas where liquidity is accumulated or swept. While these zones often lead to reversals, they can sometimes fail, resulting in continuation moves. The indicator highlights these scenarios, helping traders adapt.
• For example, a bull trap identified in a Gen 1 Zone may see price move higher after an initial red candle, completing a secondary liquidity sweep before reversing.
2. Multi-Layer Signal Validation:
• Signals are only generated when liquidity, volume, trend, and volatility align. This ensures high-probability setups and reduces noise in choppy markets.
3. Dynamic Adaptability:
• ATR-based zones and volume delta filtering allow the indicator to adapt to different market conditions, from trending to range-bound environments.
4. Institutional Insights:
• By focusing on liquidity sweeps, order blocks, and volume imbalances, the indicator helps traders align with institutional strategies rather than retail behavior.
How It Works
The Liquidity Trap Detector uses a step-by-step process to identify and validate liquidity traps:
1. Identifying Liquidity Zones:
• Order Blocks: Mark key zones of institutional activity where price is likely to reverse.
• Breaker Blocks: Highlight areas where liquidity sweeps have occurred, signaling potential traps.
2. Filtering with Volatility (ATR):
• ATR defines dynamic support and resistance zones, ensuring signals are only generated near significant price levels.
3. Validating Traps with Volume Delta:
• Volume delta shows whether liquidity sweeps are backed by aggressive buying/selling from institutions, confirming the trap’s validity.
4. Aligning with Market Trends:
• EMA ensures signals align with the broader trend to reduce false positives.
5. Monitoring Gen 1 Liquidity Zones:
• The indicator highlights Gen 1 Liquidity Zones where price may initially reverse or sweep further before a true reversal. Traders are alerted to potential continuation scenarios if volume or momentum suggests unmet liquidity above/below the zone.
How to Use It
Buy Signal:
• Triggered when:
• Price sweeps below an order block and forms a breaker block, indicating a liquidity trap.
• Volume delta confirms aggressive selling absorption.
• ATR volatility zone supports the reversal.
• EMA confirms a bullish trend.
• Action: Enter a Buy trade and set:
• Stop Loss (SL): Below the order block.
• Take Profit (TP): Near the next resistance or liquidity zone.
Sell Signal:
• Triggered when:
• Price sweeps above an order block and forms a breaker block, indicating a liquidity trap.
• Volume delta confirms aggressive buying absorption.
• ATR volatility zone supports the reversal.
• EMA confirms a bearish trend.
• Action: Enter a Sell trade and set:
• SL: Above the order block.
• TP: Near the next support or liquidity zone.
Timeframes:
• Best suited for scalping and intraday trading on lower timeframes (5m, 15m, 1H).
• Can also be applied to swing trading on higher timeframes.
Example Scenarios:
1. Bull Trap in a Gen 1 Zone:
• Price sweeps above a resistance order block, forms a breaker block, and reverses sharply. However, if momentum persists, price may continue higher after a minor pullback. The indicator helps traders anticipate this by monitoring volume and trend shifts.
2. Bear Trap with Secondary Sweep:
• Price sweeps below a support order block but fails to reverse immediately, instead forming a secondary liquidity sweep before turning bullish. The indicator highlights both scenarios, allowing for flexible trade management.
Why Use It?
The Liquidity Trap Detector offers:
1. Precision: Combines multiple filters to identify institutional liquidity traps with high accuracy.
2. Adaptability: Works across trending and range-bound markets.
3. Smart Money Alignment: Helps traders avoid retail traps by focusing on liquidity sweeps and institutional behavior.
Average True Range (ATR)
P T Supertrend CustomPT Supertrend Custom Indicator Description
The PT Supertrend Custom indicator is a dual Supertrend-based tool designed to help traders identify market trends and potential reversals with enhanced accuracy. This custom indicator plots two Supertrend lines with different ATR (Average True Range) lengths and multipliers, providing a broader perspective on price movements across varying market conditions.
Key Features:
1. Dual Supertrend Lines:
- The indicator calculates two separate Supertrend values using customizable ATR lengths (default: 7 and 21) and factors (default: 3.0 for both).
- This dual-layered approach helps identify both short-term and long-term trends for better decision-making.
2. Customizable Parameters:
- ATR Length (ATR Length & ATR Length2): Determines the lookback period for volatility calculation.
- Factor (Factor & Factor2): Defines the multiplier for the ATR, controlling the sensitivity of the Supertrend lines.
3. Visual Trend Representation:
- Green and red line plots represent uptrends and downtrends, respectively.
- The indicator overlays on the price chart, offering a clear visual representation of trend direction.
- Trend fill areas provide additional clarity, with green shading for uptrends and red shading for downtrends.
4. Dynamic Trend Shifts:
- The indicator adapts dynamically based on price action, switching from an uptrend to a downtrend and vice versa when conditions change.
- Two independent trend signals allow traders to compare short-term and long-term trend confirmations.
5. Overlay on Price Chart:
- The indicator is plotted directly on the price chart for easy visualization without cluttering the workspace.
How to Use:
- Trend Identification:
- A green Supertrend line below price indicates an uptrend.
- A red Supertrend line above price signals a downtrend.
- When both Supertrends align, it indicates a strong trend; divergence may signal potential reversals.
- Entry & Exit Signals:
- Consider long positions when both Supertrend lines turn green.
- Consider short positions when both Supertrend lines turn red.
- Use the shorter ATR period for quicker entries and exits, while the longer ATR period provides confirmation.
- Risk Management:
- The Supertrend lines can serve as dynamic support/resistance levels for placing stop-loss orders.
Best Used In:
- Trend-following strategies
- Swing trading and day trading
- Volatile markets where ATR-based signals are effective
This indicator provides a comprehensive view of market trends by combining short- and long-term trend filters, making it a valuable tool for traders seeking precision and clarity in their trading decisions.
Created by Prince Thomas

Uptrick: Zero Lag HMA Trend Suite1. Name and Purpose
Uptrick: Zero Lag HMA Trend Suite is a Pine Version 6 script that builds upon the Hull Moving Average (HMA) to offer an advanced trend analysis tool. Its purpose is to help traders identify trend direction, potential reversals, and overall market momentum with reduced lag compared to traditional moving averages. By combining the HMA with Average True Range (ATR) thresholds, slope-dependent coloring, Volume Weighted Average Price (VWAP) ribbons, and optional reversal signals, the script aims to give a detailed view of price activity in various market environments.
2. Overview
This script begins with the calculation of a Hull Moving Average, a method that blends Weighted Moving Averages in a way designed to cut down on lag while still smoothing out price fluctuations. Next, several enhancements are applied. The script compares current HMA values to previous ones for slope-based coloring, which highlights uptrends and downtrends at a glance. It also plots buy and sell signals when price moves beyond or below thresholds determined by the ATR and the user’s chosen signal multiplier. An optional VWAP ribbon can be shown to confirm bullish or bearish conditions relative to a volume-weighted benchmark. Additionally, the script can plot reversal signals (labeled with B) at points where price crosses back toward the HMA from above or below. Taken together, these elements allow traders to visualize both the short-term momentum and the broader context of how price interacts with volatility and overall market direction.
3. Why These Indicators Have Been Linked Together
The reason the Hull Moving Average, the Average True Range, and the VWAP have been integrated into one script is to tackle multiple facets of market analysis in a single tool. The Zero Lag Hull Moving Average provides a responsive trend line, the ATR offers a measure of volatility that helps distinguish significant price shifts from typical fluctuations, and the VWAP acts as a reference for fair value based on traded volume. By layering all three, the script helps traders avoid the need to juggle multiple separate indicators and offers a holistic perspective. The slope-based coloring focuses on trend direction, the ATR-based thresholds refine possible buy and sell zones, and the VWAP ribbons provide insight into how price stands relative to an important volume-weighted level. The inclusion of up and down signals and reversal B labels further refines entries and exits.
4. Why Use Uptrick: Zero Lag HMA Trend Suite
The Hull Moving Average is already known for reacting more quickly to price changes compared to other moving averages while retaining a degree of smoothness. This suite enhances the basic HMA by showing colored gradients that make it easy to spot trend direction changes, highlighting potential entry or exit points based on volatility-driven thresholds, and optionally layering a volume-based measure of bullish or bearish market sentiment. By relying on a zero lag approach and additional data points, the script caters to those wanting a more responsive method of identifying shifts in market dynamics. The added reversal signals and up or down alerts give traders extra confirmation for potential turning points.
5. How This Extension Improves on the Basic HMA
This extension not only plots the Hull Moving Average but also includes data-driven alerts and visual cues that traditional HMA lines do not provide. First, it offers multi-layered slope coloring, making up or down trends quickly apparent. Second, it uses ATR-based thresholds to pinpoint moments when price may be extending beyond normal volatility, thus generating buy or sell signals. Third, the script introduces an optional VWAP ribbon to indicate whether the market is trading above or below this pivotal volume-weighted benchmark, adding a further confirmation step for bullish or bearish conditions. Finally, it incorporates optional reversal signals labeled with B, indicating points where price might swing back toward the main HMA line.
6. Core Components
The script can be broken down into several primary functions and features.
a. Zero Lag HMA Calculation
Uses two Weighted Moving Averages (half-length and full-length) combined through a smoothing step based on the square root of the chosen length. This approach is designed to reduce lag significantly compared to other moving averages.
b. Slope Detection
Compares current and prior HMA values to determine if the trend is up or down. The slope-based coloring changes between turquoise shades for upward movement and magenta shades for downward movement, making trend direction immediately visible.
c. ATR-Based Thresholding for Up and Down Signals
The script calculates an Average True Range over a user-defined period, then multiplies it by a signal factor to form two bands around the HMA. When price crosses below the lower band, an up (buy) signal appears; when it crosses above the upper band, a down (sell) signal is shown.
d. Reversal Signals (B Labels)
Tracks when price transitions back toward the main HMA from an extreme zone. When enabled, these reversal points are labeled with a B and can help traders see potential turning points or mean-reversion setups.
e. VWAP Bands
An optional Volume Weighted Average Price ribbon that plots above or below the HMA, indicating bullish or bearish conditions relative to a volume-weighted price benchmark. This can also act as a kind of support/ resistance.
7. User Inputs
a. HMA Length
Controls how quickly the moving average responds to price changes. Shorter lengths react faster but can lead to more frequent signals, whereas longer lengths produce smoother lines.
b. Source
Specifies the price input, such as close or an alternative source, for the calculation. This can help align the HMA with specific trading strategies.
c. ATR Length and Signal Multiplier
Defines how the script calculates average volatility and sets thresholds for buy or sell alerts. Adjusting these values can help filter out noise or highlight more aggressive signals.
d. Slope Index
Determines how many bars to look back for detecting slope direction, influencing how sensitive the slope coloring is to small fluctuations.
e. Show Buy and Sell Signals, Reversal Signals, and VWAP
Lets users toggle the display of these features. Turning off certain elements can reduce chart clutter if traders prefer a simpler layout.
8. Calculation Process
The script’s calculation follows a step-by-step approach. It first computes two Weighted Moving Averages of the selected price source, one over half the specified length and one over the full length. It then combines these using 2*wma1 minus wma2 to reduce lag, followed by applying another weighted average using the square root of the length. Simultaneously, it computes the ATR for a user-defined period. By multiplying ATR by the signal multiplier, it establishes upper and lower bands around the HMA, where crossovers generate buy (up) or sell (down) signals. The script can also plot reversal signals (B labels) when price crosses back from these bands in the opposite direction. For the optional VWAP feature, Pine Script’s ta.vwap function is used, and differences between the HMA and VWAP levels determine the color and opacity of the ribbon.
9. Signal Generation and Filtering
The ATR-based thresholds reduce the influence of small, inconsequential price swings. When price falls below the lower band, the script issues an up (buy) signal. If price breaks above the upper band, a down (sell) signal appears. These signals are visible through labels placed near the bars. Reversal signals, labeled with B, can be turned on to help detect when price retraces from an extended area back toward the main HMA line. Traders can disable or enable these signals to match their preferred level of chart detail or risk tolerance.
10. Visualization on the Chart
The Zero HMA Lag Trend Suite aims for visual clarity. The HMA line is plotted multiple times with increasing transparency to create a gradient effect. Turquoise gradients indicate upward slopes, and magenta gradients signify downward slopes. Bar coloring can be configured to align with the slope direction, providing quick insight into current momentum. When enabled, buy or sell labels are placed under or above the bars as price crosses the ATR-defined boundaries. If the reversal option is active, B labels appear around areas where price changes direction. The optional VWAP ribbons form background bands, using distinct coloration to signal whether price is above or below the volume-weighted metric.
11. Market Adaptability
Because the script’s parameters (HMA length, ATR length, signal multiplier, and slope index) are user-configurable, it can adapt to a wide range of markets and timeframes. Intraday traders may prefer a shorter HMA length for quick signals, while swing or position traders might use a longer HMA length to filter out short-lived price changes. The source setting can also be adjusted, allowing for specialized data inputs beyond just close or open values.
12. Risk Management Considerations
The script’s signals and labels are based on past price data and volatility readings, and they do not guarantee profitable outcomes. Sharp market reversals or unforeseen fundamental events can produce false signals. Traders should combine this tool with broader risk management strategies, including stop-loss placement, position sizing, and independent market analyses. The Zero HMA Lag Trend Suite can help highlight potential opportunities, but it should not be relied upon as the sole basis for trade decisions.
13. Combining with Other Tools
Many traders choose to verify signals from the Zero HMA Lag Trend Suite using popular indicators like the Relative Strength Index (RSI), Moving Average Convergence Divergence (MACD), or even simple volume-based metrics to confirm whether a price movement has sufficient momentum. Conventional techniques such as support and resistance levels, chart patterns, or candlestick analysis can also supplement signals generated by the script’s up, down, or reversal B labels.
14. Parameter Customization and Examples
a. Short-Term Day Trading
Using a shorter HMA length (for instance, 9 or 14) and a slightly higher ATR multiplier might provide timely buy and sell signals, though it may also produce more whipsaws in choppy markets.
b. Swing or Position Trading
Selecting a longer HMA length (such as 50 or 100) with a moderate ATR multiplier can help users track more significant and sustained market moves, potentially reducing the effect of minor fluctuations.
c. Multiple Timeframe Blends
Some traders load two versions of the indicator on the same chart, one for short-term signals (with frequent B label reversals) and another for the broader trend direction, aligning entry and exit decisions with the bigger picture.
15. Realistic Expectations
Even though the Hull Moving Average helps minimize lag and the script incorporates volatility-based filters and optional VWAP overlays, it cannot predict future market behavior with complete accuracy. Periods of low liquidity or sudden market shocks can still lead to signals that do not reflect longer-term trends. Frequent parameter review and manual confirmation are advised before executing trades based solely on the script’s outputs.
16. Theoretical Background
The Hull Moving Average formula aims to balance smoothness with reactivity, accomplished by combining Weighted Moving Averages at varying lengths. By subtracting a slower average from a faster one and then applying another smoothing step with the square root of the original length, the HMA is designed to respond more promptly to price changes than typical exponential or simple moving averages. The ATR component, introduced by J. Welles Wilder, calculates the average range of price movement over a user-defined period, allowing the script to assess volatility and adapt signals accordingly. VWAP provides a volume-weighted benchmark that many institutional traders track to gauge fair intraday value.
17. Originality and Uniqueness
Although multiple HMA-based indicators can be found, Uptrick: Zero Lag HMA Trend Suite sets itself apart by merging slope-based coloring, ATR thresholds, VWAP ribbons, up or down labels, and optional reversal signals all in one cohesive platform. This synergy aims to reduce chart clutter while still giving traders a comprehensive look at trend direction, volatility, and volume-based sentiment.
18. Summary
Uptrick: Zero Lag HMA Trend Suite is a specialized trading script designed to highlight potential market trends and reversals with minimal delay. It leverages the Hull Moving Average for an adaptive yet smooth price line, pairs ATR-based thresholds for detecting possible breakouts or dips, and provides VWAP-based ribbons for added volume-weighted context. Traders can further refine their entries and exits by enabling up or down signals and reversal labels (B) where price may revert toward the HMA. Suitable for a wide range of timeframes and instrument types, the script encourages a disciplined approach to trade management and risk control.
19. Disclaimer
This script is provided for informational and educational purposes only. Trading and investing involve significant financial risk, and no indicator can guarantee success under all conditions. Users should practice robust risk management, including the placement of stop losses and position sizing, and should confirm signals with additional analysis tools. The developer of this script assumes no liability for any trading decisions or outcomes resulting from its use.

Composite Indicator (CCI + ATR)Composite Indicator (CCI + ATR)
The Composite Indicator (CCI + ATR) combines the Commodity Channel Index (CCI) with the Average True Range (ATR) , providing traders with a dynamic tool for identifying entry and exit points based on momentum and volatility. This indicator is particularly useful for markets like cryptocurrencies, which often exhibit sharp sell-offs and gradual upward trends.
Key Features
Momentum Analysis with CCI: The CCI calculates price momentum by comparing the current price level to its average over a specific period. The indicator generates signals when CCI crosses predefined thresholds.
- Buy Signal: Triggered when CCI crosses above the lower threshold (e.g., -100).
- Sell Signal: Triggered when CCI crosses below the upper threshold (e.g., +100).
Volatility Filtering with ATR: The ATR measures market volatility, ensuring signals occur only during significant price movements.
Separate multipliers for buy and sell signals allow tailored filtering based on market behavior.
Stop Loss Calculation: Dynamic stop loss levels are calculated using the ATR multiplier to adapt to market volatility, offering better risk management.
How It Works
CCI Calculation: The CCI is calculated using the typical price ((High + Low + Close) / 3) and a user-defined length. It detects momentum changes by measuring deviations from the average price.
ATR Calculation: The ATR determines the average price range over a specified period, identifying the market’s volatility. The ATR SMA acts as a baseline to filter signals.
Buy Signal: A buy signal is triggered when:
- CCI crosses above the lower threshold (e.g., -100).
- ATR exceeds its SMA multiplied by the buy multiplier (e.g., 1.0).
Sell Signal: A sell signal is triggered when:
- CCI crosses below the upper threshold (e.g., +100).
- ATR exceeds its SMA multiplied by the sell multiplier (e.g., 0.95).
Stop Loss Integration:
- Long positions: Stop loss = Low – (ATR * ATR Multiplier)
- Short positions: Stop loss = High + (ATR * ATR Multiplier)
Advantages
Combines momentum (CCI) and volatility (ATR) for precise signal generation.
Customizable thresholds and multipliers for different market conditions.
Dynamic stop loss ensures better risk management in volatile markets.
Suggested Parameter Settings
CCI Length: 20 (default). Adjust as follows:
- 10–15: Shorter timeframes (e.g., 5-15 minutes).
- 20: General use for 1-hour timeframes.
- 30–50: Longer timeframes (e.g., 4-hour or daily charts).
CCI Threshold: 100 (default). Adjust as follows:
- 50–75: For more frequent signals in ranging markets.
- 100: Balanced for most trading conditions.
- 150–200: For strong trends to reduce noise.
ATR Length: 14 (default). Adjust as follows:
- 10–14: For assets with moderate volatility.
- 20: For assets with lower volatility.
ATR Buy Multiplier: 1.0 (default). Adjust as follows:
- 0.9–1.0: For gradual uptrends in crypto markets.
- 1.1–1.2: For stronger trend filtering.
ATR Sell Multiplier: 0.95 (default). Adjust as follows:
- 0.8–0.95: For sharp sell-offs.
- 1.0–1.1: For stable downward trends.
ATR Multiplier (Stop Loss): 1.5 (default). Adjust as follows:
- 1.0–1.2: For shorter timeframes or less volatile markets.
- 2.0–2.5: For highly volatile markets like cryptocurrencies.
Example Use Cases
Scalping (5-15 minute charts): Use CCI Length = 10, CCI Threshold = 75, ATR Buy Multiplier = 0.9, ATR Sell Multiplier = 0.8.
Day Trading (1-hour charts): Use CCI Length = 20, CCI Threshold = 100, ATR Buy Multiplier = 1.0, ATR Sell Multiplier = 0.95.
Swing Trading (4-hour or daily charts): Use CCI Length = 30, CCI Threshold = 150, ATR Buy Multiplier = 1.2, ATR Sell Multiplier = 1.0.
Final Thoughts The Composite Indicator (CCI + ATR) is a versatile tool designed to enhance trading decisions by combining momentum analysis with volatility filtering. Whether scalping or swing trading, this indicator provides actionable insights and robust risk management to navigate complex markets effectively.

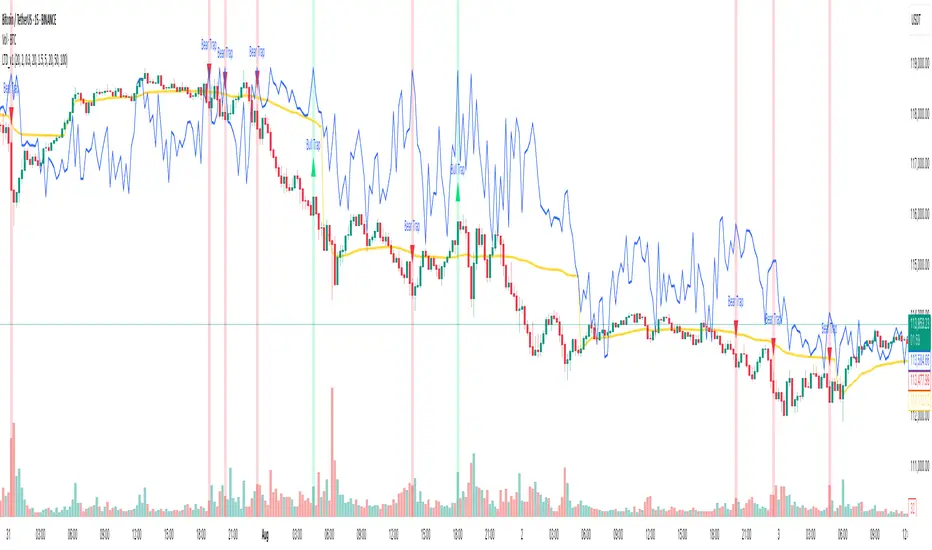
Volume profile [Signals] - By Leviathan [Mindyourbuisness]Market Sessions and Volume Profile with Sweep Signals - Based on Leviathan's Volume Profile
This indicator is an enhanced version of Leviathan's Volume Profile indicator, adding session-based value area analysis and sweep detection signals. It combines volume profile analysis with market structure concepts to identify potential reversal opportunities.
Features
- Session-based volume profiles (Daily, Weekly, Monthly, Quarterly, Yearly)
- Forex sessions support (Tokyo, London, New York)
- Value Area analysis with POC, VAH, and VAL levels
- Extended level visualization for the last completed session
- Sweep detection signals for key value area levels
Sweep Signals Explanation
The indicator detects two types of sweeps at VAH, VAL, and POC levels:
Bearish Sweeps (Red Triangle Down)
Conditions:
- Price makes a high above the level (VAH/VAL/POC)
- Closes below the level
- Closes below the previous candle's low
- Previous candle must be bullish
Trading Implication: Suggests a failed breakout and potential reversal to the downside. These sweeps often indicate stop-loss hunting above key levels followed by institutional selling.
Bullish Sweeps (Green Triangle Up)
Conditions:
- Price makes a low below the level (VAH/VAL/POC)
- Closes above the level
- Closes above the previous candle's high
- Previous candle must be bearish
Trading Implication: Suggests a failed breakdown and potential reversal to the upside. These sweeps often indicate stop-loss hunting below key levels followed by institutional buying.
Trading Guidelines
1. Use sweep signals in conjunction with the overall trend
2. Look for additional confirmation like:
- Volume surge during the sweep
- Price action patterns
- Support/resistance levels
3. Consider the session's volatility and time of day
4. More reliable signals often occur at VAH and VAL levels
5. POC sweeps might indicate stronger reversals due to their significance as fair value levels
Notes
- The indicator works best on higher timeframes (1H and above)
- Sweep signals are more reliable during active market hours
- Consider using multiple timeframe analysis for better confirmation
- Past performance is not indicative of future results
Credits: Original Volume Profile indicator by Leviathan
Risk-Adjusted Trend IndicatorThe Risk-Adjusted Trend Indicator is a comprehensive tool designed to evaluate market trends while factoring in risk levels. By combining trend strength, volatility, and dynamic scaling, this indicator provides traders with clear, actionable signals for optimal entries and exits. Its focus on risk-adjusted metrics ensures that signals are both reliable and contextually informed by prevailing market conditions.
Key Features:
1. Exponential Moving Average (EMA):
• The EMA serves as the foundation for trend detection, offering a smoothed representation of price movement over a user-defined period.
• Aids in distinguishing bullish and bearish trends effectively.
2. Average True Range (ATR):
• ATR is used to gauge market volatility, ensuring that the indicator adapts to changing market conditions.
• Facilitates the normalization of trend strength relative to current market volatility.
3. Risk-Adjusted Trend Score:
• Computes the difference between the price and EMA and normalizes it using the ATR to account for risk.
• This metric allows traders to focus on trends with favorable risk-reward ratios, filtering out weak or high-risk setups.
4. Dynamic Scaling:
• Adjusts the risk-adjusted score to fit within the chart’s price range, making the visualization intuitive and easy to interpret.
5. Buy/Sell Signals:
• Buy signals are triggered when the risk-adjusted score crosses above a positive threshold.
• Sell signals are triggered when the score crosses below a negative threshold.
• Signals are plotted directly on the chart with intuitive markers for quick decision-making.
6. Background Color Zones:
• Highlights bullish and bearish trend zones using subtle background shading, enhancing visual clarity.
Reason for Combining These Elements
The Risk-Adjusted Trend Indicator blends elements of trend analysis, volatility measurement, and risk assessment to address a fundamental challenge in trading: identifying high-confidence trades that align with a trader’s risk tolerance. Here’s why these components were chosen and how they work together:
1. EMA (Trend Detection):
• Provides a reliable baseline for trend direction, ensuring that the indicator aligns with the market’s prevailing trend.
2. ATR (Volatility Normalization):
• Adjusts trend strength calculations based on market volatility, allowing the indicator to adapt to varying market conditions and avoid false signals in high-volatility environments.
3. Risk-Adjusted Score:
• By factoring in both trend strength and volatility, this score ensures that only trends with favorable risk-reward dynamics are highlighted.
• This approach minimizes overtrading and reduces exposure to high-risk setups.
4. Dynamic Scaling:
• Ensures that the indicator’s outputs remain visually accessible, regardless of the asset or timeframe being analyzed.
• Enhances usability by aligning the score with price action on the chart.
5. Visual Aids (Signals and Background Zones):
• The inclusion of visual signals and background zones simplifies decision-making, making the tool suitable for both novice and experienced traders.

Multi-Timeframe Volatility ATR - [by Oberlunar]This script (for now in beta release) is specifically designed for scalping or traders operating on lower timeframes (if you are in a timeframe of one minute wait one minute to collect statistics). Its primary purpose is to provide detailed insights into market volatility by calculating the ATR (Average True Range) and its percentage changes, allowing traders to quickly identify shifts in market conditions.
The ATR is calculated across six user-defined timeframes, which can include very short intervals such as 5 or 15 seconds. This setup enables real-time monitoring of volatility, which is critical for scalping strategies. The script collects a rolling history of the last five ATR values for each timeframe. These historical values are used to calculate percentage changes by comparing the current ATR with the oldest value in the history, offering a clear view of how volatility is evolving over time.
Percentage changes are displayed dynamically in a table, with color-coded feedback to indicate the direction of the change: green for increases, red for decreases, and gray for stability or insufficient data. This visual representation makes it easy to spot whether market volatility is rising or falling at a glance.
By progressively collecting data, the script becomes increasingly effective as more ATR values are accumulated. This functionality is especially useful for traders on lower timeframes, where rapid changes in volatility can signal breakout opportunities or shifts in market dynamics.
Soon I will update personalized ATR parameters, and lookback strategies for statistics.

Improved Trend Shot | JeffreyTimmermansImproved Trend Shot
The "Improved Trend Shot" is an advanced trend-following tool that integrates cutting-edge features and the principles of John Ehlers’ SuperSmoother Filter to provide traders with more accurate trend detection and better decision-making. This enhanced version includes multiple smoothing types, customizable lengths, dynamic alerts, and a comprehensive dashboard to help traders quickly interpret market conditions.
This script is inspired by "TRW" . However, it is more advanced and includes additional features and options.
Key Features and Improvements
Smoothed Lines and Trend Detection
The core of the Improved Smooth Trend Shot relies on three key lines to capture market momentum:
Fast Line: Highly sensitive to short-term price changes, offering rapid responsiveness to market movements.
Middle Line: Provides a medium-term view of market trends, acting as a more stable reference.
Slow Line: Focuses on long-term trends, offering a broader perspective on market direction.
These three smoothed lines interact dynamically to create a visual color-coded cloud that helps traders easily interpret market conditions:
Green Cloud: Indicates an upward trend when the Fast line is above the Slow line.
Red Cloud: Signals a downward trend when the Fast line is below the Slow line.
The cloud color adjusts based on the relative positioning of the Fast, Middle, and Slow lines, helping traders to identify bullish or bearish trends with ease.
Dynamic Cloud Visualization and Alerts
The cloud and trend lines adapt to market conditions, updating in real-time to reflect changes in trend strength and momentum. Traders can also set up real-time alerts to notify them of important trend shifts, such as:
Fast and Slow Crossovers: Alerts when the Fast line crosses the Slow line.
Middle and Slow Crossovers: Alerts when the Middle line crosses the Slow line.
This makes it easier to capture trading opportunities and respond promptly to market changes.
Enhanced Smoothing Options
Traders can now choose from multiple smoothing types, including:
EMA (Exponential Moving Average)
SMA (Simple Moving Average)
DEMA (Double Exponential Moving Average)
WMA (Weighted Moving Average)
Each smoothing type has different properties, allowing traders to select the best fit for their trading style. The smoothing length can also be customized, offering flexibility in fine-tuning how sensitive or stable the trend lines should be.
Improved Signal Logic and Precision
The signal logic has been optimized for better precision. Now, the system provides more accurate buy and sell alerts based on:
Trend Detection: The color-coded cloud and the relative positions of the Fast, Middle, and Slow lines help visualize whether the trend is bullish or bearish.
Rising and Falling Indicators: The indicator also checks if each line is rising or falling over the last three bars, offering early signals of momentum shifts.
Dashboard Insights
The dashboard provides real-time updates on the positions and movements of the smoothed lines:
Line Positions: Displays the positions of the Fast, Middle, and Slow lines.
Trend Direction: Shows whether each line is rising or falling.
Price Levels: Displays the price levels for each of the smoothed lines, offering clear reference points for market evaluation.
These features help traders better understand the state of the market, offering valuable insights for both trend-following and reversal-based strategies.
Crossovers and Signal Triggers
The Improved Smooth Trend Shot focuses on crossovers between the different smoothed lines as primary trading signals. There are two types of crossovers:
Fast Shots: This occurs when the Fast line crosses the Slow line.
Slow Shots: This occurs when the Middle line crosses the Slow line.
These crossovers serve as key entry or exit points for traders, helping them spot potential trend reversals. The improved logic ensures that crossovers are accurately detected, reducing the chances of false signals.
Customization Options
The Improved Smooth Trend Shot offers a high degree of customization:
Smoothing Length: Adjust the smoothing period to balance between fast responses and stable trends.
Source Selection: Default to the average of high and low prices (hl2), or choose other price sources.
Smoothing Type: Select from EMA, SMA, DEMA, or WMA for personalized trend analysis.
Signal Type: Choose between Fast Shots or Slow Shots based on the type of crossover you want to focus on.
Long, Medium, and Short-Term Applications
Although the default settings are optimized for long-term trend analysis, the Improved Smooth Trend Shot is highly adaptable. By adjusting the smoothing length and selecting different smoothing types, traders can use the tool for:
Short-Term Trading: Focus on fast responses to market shifts using shorter smoothing periods.
Medium-Term Trading: Tailor the settings to capture intermediate trends.
Long-Term Trend Analysis: Use longer smoothing periods for a more stable and comprehensive view of market dynamics.
Advanced ATR Filtering and Alerts
The inclusion of ATR (Average True Range) filtering helps ensure that signals are triggered only when significant price movements occur. This helps reduce noise and false signals, ensuring traders only act on meaningful market shifts.
Conclusion
The Improved Smooth Trend Shot is a powerful and versatile tool that enhances the original SuperSmoother Filter with advanced features like customizable smoothing options, real-time alerts, and an intuitive dashboard. Whether you're a day trader, swing trader, or long-term investor, this enhanced indicator provides a comprehensive and actionable view of market trends.
The combination of enhanced signal accuracy, dynamic trend visualization, and in-depth customization ensures that the Improved Smooth Trend Shot is an indispensable tool for traders across all market conditions.
-Jeffrey

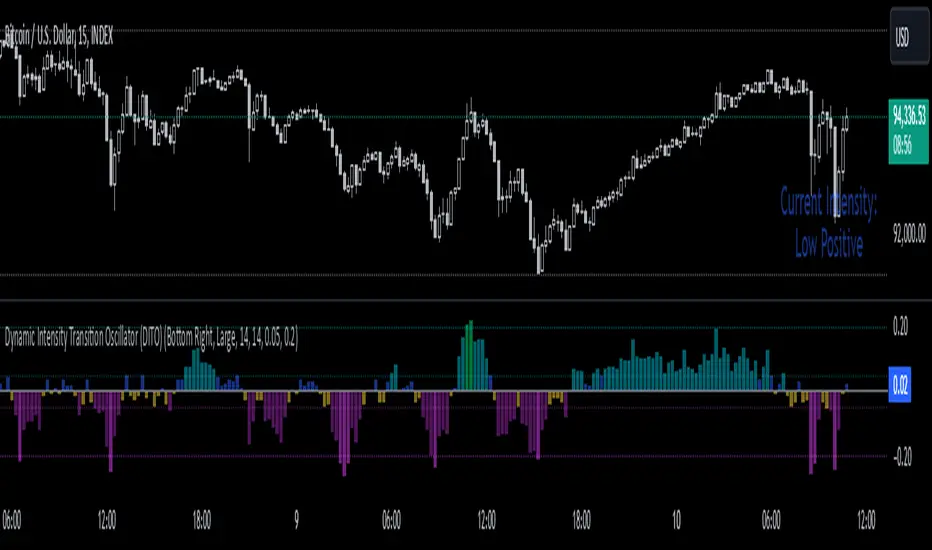
Dynamic Intensity Transition Oscillator (DITO)The Dynamic Intensity Transition Oscillator (DITO) is a comprehensive indicator designed to identify and visualize the slope of price action normalized by volatility, enabling consistent comparisons across different assets. This indicator calculates and categorizes the intensity of price movement into six states—three positive and three negative—while providing visual cues and alerts for state transitions.
Components and Functionality
1. Slope Calculation
- The slope represents the rate of change in price action over a specified period (Slope Calculation Period).
- It is calculated as the difference between the current price and the simple moving average (SMA) of the price, divided by the length of the period.
2. Normalization Using ATR
- To standardize the slope across assets with different price scales and volatilities, the slope is divided by the Average True Range (ATR).
- The ATR ensures that the slope is comparable across assets with varying price levels and volatility.
3. Intensity Levels
- The normalized slope is categorized into six distinct intensity levels:
High Positive: Strong upward momentum.
Medium Positive: Moderate upward momentum.
Low Positive: Weak upward movement or consolidation.
Low Negative: Weak downward movement or consolidation.
Medium Negative: Moderate downward momentum.
High Negative: Strong downward momentum.
4. Visual Representation
- The oscillator is displayed as a histogram, with each intensity level represented by a unique color:
High Positive: Lime green.
Medium Positive: Aqua.
Low Positive: Blue.
Low Negative: Yellow.
Medium Negative: Purple.
High Negative: Fuchsia.
Threshold levels (Low Intensity, Medium Intensity) are plotted as horizontal dotted lines for visual reference, with separate colors for positive and negative thresholds.
5. Intensity Table
- A dynamic table is displayed on the chart to show the current intensity level.
- The table's text color matches the intensity level color for easy interpretation, and its size and position are customizable.
6. Alerts for State Transitions
- The indicator includes a robust alerting system that triggers when the intensity level transitions from one state to another (e.g., from "Medium Positive" to "High Positive").
- The alert includes both the previous and current states for clarity.
Inputs and Customization
The DITO indicator offers a variety of customizable settings:
Indicator Parameters
Slope Calculation Period: Defines the period over which the slope is calculated.
ATR Calculation Period: Defines the period for the ATR used in normalization.
Low Intensity Threshold: Threshold for categorizing weak momentum.
Medium Intensity Threshold: Threshold for categorizing moderate momentum.
Intensity Table Settings
Table Position: Allows you to position the intensity table anywhere on the chart (e.g., "Bottom Right," "Top Left").
Table Size: Enables customization of table text size (e.g., "Small," "Large").
Use Cases
Trend Identification:
- Quickly assess the strength and direction of price movement with color-coded intensity levels.
Cross-Asset Comparisons:
- Use the normalized slope to compare momentum across different assets, regardless of price scale or volatility.
Dynamic Alerts:
- Receive timely alerts when the intensity transitions, helping you act on significant momentum changes.
Consolidation Detection:
- Identify periods of low intensity, signaling potential reversals or breakout opportunities.
How to Use
- Add the indicator to your chart.
- Configure the input parameters to align with your trading strategy.
Observe:
The Oscillator: Use the color-coded histogram to monitor price action intensity.
The Intensity Table: Track the current intensity level dynamically.
Alerts: Respond to state transitions as notified by the alerts.
Final Notes
The Dynamic Intensity Transition Oscillator (DITO) combines trend strength detection, cross-asset comparability, and real-time alerts to offer traders an insightful tool for analyzing market conditions. Its user-friendly visualization and comprehensive alerting make it suitable for both novice and advanced traders.
Disclaimer: This indicator is for educational purposes and is not financial advice. Always perform your own analysis before making trading decisions.
DAILY ATR LEVELS AND EXPECTED MOVE LEVELSThis Pine Script code is designed to visualize ATR (Average True Range) levels and expected move levels on a chart. It provides useful inputs for customizing how these levels are displayed, such as line width, style, and color. The script is divided into several sections, each focused on a different feature:
1. User Inputs for Customization:
- Line Width and Style: Users can customize the line width, style (solid, dotted, or dashed), and color for various levels.
- Offset for Line Placement: The rightOffset input controls how far in the future the lines extend (measured in minutes).
- Show Labels: Labels can be toggled on/off for ATR levels and expected move lines, with customizable text colors.
2. ATR Levels and ATR Settings:
- The ATR length (atrLength) and the multiplier (atrMultiplier) control the calculation of ATR levels.
- The script plots ATR levels based on the daily open price, including key levels like ATR +25%, ATR +50%, etc., for both positive and negative movements.
- Line Drawing: The script dynamically creates lines for each ATR level, and the lines are customized according to the user's inputs. For each level, the line.new function is used to plot a line from the start of the day (daily open) to a point offset in the future.
- Labels: Labels are added near each ATR level to make them more identifiable, such as "ATR +25%" or "Daily Open."
3. Expected Move Calculation and Logic:
- The script calculates the expected move for the next trading session based on the previous close price and the volatility derived from the VIX (Volatility Index).
- The expected move is calculated as a percentage of the previous close and is added and subtracted from the previous close price to generate upper and lower levels.
- Volatility Adjustment: The VIX value is adjusted by the square root of 252 (the number of average trading days in a year) to calculate the daily volatility.
- Upper and Lower Lines: Lines are drawn for the expected move's upper and lower bounds, showing the potential price movement based on volatility.
4. Customizable Expected Move Lines:
- Line Style and Color: The upper and lower expected move lines can be customized in terms of width, style, and color, as specified by the user.
- Labels for Expected Move Levels: Labels are added for the upper and lower expected move lines, such as "Expected Move Upper" and "Expected Move Lower."
5. Logic for Drawing Lines:
- The script continuously evaluates whether the levels should be displayed based on the user's preferences.
- If showATRLevels or showLineEM is enabled, the script will draw the respective lines and labels on the chart.
- It uses line.new to draw the lines and label.new to position the labels at the correct levels on the chart.
6. Handling Time and Line Deletion:
- The script handles the dynamic nature of the chart by deleting previous lines (using line.delete) to avoid cluttering the chart with outdated lines.
- The time for the lines is set dynamically using the startTime and endTime variables, ensuring that lines are drawn within the correct timeframe.
Summary of Key Features:
- ATR Levels: Plots key levels of ATR, such as daily open, ATR +25%, ATR -25%, etc., with customizable colors and line styles.
- Expected Move Levels: Calculates and plots the upper and lower bounds of the expected move based on the VIX and previous close price.
- Customization Options: Users can control the appearance (line width, style, color) and whether to show labels for the ATR and expected move levels.
- Dynamic Updates: The lines and labels update dynamically throughout the trading day, adjusting based on market conditions.
Overall, this script is designed to help traders visualize volatility and potential price movement on a daily chart by providing ATR-based levels and expected move projections. It offers a high degree of customization to suit different charting preferences.

ADR Table BY @ICT_YEROADR Table BY @ICT_YERO
Created by: @ICT_YERO
This custom indicator is designed to provide the Average Daily Range (ADR) for multiple timeframes, including Daily, 4-Hour, and 1-Hour. The indicator is tailored to assist traders in understanding price volatility and making informed trading decisions.
Key Features
Multi-Timeframe ADR Calculation:
Automatically calculates and displays the ADR for Daily, 4-Hour, and 1-Hour timeframes.
Helps traders identify potential price movement ranges for different trading sessions.
Dynamic Range Visualization:
Clear visual representation of the ADR on the chart, making it easy to spot price extremes.
Real-time updates to reflect changes in price movement.
Custom Alerts:
Option to set alerts when the price approaches the ADR high or low.
Useful for identifying potential reversal zones or breakout opportunities.
User-Friendly Interface:
Simple and intuitive settings to customize colors, levels, and display preferences.
Seamlessly integrates with your existing TradingView setup.
ICT-Inspired Methodology:
Designed for traders who follow ICT concepts, focusing on precision and high-probability setups.
Applications
Range Trading: Helps determine the high and low boundaries for scalping or intraday setups.
Volatility Analysis: Understand market behavior during different times of the day or week.
Reversal Zones: Identify areas where price is likely to reverse, based on ADR extremes.
Whether you're a scalper, day trader, or swing trader, this indicator provides a comprehensive overview of price volatility across multiple timeframes, making it an essential tool for your trading arsenal.

DAILY ATR LEVELSThis script is a custom technical indicator for use in TradingView, designed to display daily Average True Range (ATR) levels on the chart, along with the daily opening price. It provides a customizable way to track price levels relative to the daily ATR, which can be useful for traders looking for volatility-based price targets or ranges.
///////////////////////////////////////////////////////////////////////////////////////////////////////////////////////////////////////////////////////
Customization Options:
- Line Width: Determines the thickness of the plotted lines for the ATR levels and daily open line, ranging from 1 to 10.
- Right Offset (minutes): A time offset (in minutes) that shifts the end of the daily opening price line to the right for visual clarity.
- Line Style: The user can choose between solid, dashed, or dotted lines for all the plotted levels.
- Display Options: Users can toggle the visibility of the daily opening price line (showDayLevel), labels (showLabels), and ATR levels (showATRLevels).
- Colors: Customizable colors for the daily opening price line (dayLevelColor), labels (labelTextColor), and the ATR levels for both positive and negative values (atrLevelPlusColor and atrLevelMinusColor).
ATR Settings:
- ATR Length: Defines the number of periods (bars) to use when calculating the ATR. The default is 180, which corresponds to the ATR calculated on the daily chart using the last 180 bars.
- ATR Multiplier: Allows the user to scale the ATR levels by a multiplier (from 0.1 to 5.0), adjusting the sensitivity of the levels.
- ATR Levels: Users can toggle visibility for several predefined ATR levels, such as +25%, +50%, +75%, +100%, -25%, -50%, -75%, and -100%. These levels represent price points above or below the daily open based on the ATR.
///////////////////////////////////////////////////////////////////////////////////////////////////////////////////////////////////////////////////////
ATR Levels Calculation:
- The ATR is calculated based on the daily chart using the ta.atr() function with the specified ATR length, default is set at 180.
- The script computes multiple ATR levels above and below the daily open price, adjusting each level by 25%, 50%, 75%, and 100% of the ATR value (scaled by the ATR multiplier).
ATR Level Plotting:
- For each ATR level (positive and negative), a line is drawn across the chart at the corresponding price level.
- The color, line style, and width of these lines can be customized.
- Each ATR level also has an optional label showing the percentage level (e.g., "ATR +25%") at the specified price, which is positioned at the end of the line.
- The labels are removed from the previous bars to avoid clutter.
Workflow:
- The script first calculates the daily opening price using the request.security() function to pull the open price from the daily chart.
- It then calculates the ATR based on the selected length and multiplier.
- The start time for the daily open line is determined by the bar's timestamp at the start of the day, and the end time is adjusted using the user-defined right offset.
- After determining the relevant price levels (for the opening price and ATR levels), the script plots these levels on the chart as lines. It handles the drawing and deletion of lines to ensure that the chart remains updated in real time.
- If labels are enabled, text labels are displayed next to the ATR levels and the daily open line, providing clear markers for the user.
Practical Use:
- Volatility Analysis: This indicator is useful for identifying key price levels based on daily volatility (ATR). Traders can use it to set potential targets or support/resistance levels that are adjusted for volatility.
- Day Trading or Swing Trading: The daily opening price line helps traders quickly see where the price opened for the day, and the ATR levels give a dynamic range for the day's potential price movement.
Overall, this script is designed to provide a clear, customizable view of daily price levels in relation to the ATR, helping traders make informed decisions based on volatility and price action.

AI InfinityAI Infinity – Multidimensional Market Analysis
Overview
The AI Infinity indicator combines multiple analysis tools into a single solution. Alongside dynamic candle coloring based on MACD and Stochastic signals, it features Alligator lines, several RSI lines (including glow effects), and optionally enabled EMAs (20/50, 100, and 200). Every module is individually configurable, allowing traders to tailor the indicator to their personal style and strategy.
Important Note (Disclaimer)
This indicator is provided for educational and informational purposes only.
It does not constitute financial or investment advice and offers no guarantee of profit.
Each trader is responsible for their own trading decisions.
Past performance does not guarantee future results.
Please review the settings thoroughly and adjust them to your personal risk profile; consider supplementary analyses or professional guidance where appropriate.
Functionality & Components
1. Candle Coloring (MACD & Stochastic)
Objective: Provide an immediate visual snapshot of the market’s condition.
Details:
MACD Signal: Used to identify bullish and bearish momentum.
Stochastic: Detects overbought and oversold zones.
Color Modes: Offers both a simple (two-color) mode and a gradient mode.
2. Alligator Lines
Objective: Assist with trend analysis and determining the market’s current phase.
Details:
Dynamic SMMA Lines (Jaw, Teeth, Lips) that adjust based on volatility and market conditions.
Multiple Lengths: Each element uses a separate smoothing period (13, 8, 5).
Transparency: You can show or hide each line independently.
3. RSI Lines & Glow Effects
Objective: Display the RSI values directly on the price chart so critical levels (e.g., 20, 50, 80) remain visible at a glance.
Details:
RSI Scaling: The RSI is plotted in the chart window, eliminating the need to switch panels.
Dynamic Transparency: A pulse effect indicates when the RSI is near critical thresholds.
Glow Mode: Choose between “Direct Glow” or “Dynamic Transparency” (based on ATR distance).
Custom RSI Length: Freely adjustable (default is 14).
4. Optional EMAs (20/50, 100, 200)
Objective: Utilize moving averages for trend assessment and identifying potential support/resistance areas.
Details:
20/50 EMA: Select which one to display via a dropdown menu.
100 EMA & 200 EMA: Independently enabled.
Color Logic: Automatically green (price > EMA) or red (price < EMA). Each EMA’s up/down color is customizable.
Configuration Options
Candle Coloring:
Choose between Gradient or Simple mode.
Adjust the color scheme for bullish/bearish candles.
Transparency is dynamically based on candle body size and Stochastic state.
Alligator Lines:
Toggle each line (Jaw/Teeth/Lips) on or off.
Select individual colors for each line.
RSI Section:
RSI Length can be set as desired.
RSI lines (0, 20, 50, 80, 100) with user-defined colors and transparency (pulse effect).
Additional lines (e.g., RSI 40/60) are also available.
Glow Effects:
Switch between “Dynamic Transparency” (ATR-based) and “Direct Glow”.
Independently applied to the RSI 100 and RSI 0 lines.
EMAs (20/50, 100, 200):
Activate each one as needed.
Each EMA’s up/down color can be customized.
Example Use Cases
Trend Identification:
Enable Alligator lines to gauge general trend direction through SMMA signals.
Timing:
Watch the Candle Colors to spot potential overbought or oversold conditions.
Fine-Tuning:
Utilize the RSI lines to closely monitor important thresholds (50 as a trend barometer, 80/20 as possible reversal zones).
Filtering:
Enable a 50 EMA to quickly see if the market is trading above (bullish) or below (bearish) it.

Uptrick: Volatility Reversion BandsUptrick: Volatility Reversion Bands is an indicator designed to help traders identify potential reversal points in the market by combining volatility and momentum analysis within one comprehensive framework. It calculates dynamic bands around a simple moving average and issues signals when price interacts with these bands. Below is a fully expanded description, structured in multiple sections, detailing originality, usefulness, uniqueness, and the purpose behind blending standard deviation-based and ATR-based concepts. All references to code have been removed to focus on the written explanation only.
Section 1: Overview
Uptrick: Volatility Reversion Bands centers on a moving average around which various bands are constructed. These bands respond to changes in price volatility and can help gauge potential overbought or oversold conditions. Signals occur when the price moves beyond certain thresholds, which may imply a reversal or significant momentum shift.
Section 2: Originality, Usefulness, Uniqness, Purpose
This indicator merges two distinct volatility measurements—Bollinger Bands and ATR—into one cohesive system. Bollinger Bands use standard deviation around a moving average, offering a baseline for what is statistically “normal” price movement relative to a recent mean. When price hovers near the upper band, it may indicate overbought conditions, whereas price near the lower band suggests oversold conditions. This straightforward construction often proves invaluable in moderate-volatility settings, as it pinpoints likely turning points and gauges a market’s typical trading range.
Yet Bollinger Bands alone can falter in conditions marked by abrupt volatility spikes or sudden gaps that deviate from recent norms. Intraday news, earnings releases, or macroeconomic data can alter market behavior so swiftly that standard-deviation bands do not keep pace. This is where ATR (Average True Range) adds an important layer. ATR tracks recent highs, lows, and potential gaps to produce a dynamic gauge of how much price is truly moving from bar to bar. In quieter times, ATR contracts, reflecting subdued market activity. In fast-moving markets, ATR expands, exposing heightened volatility on each new bar.
By overlaying Bollinger Bands and ATR-based calculations, the indicator achieves a broader situational awareness. Bollinger Bands excel at highlighting relative overbought or oversold areas tied to an established average. ATR simultaneously scales up or down based on real-time market swings, signaling whether conditions are calm or turbulent. When combined, this means a price that barely crosses the Bollinger Band but also triggers a high ATR-based threshold is likely experiencing a volatility surge that goes beyond typical market fluctuations. Conversely, a price breach of a Bollinger Band when ATR remains low may still warrant attention, but not necessarily the same urgency as in a high-volatility regime.
The resulting synergy offers balanced, context-rich signals. In a strong trend, the ATR layer helps confirm whether an apparent price breakout really has momentum or if it is just a temporary spike. In a range-bound market, standard deviation-based Bollinger Bands define normal price extremes, while ATR-based extensions highlight whether a breakout attempt has genuine force behind it. Traders gain clarity on when a move is both statistically unusual and accompanied by real volatility expansion, thus carrying a higher probability of a directional follow-through or eventual reversion.
Practical advantages emerge across timeframes. Scalpers in fast-paced markets appreciate how ATR-based thresholds update rapidly, revealing if a sudden price push is routine or exceptional. Swing traders can rely on both indicators to filter out false signals in stable conditions or identify truly notable moves. By calibrating to changes in volatility, the merged system adapts naturally whether the market is trending, ranging, or transitioning between these phases.
In summary, combining Bollinger Bands (for a static sense of standard-deviation-based overbought/oversold zones) with ATR (for a dynamic read on current volatility) yields an adaptive, intuitive indicator. Traders can better distinguish fleeting noise from meaningful expansions, enabling more informed entries, exits, and risk management. Instead of relying on a single yardstick for all market conditions, this fusion provides a layered perspective, encouraging traders to interpret price moves in the broader context of changing volatility.
Section 3: Why Bollinger Bands and ATR are combined
Bollinger Bands provide a static snapshot of volatility by computing a standard deviation range above and below a central average. ATR, on the other hand, adapts in real time to expansions or contractions in market volatility. When combined, these measures offset each other’s limitations: Bollinger Bands add structure (overbought and oversold references), and ATR ensures responsiveness to rapid price shifts. This synergy helps reduce noisy signals, particularly during sudden market turbulence or extended consolidations.
Section 4: User Inputs
Traders can adjust several parameters to suit their preferences and strategies. These typically include:
1. Lookback length for calculating the moving average and standard deviation.
2. Multipliers to control the width of Bollinger Bands.
3. An ATR multiplier to set the distance for additional reversal bands.
4. An option to display weaker signals when the price merely approaches but does not cross the outer bands.
Section 5: Main Calculations
At the core of this indicator are four important steps:
1. Calculate a basis using a simple moving average.
2. Derive Bollinger Bands by adding and subtracting a product of the standard deviation and a user-defined multiplier.
3. Compute ATR over the same lookback period and multiply it by the selected factor.
4. Combine ATR-based distance with the Bollinger Bands to set the outer reversal bands, which serve as stronger signal thresholds.
Section 6: Signal Generation
The script interprets meaningful reversal points when the price:
1. Crosses below the lower outer band, potentially highlighting oversold conditions where a bullish reversal may occur.
2. Crosses above the upper outer band, potentially indicating overbought conditions where a bearish reversal may develop.
Section 7: Visualization
The indicator provides visual clarity through labeled signals and color-coded references:
1. Distinct colors for upper and lower reversal bands.
2. Markers that appear above or below bars to denote possible buying or selling signals.
3. A gradient bar color scheme indicating a bar’s position between the lower and upper bands, helping traders quickly see if the price is near either extreme.
Section 8: Weak Signals (Optional)
For those preferring early cues, the script can highlight areas where the price nears the outer bands. When weak signals are enabled:
1. Bars closer to the upper reversal zone receive a subtle marker suggesting a less robust, yet still noteworthy, potential selling area.
2. Bars closer to the lower reversal zone receive a subtle marker suggesting a less robust, yet still noteworthy, potential buying area.
Section 9: Simplicity, Effectiveness, and Lower Timeframes
Although combining standard deviation and ATR involves sophisticated volatility concepts, this indicator is visually straightforward. Reversal bands and gradient-colored bars make it easy to see at a glance when price approaches or crosses a threshold. Day traders operating on lower timeframes benefit from such clarity because it helps filter out minor fluctuations and focus on more meaningful signals.
Section 10: Adaptability across Market Phases
Because both the standard deviation (for Bollinger Bands) and ATR adapt to changing volatility, the indicator naturally adjusts to various environments:
1. Trending: The additional ATR-based outer bands help distinguish between temporary pullbacks and deeper reversals.
2. Ranging: Bollinger Bands often remain narrower, identifying smaller reversals, while the outer ATR bands remain relatively close to the main bands.
Section 11: Reduced Noise in High-Volatility Scenarios
By factoring ATR into the band calculations, the script widens or narrows the thresholds during rapid market fluctuations. This reduces the amount of false triggers typically found in indicators that rely solely on fixed calculations, preventing overreactions to abrupt but short-lived price spikes.
Section 12: Incorporation with Other Technical Tools
Many traders combine this indicator with oscillators such as RSI, MACD, or Stochastic, as well as volume metrics. Overbought or oversold signals in momentum oscillators can provide additional confirmation when price reaches the outer bands, while volume spikes may reinforce the significance of a breakout or potential reversal.
Section 13: Risk Management Considerations
All trading strategies carry risk. This indicator, like any tool, can and does produce losing trades if price unexpectedly reverses again or if broader market conditions shift rapidly. Prudent traders employ protective measures:
1. Stop-loss orders or trailing stops.
2. Position sizing that accounts for market volatility.
3. Diversification across different asset classes when possible.
Section 14: Overbought and Oversold Identification
Standard Bollinger Bands highlight regions where price might be overextended relative to its recent average. The extended ATR-based reversal bands serve as secondary lines of defense, identifying moments when price truly stretches beyond typical volatility bounds.
Section 15: Parameter Customization for Different Needs
Users can tailor the script to their unique preferences:
1. Shorter lookback settings yield faster signals but risk more noise.
2. Higher multipliers spread the bands further apart, filtering out small moves but generating fewer signals.
3. Longer lookback periods smooth out market noise, often leading to more stable but less frequent trading cues.
Section 16: Examples of Different Trading Styles
1. Day Traders: Often reduce the length to capture quick price swings.
2. Swing Traders: May use moderate lengths such as 20 to 50 bars.
3. Position Traders: Might opt for significantly longer settings to detect macro-level reversals.
Section 17: Performance Limitations and Reality Check
No technical indicator is free from false signals. Sudden fundamental news events, extreme sentiment changes, or low-liquidity conditions can render signals less reliable. Backtesting and forward-testing remain essential steps to gauge whether the indicator aligns well with a trader’s timeframe, risk tolerance, and instrument of choice.
Section 18: Merging Volatility and Momentum
A critical uniqueness of this indicator lies in how it merges Bollinger Bands (standard deviation-based) with ATR (pure volatility measure). Bollinger Bands provide a relative measure of price extremes, while ATR dynamically reacts to market expansions and contractions. Together, they offer an enhanced perspective on potential market turns, ideally reducing random noise and highlighting moments where price has traveled beyond typical bounds.
Section 19: Purpose of this Merger
The fundamental purpose behind blending standard deviation measures with real-time volatility data is to accommodate different market behaviors. Static standard deviation alone can underreact or overreact in abnormally volatile conditions. ATR alone lacks a baseline reference to normality. By merging them, the indicator aims to provide:
1. A versatile dynamic range for both typical and extreme moves.
2. A filter against frequent whipsaws, especially in choppy environments.
3. A visual framework that novices and experts can interpret rapidly.
Section 20: Summary and Practical Tips
Uptrick: Volatility Reversion Bands offers a powerful tool for traders looking to combine volatility-based signals with momentum-derived reversals. It emphasizes clarity through color-coded bars, defined reversal zones, and optional weak signal markers. While potentially useful across all major timeframes, it demands ongoing risk management, realistic expectations, and careful study of how signals behave under different market conditions. No indicator serves as a crystal ball, so integrating this script into an overall strategy—possibly alongside volume data, fundamentals, or momentum oscillators—often yields the best results.
Disclaimer and Educational Use
This script is intended for educational and informational purposes. It does not constitute financial advice, nor does it guarantee trading success. Sudden economic events, low-liquidity times, and unexpected market behaviors can all undermine technical signals. Traders should use proper testing procedures (backtesting and forward-testing) and maintain disciplined risk management measures.

Volatility Cycle IndicatorThe Volatility Cycle Indicator is a non-directional trading tool designed to measure market volatility and cycles based on the relationship between standard deviation and Average True Range (ATR). In the Chart GBPAUD 1H time frame you can clearly see when volatility is low, market is ranging and when volatility is high market is expanding.
This innovative approach normalizes the standard deviation of closing prices by ATR, providing a dynamic perspective on volatility. By analyzing the interaction between Bollinger Bands and Keltner Channels, it also detects "squeeze" conditions, highlighting periods of reduced volatility, often preceding explosive price movements.
The indicator further features visual aids, including colored zones, plotted volatility cycles, and highlighted horizontal levels to interpret market conditions effectively. Alerts for key events, such as volatility crossing significant thresholds or entering a squeeze, make it an ideal tool for proactive trading.
Key Features:
Volatility Measurement:
Tracks the Volatility Cycle, normalized using standard deviation and ATR.
Helps identify periods of high and low volatility in the market.
Volatility Zones:
Colored zones represent varying levels of market volatility:
Blue Zone: Low volatility (0.5–0.75).
Orange Zone: Transition phase (0.75–1.0).
Green Zone: Moderate volatility (1.0–1.5).
Fuchsia Zone: High volatility (1.5–2.0).
Red Zone: Extreme volatility (>2.0).
Squeeze Detection:
Identifies when Bollinger Bands contract within Keltner Channels, signaling a volatility squeeze.
Alerts are triggered for potential breakout opportunities.
Visual Enhancements:
Dynamic coloring of the Volatility Cycle for clarity on its momentum and direction.
Plots multiple horizontal levels for actionable insights into market conditions.
Alerts:
Sends alerts when the Volatility Cycle crosses significant levels (e.g., 0.75) or when a squeeze condition is detected.
Non-Directional Nature:
The indicator does not predict the market's direction but rather highlights periods of potential movement, making it suitable for both trend-following and mean-reversion strategies.
How to Trade with This Indicator:
Volatility Squeeze Breakout:
When the indicator identifies a squeeze (volatility compression), prepare for a breakout in either direction.
Use additional directional indicators or chart patterns to determine the likely breakout direction.
Crossing Volatility Levels:
Pay attention to when the Volatility Cycle crosses the 0.75 level:
Crossing above 0.75 indicates increasing volatility—ideal for trend-following strategies.
Crossing below 0.75 signals decreasing volatility—consider mean-reversion strategies.
Volatility Zones:
Enter positions as volatility transitions through key zones:
Low volatility (Blue Zone): Watch for breakout setups.
Extreme volatility (Red Zone): Be cautious of overextended moves or reversals.
Alerts for Proactive Trading:
Configure alerts for squeeze conditions and level crossings to stay updated without constant monitoring.
Best Practices:
Pair the Volatility Cycle Indicator with directional indicators such as moving averages, trendlines, or momentum oscillators to improve trade accuracy.
Use on multiple timeframes to align entries with broader market trends.
Combine with risk management techniques, such as ATR-based stop losses, to handle volatility spikes effectively.

ATR ReadoutDisplays a readout on the bottom right corner of the screen displaying ATR average (not of the individual candlestick, but of the current rolling period, including the candlestick in question).
Due to restrictions with Pine Script (or my knowledge thereof) only the current and previous candlestick data is shown, rather than the one currently hovered over.
The data is derived via the standard calculation for ATR.
Using this, one can quickly and easily get the proper data needed to calculate one's stop loss, rather than having to analyze the line graph of the basic ATR indicator.
Settings are implemented to change certain variables to your liking.

Breadth of Volatility The Breadth of Volatility (BoV) is an indicator designed to help traders understand the activity and volatility of the market. It focuses on analyzing how fast prices are moving and how much trading volume is driving those movements. By combining these two factors—price speed and volume strength—the BoV provides a single value that reflects the current level of market activity. This can help traders identify when the market is particularly active or calm, which is useful for planning trading strategies.
The speed component of the BoV measures how quickly prices are moving compared to their recent average. This is done by using a metric called the Average True Range (ATR), which calculates the typical size of price movements over a specific period. The BoV compares the current price change to this average, showing whether the market is moving faster or slower than usual. Faster price movements generally indicate higher volatility, which might signal opportunities for active traders.
The strength component focuses on the role of trading volume in price changes. It multiplies the trading volume by the size of the price movement to create a value called volume strength. This value is then compared to the highest volume strength seen over a recent period, which helps gauge whether the current price action is being strongly supported by trading activity. When the strength value is high, it suggests that market participants are actively trading and supporting the price movement.
These two components—speed and strength—are averaged to calculate the Breadth of Volatility value. While the formula also includes a placeholder for a third component (related to fundamental analysis), it is currently inactive and does not influence the final value. The BoV is displayed as a line on a chart, with a zero line for reference. Positive BoV values indicate heightened market activity and volatility, while values near zero suggest a quieter market. This indicator is particularly helpful for new traders to monitor market conditions and adjust their strategies accordingly, whether they’re focusing on trend-following or waiting for calmer periods for more conservative trades.
Important Notice:
Trading financial markets involves significant risk and may not be suitable for all investors. The use of technical indicators like this one does not guarantee profitable results. This indicator should not be used as a standalone analysis tool. It is essential to combine it with other forms of analysis, such as fundamental analysis, risk management strategies, and awareness of current market conditions. Always conduct thorough research or consult with a qualified financial advisor before making trading decisions. Past performance is not indicative of future results.
Disclaimer:
Trading financial instruments involves substantial risk and may not be suitable for all investors. Past performance is not indicative of future results. This indicator is provided for informational and educational purposes only and should not be considered investment advice. Always conduct your own research and consult with a licensed financial professional before making any trading decisions.
Note: The effectiveness of any technical indicator can vary based on market conditions and individual trading styles. It's crucial to test indicators thoroughly using historical data and possibly paper trading before applying them in live trading scenarios.

Daily ATR Levels - Vishal SubandhThe following script visualizes the ATR High and ATR Low levels based on the previous day’s closing price. The Average True Range (ATR) indicates how much a stock is likely to move—upward or downward—on a given day, providing insight into its intraday volatility. Additionally, the script calculates and displays the daily ATR as a percentage, with specific levels marked at 60% and 80%.
These percentage levels are plotted for both the high and low ranges, offering a framework to analyze potential price movements. In the context of a strong trend, prices often extend to the 80% or even 100% ATR level before showing signs of reversal. Such behavior is observed during pronounced uptrends or downtrends. Conversely, during weaker trends, price reversals may occur at the 60% ATR levels.
It is recommended to use this analysis in conjunction with other tools, such as support and resistance levels or demand and supply zones, for a more comprehensive approach to trading.
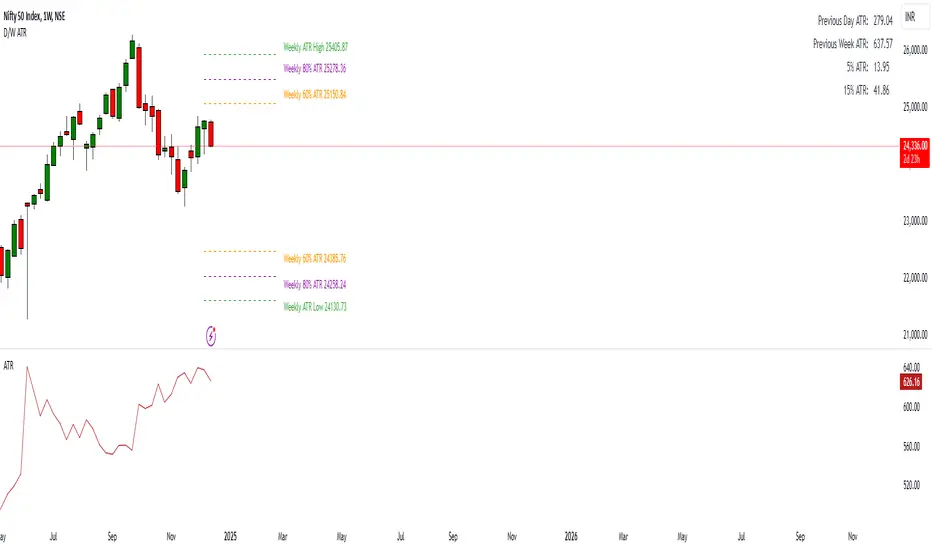
ATR for Aggregated Bars (2 Bars)Range Bar ATR Indicator: Detailed Description and Usage Guide
This script is a custom indicator designed specifically for Range Bar charts , tailored to help traders understand and navigate market conditions by utilizing the Average True Range (ATR) concept. The indicator adapts the traditional ATR to work effectively with Range Bar charts, where bars have a fixed range rather than being time-based.
How It Works
1. ATR Calculation on Range Bars :
- Unlike time-based charts, Range Bar charts focus on price movement within a fixed range.
- The indicator calculates ATR by pairing consecutive bars, treating every two bars as a single unit . This pairing ensures that the ATR reflects price movement effectively on Range Bar charts.
2. Short and Long Period ATR Values :
- The script displays two ATR values :
- A short-period ATR , calculated over a smaller number of paired bars.
- A long-period ATR , calculated over a larger number of paired bars.
- These values provide a dynamic view of both recent and longer-term market volatility.
Why Use This Indicator?
The primary goal is to provide a meaningful adaptation of the ATR indicator for Range Bar charts, allowing traders to make informed decisions similar to using ATR on traditional time-based charts.
Key Applications
Determine a Better Custom Range :
- Analyze the ATR values to choose an optimal range size for Range Bar charts, ensuring better alignment with market conditions.
Assess Market Volatility :
- Rising volatility : When the short-period ATR value is higher than the long-period value, it signals increasing volatility.
- Decreasing volatility : When the short-period ATR value is lower, it indicates declining volatility.
Risk and Stop Loss Management :
- Use the higher ATR value (e.g., the long-period ATR) to calculate minimum stop loss levels. Multiply the ATR by 1.5 or 2 to set a safe buffer against market fluctuations.
How to Use It
1. Add the script to a Range Bar chart.
2. Configure the short and long ATR periods to suit your trading style and preferences.
3. Observe the displayed ATR values:
- Use these values to analyze market conditions and adapt your strategy accordingly.
4. Apply insights from the ATR values for:
- Determining custom Range Bar settings.
- Evaluating volatility trends.
- Setting effective risk parameters like stop loss levels.
Benefits
- Provides a tailored ATR tool for Range Bar charts, addressing the unique challenges of fixed-range trading.
- Offers both short-term and long-term perspectives on volatility.
- Enhances decision-making for range settings, volatility analysis, and risk management.
This indicator bridges the gap between traditional ATR indicators and the specific needs of Range Bar chart users, making it a versatile tool for traders.

Prediction Based on Linreg & Atr
We created this algorithm with the goal of predicting future prices 📊, specifically where the value of any asset will go in the next 20 periods ⏳. It uses linear regression based on past prices, calculating a slope and an intercept to forecast future behavior 🔮. This prediction is then adjusted according to market volatility, measured by the ATR 📉, and the direction of trend signals, which are based on the MACD and moving averages 📈.
How Does the Linreg & ATR Prediction Work?
1. Trend Calculation and Signals:
o Technical Indicators: We use short- and long-term exponential moving averages (EMA), RSI, MACD, and Bollinger Bands 📊 to assess market direction and sentiment (not visually presented in the script).
o Calculation Functions: These include functions to calculate slope, average, intercept, standard deviation, and Pearson's R, which are crucial for regression analysis 📉.
2. Predicting Future Prices:
o Linear Regression: The algorithm calculates the slope, average, and intercept of past prices to create a regression channel 📈, helping to predict the range of future prices 🔮.
o Standard Deviation and Pearson's R: These metrics determine the strength of the regression 🔍.
3. Adjusting the Prediction:
o The predicted value is adjusted by considering market volatility (ATR 📉) and the direction of trend signals 🔮, ensuring that the prediction is aligned with the current market environment 🌍.
4. Visualization:
o Prediction Lines and Bands: The algorithm plots lines that display the predicted future price along with a prediction range (upper and lower bounds) 📉📈.
5. EMA Cross Signals:
o EMA Conditions and Total Score: A bullish crossover signal is generated when the total score is positive and the short EMA crosses above the long EMA 📈. A bearish crossover signal is generated when the total score is negative and the short EMA crosses below the long EMA 📉.
6. Additional Considerations:
o Multi-Timeframe Regression Channel: The script calculates regression channels for different timeframes (5m, 15m, 30m, 4h) ⏳, helping determine the overall market direction 📊 (not visually presented).
Confidence Interpretation:
• High Confidence (close to 100%): Indicates strong alignment between timeframes with a clear trend (bullish or bearish) 🔥.
• Low Confidence (close to 0%): Shows disagreement or weak signals between timeframes ⚠️.
Confidence complements the interpretation of the prediction range and expected direction 🔮, aiding in decision-making for market entry or exit 🚀.
Español
Creamos este algoritmo con el objetivo de predecir los precios futuros 📊, específicamente hacia dónde irá el valor de cualquier activo en los próximos 20 períodos ⏳. Utiliza regresión lineal basada en los precios pasados, calculando una pendiente y una intersección para prever el comportamiento futuro 🔮. Esta predicción se ajusta según la volatilidad del mercado, medida por el ATR 📉, y la dirección de las señales de tendencia, que se basan en el MACD y las medias móviles 📈.
¿Cómo Funciona la Predicción con Linreg & ATR?
Cálculo de Tendencias y Señales:
Indicadores Técnicos: Usamos medias móviles exponenciales (EMA) a corto y largo plazo, RSI, MACD y Bandas de Bollinger 📊 para evaluar la dirección y el sentimiento del mercado (no presentados visualmente en el script).
Funciones de Cálculo: Incluye funciones para calcular pendiente, media, intersección, desviación estándar y el coeficiente de correlación de Pearson, esenciales para el análisis de regresión 📉.
Predicción de Precios Futuros:
Regresión Lineal: El algoritmo calcula la pendiente, la media y la intersección de los precios pasados para crear un canal de regresión 📈, ayudando a predecir el rango de precios futuros 🔮.
Desviación Estándar y Pearson's R: Estas métricas determinan la fuerza de la regresión 🔍.
Ajuste de la Predicción:
El valor predicho se ajusta considerando la volatilidad del mercado (ATR 📉) y la dirección de las señales de tendencia 🔮, asegurando que la predicción esté alineada con el entorno actual del mercado 🌍.
Visualización:
Líneas y Bandas de Predicción: El algoritmo traza líneas que muestran el precio futuro predicho, junto con un rango de predicción (límites superior e inferior) 📉📈.
Señales de Cruce de EMAs:
Condiciones de EMAs y Puntaje Total: Se genera una señal de cruce alcista cuando el puntaje total es positivo y la EMA corta cruza por encima de la EMA larga 📈. Se genera una señal de cruce bajista cuando el puntaje total es negativo y la EMA corta cruza por debajo de la EMA larga 📉.
Consideraciones Adicionales:
Canal de Regresión Multi-Timeframe: El script calcula canales de regresión para diferentes marcos de tiempo (5m, 15m, 30m, 4h) ⏳, ayudando a determinar la dirección general del mercado 📊 (no presentado visualmente).
Interpretación de la Confianza:
Alta Confianza (cerca del 100%): Indica una fuerte alineación entre los marcos temporales con una tendencia clara (alcista o bajista) 🔥.
Baja Confianza (cerca del 0%): Muestra desacuerdo o señales débiles entre los marcos temporales ⚠️.
La confianza complementa la interpretación del rango de predicción y la dirección esperada 🔮, ayudando en las decisiones de entrada o salida en el mercado 🚀.
ATR SL Band (No-Repaint, Multi-Timeframe) + Risk per ContractThis indicator draws a non-repainting band for ATR-based Stoploss placement.
If used on Futures, it shows the distance + risk from the previous candle close, as well as from the current price.
The risk value is automatically calculated for the following symbols:
(Micro) ES (S&P 500)
(Micro) NQ (NASDAQ 100)
(Micro) YM (Dow Jones Industrial Average / US30)
The timeframe can be set individually. It is not recommended to use a lower timeframe than the chart timeframe as values differ from the actual timeframe's ATR SL in this case.

Visual ATR StopThis indicator uses the Average True Range (ATR) to display a visual range for stop placement. Two multiplier values (example, 1 and 3) can be set to create a filled area below the price. This area represents the range between the two ATR levels, adjusted by subtracting the current price, providing a simple way to visualize stop-loss placement based on volatility.
The indicator is customizable; for example, negative values can place the area above the price for short positions. The filled color can also be removed, which allows precise levels to be marked above and below.

WhalenatorThis custom TradingView indicator combines multiple analytic techniques to help identify potential market trends, areas of support and resistance, and zones of heightened trading activity. It incorporates a SuperTrend-like line based on ATR, Keltner Channels for volatility-based price envelopes, and dynamic order blocks derived from significant volume and pivot points. Additionally, it highlights “whale” activities—periods of exceptionally large volume—along with an estimated volume profile level and approximate bid/ask volume distribution. Together, these features aim to offer traders a more comprehensive view of price structure, volatility, and institutional participation.
This custom TradingView indicator integrates multiple trading concepts into a single, visually descriptive tool. Its primary goal is to help traders identify directional bias, volatility levels, significant volume events, and potential support/resistance zones on a price chart. Below are the main components and their functionalities:
SuperTrend-Like Line (Trend Bias):
At the core of the indicator is a trend-following line inspired by the SuperTrend concept, which uses Average True Range (ATR) to adaptively set trailing stop levels. By comparing price to these levels, the line attempts to indicate when the market is in an uptrend (price above the line) or a downtrend (price below the line). The shifting levels can provide a dynamic sense of direction and help traders stay with the predominant trend until it shifts.
Keltner Channels (Volatility and Range):
Keltner Channels, based on an exponential moving average and Average True Range, form volatility-based envelopes around price. They help traders visualize whether price is extended (touching or moving outside the upper/lower band) or trading within a stable range. This can be useful in identifying low-volatility consolidations and high-volatility breakouts.
Dynamic Order Blocks (Approximations of Supply/Demand Zones):
By detecting pivot highs and lows under conditions of significant volume, the indicator approximates "order blocks." Order blocks are areas where institutional buying or selling may have occurred, potentially acting as future support or resistance zones. Although these approximations are not perfect, they offer a visual cue to areas on the chart where price might react strongly if revisited.
Volume Profile Proxy and Whale Detection:
The indicator highlights price levels associated with recent maximum volume activity, providing a rough "volume profile" reference. Such levels often become key points of price interaction.
"Whale" detection logic attempts to identify bars where exceptionally large volume occurs (beyond a defined threshold). By tracking these "whale bars," traders can infer where heavy participation—often from large traders or institutions—may influence market direction or create zones of interest.
Approximate Bid/Ask Volume and Dollar Volume Tracking:
The script estimates whether volume within each bar leans more towards the bid or the ask side, aiming to understand which participant (buyers or sellers) might have been more aggressive. Additionally, it calculates dollar volume (close price multiplied by volume) and provides an average to gauge the relative participation strength over time.
Labeling and Visual Aids:
Dynamic labels display Whale Frequency (the ratio of bars with exceptionally large volume), average dollar volume, and approximate ask/bid volume metrics. This gives traders at-a-glance insights into current market conditions, participation, and sentiment.
Strengths:
Multifaceted Analysis:
By combining trend, volatility, volume, and order block logic in one place, the indicator saves chart space and simplifies the analytical process. Traders gain a holistic view without flipping between multiple separate tools.
Adaptable to Market Conditions:
The use of ATR and Keltner Channels adapts to changing volatility conditions. The SuperTrend-like line helps keep traders aligned with the prevailing trend, avoiding constant whipsaws in choppy markets.
Volume-Based Insights:
Integrating whale detection and a crude volume profile proxy helps traders understand where large players might be interacting. This perspective can highlight critical levels that might not be evident from price action alone.
Convenient Visual Cues and Labels:
The indicator provides quick reference points and textual information about the underlying volume dynamics, making decision-making potentially faster and more informed.
Weaknesses:
Heuristic and Approximate Nature:
Many of the indicator’s features, like the "order blocks," "whale detection," and the approximate bid/ask volume, rely on heuristics and assumptions that may not always be accurate. Without actual Level II data or true volume profiles, the insights are best considered as supplementary, not definitive signals.
Lagging Components:
Indicators that rely on past data, like ATR-based trends or moving averages for Keltner Channels, inherently lag behind price. This can cause delayed signals, particularly in fast-moving markets, potentially missing some early opportunities or late in confirming market reversals.
No Guaranteed Predictive Power:
As with any technical tool, it does not forecast the future with certainty. Strong volume at a certain level or a bullish SuperTrend reading does not guarantee price will continue in that direction. Market conditions can change unexpectedly, and false signals will occur.
Complexity and Overreliance Risk:
With multiple signals combined, there’s a risk of information overload. Traders might feel compelled to rely too heavily on this one tool. Without complementary analysis (fundamentals, news, or additional technical confirmation), overreliance on the indicator could lead to misguided trades.
Conclusion:
This integrated indicator offers a comprehensive visual guide to market structure, volatility, and activity. Its strength lies in providing a multi-dimensional viewpoint in a single tool. However, traders should remain aware of its approximations, inherent lags, and the potential for conflicting signals. Sound risk management, position sizing, and the use of complementary analysis methods remain essential for trading success.
Risks Associated with Trading:
No indicator can guarantee profitable trades or accurately predict future price movements. Market conditions are inherently unpredictable, and reliance on any single tool or combination of tools carries the risk of financial loss. Traders should practice sound risk management, including the use of stop losses and position sizing, and should not trade with funds they cannot afford to lose. Ultimately, decisions should be guided by a thorough trading plan and possibly supplemented with other forms of market analysis or professional advice.
Risks and Important Considerations:
• Not a Standalone Tool:
• This indicator should not be used in isolation. It is essential to incorporate additional technical analysis tools, fundamental analysis, and market context when making trading decisions.
• Relying solely on this indicator may lead to incomplete assessments of market conditions.
• Market Volatility and False Signals:
• Financial markets can be highly volatile, and indicators based on historical data may not accurately predict future movements.
• The indicator may produce false signals due to sudden market changes, low liquidity, or atypical trading activity.
• Risk Management:
• Always employ robust risk management strategies, including setting stop-loss orders, diversifying your portfolio, and not over-leveraging positions.
• Understand that no indicator guarantees success, and losses are a natural part of trading.
• Emotional Discipline:
• Avoid making impulsive decisions based on indicator signals alone.
• Emotional trading can lead to significant financial losses; maintain discipline and adhere to a well-thought-out trading plan.
• Continuous Learning and Adaptation:
• Stay informed about market news, economic indicators, and global events that may impact trading conditions.
• Continuously evaluate and adjust your trading strategies as market dynamics evolve.
• Consultation with Professionals:
• Consider seeking advice from financial advisors or professional traders to understand better how this indicator can fit into your overall trading strategy.
• Professional guidance can provide personalized insights based on your financial goals and risk tolerance.
Disclaimer:
Trading financial instruments involves substantial risk and may not be suitable for all investors. Past performance is not indicative of future results. This indicator is provided for informational and educational purposes only and should not be considered investment advice. Always conduct your own research and consult with a licensed financial professional before making any trading decisions.
Note: The effectiveness of any technical indicator can vary based on market conditions and individual trading styles. It's crucial to test indicators thoroughly using historical data and possibly paper trading before applying them in live trading scenarios.
