Machine Learning Key Levels [AlgoAlpha]🟠 OVERVIEW
This script plots Machine Learning Key Levels on your chart by detecting historical pivot points and grouping them using agglomerative clustering to highlight price levels with the most past reactions. It combines a pivot detection, hierarchical clustering logic, and an optional silhouette method to automatically select the optimal number of key levels, giving you an adaptive way to visualize price zones where activity concentrated over time.
🟠 CONCEPTS
Agglomerative clustering is a bottom-up method that starts by treating each pivot as its own cluster, then repeatedly merges the two closest clusters based on the average distance between their members until only the desired number of clusters remain. This process creates a hierarchy of groupings that can flexibly describe patterns in how price reacts around certain levels. This offers an advantage over K-means clustering, since the number of clusters does not need to be predefined. In this script, it uses an average linkage approach, where distance between clusters is computed as the average pairwise distance of all contained points.
The script finds pivot highs and lows over a set lookback period and saves them in a buffer controlled by the Pivot Memory setting. When there are at least two pivots, it groups them using agglomerative clustering: it starts with each pivot as its own group and keeps merging the closest pairs based on their average distance until the desired number of clusters is left. This number can be fixed or chosen automatically with the silhouette method, which checks how well each point fits in its cluster compared to others (higher scores mean cleaner separation). Once clustering finishes, the script takes the average price of each cluster to create key levels, sorts them, and draws horizontal lines with labels and colors showing their strength. A metrics table can also display details about the clusters to help you understand how the levels were calculated.
🟠 FEATURES
Agglomerative clustering engine with average linkage to merge pivots into level groups.
Dynamic lines showing each cluster’s price level for clarity.
Labels indicating level strength either as percent of all pivots or raw counts.
A metrics table displaying pivot count, cluster count, silhouette score, and cluster size data.
Optional silhouette-based auto-selection of cluster count to adaptively find the best fit.
🟠 USAGE
Add the indicator to any chart. Choose how far back to detect pivots using Pivot Length and set Pivot Memory to control how many are kept for clustering (more pivots give smoother levels but can slow performance). If you want the script to pick the number of levels automatically, enable Auto No. Levels ; otherwise, set Number of Levels . The colored horizontal lines represent the calculated key levels, and circles show where pivots occurred colored by which cluster they belong to. The labels beside each level indicate its strength, so you can see which levels are supported by more pivots. If Show Metrics Table is enabled, you will see statistics about the clustering in the corner you selected. Use this tool to spot areas where price often reacts and to plan entries or exits around levels that have been significant over time. Adjust settings to better match volatility and history depth of your instrument.
Indicatori e strategie

fadi ffa This script is for educational purposes only. It draws historical pivot points and labels them on the chart to help users visualize price levels. It does not provide trading signals, recommendations, or any financial advice. Use at your own risk. The author is not responsible for any decisions made based on this script.

BB + RSI & Volume FilterThis script overlays three sets of technical filters on your price chart and generates signals when conditions align:
Bollinger Bands
Calculates upper, middle, and lower bands using either SMA or EMA.
Buy signal when price crosses up through the lower band.
Sell signal when price crosses down through the upper band.
Volume Filter
Computes a simple moving average of volume.
Ensures breakout moves have sufficient volume by requiring current volume > SMA(volume) × multiplier.
RSI Filter
Computes RSI on the chosen source.
Buy when RSI crosses above the oversold threshold.
Sell when RSI crosses below the overbought threshold.
Only plots RSI signals that pass the volume filter.
You get:
Bollinger entry/exit shapes (labeled “BB ↑/↓”).
RSI entry/exit shapes (labeled “RSI”) only when volume confirms the move.
Alerts for each signal type.
This combination reduces false breakouts by requiring both volatility (Bollinger) or momentum (RSI) and volume confirmation

VEP - Volume Explosion Predictor💥 VEP - Volume Explosion Predictor
General Overview
The Volume Explosion Predictor (VEP) is an advanced indicator that analyzes volume peaks to predict when the next volume explosion might occur. Using statistical analysis on historical patterns, it provides accurate probabilities on moments of greater trading activity.
MAIN FEATURES
🎯 Intelligent volume peak detection
Automatically identifies significant volume peaks
Anti-consecutive filter to avoid redundant signals
Customizable threshold for detection sensitivity
📊 Advanced statistical analysis
Calculates the average distance between volume peaks
Monitors the number of sessions without peaks
Tracks the maximum historical range without activity
🔮 Predictive system
Dynamic probability: Calculates the probability of an imminent peak
Visual indicators: Background colors that change based on probability
Time forecasts: Estimates remaining sessions to the next peak
📈 Visual signals
Colored arrows: Green for bullish peaks, red for bearish peaks
Statistics table: Complete real-time overview
ALERT SYSTEM
🚨 Three Alert Levels
New Valid Volume Peak: New peak detected
Approaching Prediction: Increasing probability
High Peak Probability: High probability of explosion
HOW TO USE IT
📋 Recommended setup
Timeframe : Works on all timeframes but daily, weekly or monthly timeframe usage is recommended. In any case, it should always be used consistently with your time horizon
Markets : Stocks, crypto, forex, commodities
Threshold for volume peak realization : It's recommended to start with 2.0x (i.e., twice the volume average) for normal markets, 1.5x for more volatile markets. This parameter can be set in the settings as desired
🎨 Visual interpretation
Green Arrows : Peak during bullish candle
Red Arrows : Peak during bearish candle
Red Background : High probability (>90%) of new peak
Yellow Background : Medium probability (50-70%)
📊 STATISTICS TABLE
The table shows:
Total peaks analyzed
Average distance between peaks
Current sessions without peaks
Forecast remaining sessions
Percentage probability
Volume threshold needed for peak realization
STRATEGIC ADVANTAGES
🎯 For Day Traders
Anticipates moments of greater volatility for analysis, supporting the evaluation of trading setups and providing context on low volume periods
📈 For Swing Traders
Identifies high-probability volume patterns, supporting breakout analysis with volume and improving understanding of market timing
🔍 For Technical Analysts
Understands the stock's volume patterns.
Helps evaluate the historical market interest and supports quantitative research and analysis
OTHER THINGS TO KNOW...
A) Anti-Consecutive Algorithm : allows to avoid multiple and consecutive volume signals and peaks at close range
B) Statistical Validation : Uses standard deviation for accuracy
C) Memory Management : Limits historical data for optimal performance
D) Compatibility : Works with all TradingView chart types
⚠️ IMPORTANT DISCLAIMER
This indicator is exclusively a technical analysis tool for studying volume patterns. It does not provide investment advice, trading signals or entry/exit points. All trading decisions are at the complete discretion and responsibility of the user. Always use in combination with other technical and fundamental analysis and proper risk management.
DESCRIZIONE IN ITALIANO
💥 VEP - Volume Explosion Predictor
Panoramica Generale
Il Volume Explosion Predictor (VEP) è un indicatore avanzato che analizza i picchi di volume per prevedere quando potrebbe verificarsi la prossima esplosione di volume. Utilizzando analisi statistiche sui pattern storici, fornisce probabilità accurate sui momenti di maggiore attività di trading.
CARATTERISTICHE PRINCIPALI
🎯 Rilevamento intelligente dei picchi di volume
- Identifica automaticamente i picchi di volume significativi
- Filtro anti-consecutivo per evitare segnali ridondanti
- Soglia personalizzabile per la sensibilità del rilevamento
📊 Analisi statistica avanzata
Calcola la distanza media tra i picchi di volume
Monitora il numero di sessioni senza picchi
Traccia il range massimo storico senza attività
🔮 Sistema predittivo
Probabilità dinamica: Calcola la probabilità di un imminente picco
Indicatori visivi: Colori di sfondo che cambiano in base alla probabilità
Previsioni temporali: Stima delle sessioni rimanenti al prossimo picco
📈 Segnali visivi
1) Frecce colorate: Verdi per picchi rialzisti, rosse per ribassisti
2) Tabella statistiche: Panoramica completa in tempo reale
SISTEMA DI ALERT
🚨 Tre Livelli di Alert
1) New Valid Volume Peak: Nuovo picco rilevato
2) Approaching Prediction: Probabilità in aumento
3) High Peak Probability: Alta probabilità di esplosione
COME UTILIZZARLO
📋 Setup consigliato
- Timeframe : Funziona su tutti i timeframe ma è consigliabile un utilizzo su timeframe giornaliero, settimanale o mensile. In ogni caso va sempre utilizzato coerentemente con il proprio orizzonte temporale
- Mercati : Azioni, crypto, forex, commodities
- Limite affinché si realizzi il picco di volumi : Si consiglia di iniziare con 2.0x (ovvero due volte la media dei volumi) per mercati normali, 1.5x per mercati più volatili. Questo parametro può essere settato nelle impostazioni a proprio piacimento
🎨 Interpretazione visuale
Frecce Verdi : Picco durante candela rialzista
Frecce Rosse : Picco durante candela ribassista
Sfondo Rosso : Alta probabilità (>90%) di nuovo picco
Sfondo Giallo : Probabilità media (50-70%)
📊 TABELLA STATISTICHE
La tabella mostra:
1. Totale picchi analizzati
2. Distanza media tra picchi
3. Sessioni attuali senza picchi
4. Previsione sessioni rimanenti
5. Probabilità percentuale
6. Soglia volume necessaria affinché si realizzi il picco di volumi
VANTAGGI STRATEGICI
🎯 Per Day Traders
Anticipa i momenti di maggiore volatilità per analisi, supportando la valutazione dei setup di trading e fornendo al contempo un contesto sui periodi di basso volume
📈 Per Swing Traders
1. Identifica pattern di volume ad alta probabilità, supportando l'analisi dei breakout con volume e migliorando la comprensione dei tempi di mercato
🔍 Per Analisti Tecnici
Comprende i pattern di volume del titolo.
Aiuta a fare una valutazione dell'interesse storico del mercato ed è di supporto alla ricerca e analisi quantitativa
ALTRE COSE DA SAPERE...
A) Algoritmo Anti-Consecutivo : permette di evitare segnali e picchi di volume multipli e consecutivi multipli a distanza ravvicinata
B) Validazione Statistica : Utilizza deviazione standard per l'accuratezza
C) Gestione Memoria : Limita i dati storici per performance ottimali
D) Compatibilità : Funziona con tutti i tipi di grafico TradingView
⚠️ DISCLAIMER IMPORTANTE
Questo indicatore è esclusivamente uno strumento di analisi tecnica per lo studio dei pattern di volume. Non fornisce consigli di investimento, segnali di trading o punti di ingresso/uscita. Tutte le decisioni di trading sono a completa discrezione e responsabilità dell'utente. Utilizzare sempre in combinazione con altre analisi tecniche, fondamentali e una adeguata gestione del rischio.

Momentum Regression [BackQuant]Momentum Regression
The Momentum Regression is an advanced statistical indicator built to empower quants, strategists, and technically inclined traders with a robust visual and quantitative framework for analyzing momentum effects in financial markets. Unlike traditional momentum indicators that rely on raw price movements or moving averages, this tool leverages a volatility-adjusted linear regression model (y ~ x) to uncover and validate momentum behavior over a user-defined lookback window.
Purpose & Design Philosophy
Momentum is a core anomaly in quantitative finance — an effect where assets that have performed well (or poorly) continue to do so over short to medium-term horizons. However, this effect can be noisy, regime-dependent, and sometimes spurious.
The Momentum Regression is designed as a pre-strategy analytical tool to help you filter and verify whether statistically meaningful and tradable momentum exists in a given asset. Its architecture includes:
Volatility normalization to account for differences in scale and distribution.
Regression analysis to model the relationship between past and present standardized returns.
Deviation bands to highlight overbought/oversold zones around the predicted trendline.
Statistical summary tables to assess the reliability of the detected momentum.
Core Concepts and Calculations
The model uses the following:
Independent variable (x): The volatility-adjusted return over the chosen momentum period.
Dependent variable (y): The 1-bar lagged log return, also adjusted for volatility.
A simple linear regression is performed over a large lookback window (default: 1000 bars), which reveals the slope and intercept of the momentum line. These values are then used to construct:
A predicted momentum trendline across time.
Upper and lower deviation bands , representing ±n standard deviations of the regression residuals (errors).
These visual elements help traders judge how far current returns deviate from the modeled momentum trend, similar to Bollinger Bands but derived from a regression model rather than a moving average.
Key Metrics Provided
On each update, the indicator dynamically displays:
Momentum Slope (β₁): Indicates trend direction and strength. A higher absolute value implies a stronger effect.
Intercept (β₀): The predicted return when x = 0.
Pearson’s R: Correlation coefficient between x and y.
R² (Coefficient of Determination): Indicates how well the regression line explains the variance in y.
Standard Error of Residuals: Measures dispersion around the trendline.
t-Statistic of β₁: Used to evaluate statistical significance of the momentum slope.
These statistics are presented in a top-right summary table for immediate interpretation. A bottom-right signal table also summarizes key takeaways with visual indicators.
Features and Inputs
✅ Volatility-Adjusted Momentum : Reduces distortions from noisy price spikes.
✅ Custom Lookback Control : Set the number of bars to analyze regression.
✅ Extendable Trendlines : For continuous visualization into the future.
✅ Deviation Bands : Optional ±σ multipliers to detect abnormal price action.
✅ Contextual Tables : Help determine strength, direction, and significance of momentum.
✅ Separate Pane Design : Cleanly isolates statistical momentum from price chart.
How It Helps Traders
📉 Quantitative Strategy Validation:
Use the regression results to confirm whether a momentum-based strategy is worth pursuing on a specific asset or timeframe.
🔍 Regime Detection:
Track when momentum breaks down or reverses. Slope changes, drops in R², or weak t-stats can signal regime shifts.
📊 Trade Filtering:
Avoid false positives by entering trades only when momentum is both statistically significant and directionally favorable.
📈 Backtest Preparation:
Before running costly simulations, use this tool to pre-screen assets for exploitable return structures.
When to Use It
Before building or deploying a momentum strategy : Test if momentum exists and is statistically reliable.
During market transitions : Detect early signs of fading strength or reversal.
As part of an edge-stacking framework : Combine with other filters such as volatility compression, volume surges, or macro filters.
Conclusion
The Momentum Regression indicator offers a powerful fusion of statistical analysis and visual interpretation. By combining volatility-adjusted returns with real-time linear regression modeling, it helps quantify and qualify one of the most studied and traded anomalies in finance: momentum.

Multi-Timeframe PivotDescription:
This script provides an advanced tool for multi-timeframe pivot point
analysis. It identifies swing points based on a candle's relationship to
its neighbors. The default strength settings of 1 align with the Inner
Circle Trader (ICT) concept of market structure.
The ICT concept defines a swing point based on a simple 3-candle pattern:
- A swing high is a candle where the candles to the immediate left and right
both have lower highs.
- A swing low is a candle where the candles to the immediate left and right
both have higher lows.
A key feature is its ability to accurately calculate and translate pivot
points from up to five higher timeframes (HTFs) and display them
precisely on a lower timeframe (LTF) chart.
NOTE: This indicator is designed to show HTF data on an LTF chart.
If you select a timeframe in the settings that is lower than your
current chart's timeframe, it will show pivots for the chart's
timeframe instead.
Core Features:
- Up to five independent higher timeframes.
- Per-timeframe customization for pivot strength (left/right bars) and color.
- Optional "Watchlines" that project the price of each pivot forward,
complete with a text label identifying the timeframe.
- An optional "Alignment Model" that colors the background when price is
aligned across all active timeframes (requires at least 2 TFs to be enabled).
Default State:
For a clean initial application, the Watchlines and Alignment Model features
are disabled by default but can be enabled in the settings.

Faytterro Bands Breakout📌 Faytterro Bands Breakout 📌
This indicator was created as a strategy showcase for another script: Faytterro Bands
It’s meant to demonstrate a simple breakout strategy based on Faytterro Bands logic and includes performance tracking.
❓ What Is It?
This script is a visual breakout strategy based on a custom moving average and dynamic deviation bands, similar in concept to Bollinger Bands but with unique smoothing (centered regression) and performance features.
🔍 What Does It Do?
Detects breakouts above or below the Faytterro Band.
Plots visual trade entries and exits.
Labels each trade with percentage return.
Draws profit/loss lines for every trade.
Shows cumulative performance (compounded return).
Displays key metrics in the top-right corner:
Total Return
Win Rate
Total Trades
Number of Wins / Losses
🛠 How Does It Work?
Bullish Breakout: When price crosses above the upper band and stays above the midline.
Bearish Breakout: When price crosses below the lower band and stays below the midline.
Each trade is held until breakout invalidation, not a fixed TP/SL.
Trades are compounded, i.e., profits stack up realistically over time.
📈 Best Use Cases:
For traders who want to experiment with breakout strategies.
For visual learners who want to study past breakouts with performance metrics.
As a template to develop your own logic on top of Faytterro Bands.
⚠ Notes:
This is a strategy-like visual indicator, not an automated backtest.
It doesn't use strategy.* commands, so you can still use alerts and visuals.
You can tweak the logic to create your own backtest-ready strategy.
Unlike the original Faytterro Bands, this script does not repaint and is fully stable on closed candles.

EMA 21, 55, 200 with Small LabelsThis is a combination of ema21/50/200. Helps to identify market trends. It comes with small labels so it won't confuse which line is which. I hope it helps and good luck with your trading!

ZF RSI PLOT1. How RSI Is Calculated
RSI is typically computed over 14 periods (days, hours, etc.) using the formula:
RSI=100−1001+RS
RSI=100−1+RS100
where
RS=Average Gain over N periodsAverage Loss over N periods
RS=Average Loss over N periodsAverage Gain over N periods
2. Overbought (> 70)
Definition: An RSI reading above 70 suggests that the instrument has experienced relatively large gains and may be “overbought.”
Interpretation:
Potential Reversal: Prices may have risen too far, too fast, and could be due for a pullback or consolidation.
Exit/Take Profits: Traders often trim long positions or tighten stops as RSI climbs above 70.
Confirmation Needed:
Bearish “RSI divergence” (price makes a higher high while RSI makes a lower high).
Price action signals (e.g., bearish candlestick patterns).
Volume drying up on advances.
3. Oversold (< 30)
Definition: An RSI reading below 30 suggests that the instrument has experienced relatively large losses and may be “oversold.”
Interpretation:
Potential Bounce: Prices may have fallen too far, too fast, and could be due for a rebound or consolidation.
Buying Opportunity: Traders often look to initiate or add to long positions as RSI drops below 30.
Confirmation Needed:
Bullish “RSI divergence” (price makes a lower low while RSI makes a higher low).
Price action signals (e.g., hammer candlesticks, support levels).
Volume picking up on declines.
4. Divergences
Bullish Divergence: Price ↓ makes a lower low, RSI ↑ makes a higher low ⇒ possible trend change to the upside.
Bearish Divergence: Price ↑ makes a higher high, RSI ↓ makes a lower high ⇒ possible trend change to the downside.
5. Adjustments & Variations
Stronger Trends: Use 80/20 thresholds to avoid early signals in very strong up- or down-trends.
Shorter/Longer Periods: Adjust the look-back period (e.g., 9 for more sensitivity, 21 for smoother signals) depending on your time frame.
6. Limitations & Best Practices
Can Stay Extreme: In strong trends, RSI may remain overbought/oversold for extended periods—don’t trade it in isolation.
Combine with Other Tools: Use trend filters (moving averages, ADX), support/resistance, and volume to confirm entries.
Risk Management: Always set stops and manage position size; RSI signals can fail.
7. Putting It All Together
Identify Trend: Is the market in an uptrend, downtrend, or range?
Watch RSI Extremes: Note when RSI crosses above 70 or below 30.
Seek Confirmation: Look for divergences, candlestick/pricing signals, and supporting volume.
Execute & Manage: Enter with clear stop-loss levels, consider scaling, and lock in profits appropriately.
By understanding both the raw threshold signals and the nuances—like divergences and trend-context—you can harness RSI’s simplicity while mitigating its pitfalls.

Khalid's Custom ForecastThe indicator printed on the chart is as expected beads on the information for last 5 years , this indicator could be linked to others to give future price actions

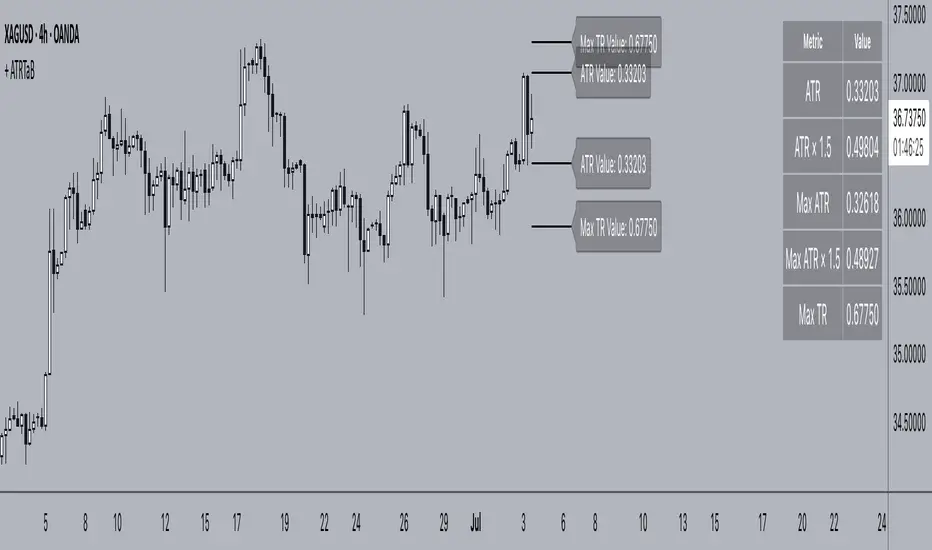
+ ATR Table and BracketsHi, all. I'm back with a new indicator—one I firmly believe could be one of the most valuable indicators you keep in your indicator toolshed—based around true range.
This is a simple, streamlined indicator utilizing true range and average true range that will help any trader with stoploss, trailing stoploss, and take-profit placement—things that I know many traders use average true range for. It could also be useful for trade entries as well, depending on the trader's style.
Typically, most traders (or at least what I've seen recommended across websites, video tutorials on YouTube, etc.) are taught to simply take the ATR number and use that, and possibly some sort of multiplier, as your stoploss and take-profit. This is fine, but I thought that it might be possible to dive a bit deeper into these values. Because an average is a combination of values, some higher, some lower, and we often see ATR spikes during periods of high volatility, I thought wouldn't it be useful to know what value those ATR spikes are, and how do they relate to the ATR? Then I thought to myself, well, what about the most volatile candle within that ATR (the candle with the greatest true range)? Couldn't knowing that value be useful to a trader? So then the idea of a table displaying these values, along with the ATR and the ATR times some multiplier number, would be a useful, simple way to display this information. That's what we have here.
The table is made up of two columns, one with the name of the metric being measured, and the other with its value. That's it. Simple.
As nice as this was, I thought an additional, great, and perhaps better, way to visualize this information would be in the form of brackets extending from the current bar. These are simply lines/labels plotted at the price values of the ATR, ATR times X, highest ATR, highest ATR times X, and highest TR value. These labels supply the actual values of the ATR, etc., but may also display the price if you should choose (both of these values are toggleable in the 'Inputs' section of the indicator.). Additionally, you can choose to display none of these labels, or all five if you wish (leaves the chart a bit cluttered, as shown in the image below), though I suspect you'll determine your preferences for which information you'd like to see and which not.
Chart with all five lines/labels displayed. I adjusted the ATRX value to 3 just to make the screenshot as legible as possible. Default is set to 1.5. As you can see, the label doesn't show the multiplier number, but the table does.
Here's a screenshot of the labels showing the price in addition to the value of the ATR, set to "Previous Closing Price," (see next paragraph for what that means) and highest TR. Personally, I don't see the value in the displaying the price, but I thought some people might want that. It's not available in the table as of now, but perhaps if I get enough requests for it I will add it.
That's basically it, but one last detail I need to go over is the dropdown box labeled "Bar Value ATR Levels are Oriented To." Firstly, this has no effect on Highest ATR, Highest ATRX, and Highest TR levels. Those are based on the ATR up to the last closed candle, meaning they aren't including the value of the currently open candle (this would be useless). However, knowing that different traders trade different ways it seemed to me prudent to allow for traders to select which opening or closing value the trader wishes to have the ATR brackets based on. For example, as someone who has consumed much No Nonsense Forex content I know that traders are urged to enter their trades in the last fifteen minutes of the trading day because the ATR is unlikely to change significantly in that period (ATR being the centerpiece of NNFX money management), so one of three selections here is to plot the brackets based on the ATR's inclusion of this value (this of course means the brackets will move while the candle is still open). The other options are to set the brackets to the current opening price, or the previous closing price. Depending on what you're trading many times these prices are virtually identical, but sometimes price gaps (stocks in particular), so, wanting your brackets placed relative to the previous close as opposed to the current open might be preferable for some traders.
And that's it. I really hope you guys like this indicator. I haven't seen anything closely similar to it on TradingView, and I think it will be something you all will find incredibly handy.
Please enjoy!
Hybrid candles by Marian BWill plot normal candles with the Heikin-Ashi colors.
You must bring the visiual order to front.

FVG IndicatorYet another indicator allowing you to plot FVGs with the following specific features:
FVG Detection: It automatically identifies bullish (BISI) and bearish (SIBI) FVGs based on the relationship between candle highs and lows.
Clear Visualization: It draws boxes to represent the FVGs and adds a median line for each FVG, making them easier to identify.
Dynamic Styles: The indicator adapts the appearance of FVGs (color and border style) based on their current state:
Untested: When the price has not yet interacted with the FVG.
Tested (Partially Traversed): When the price has entered the FVG.
Fully Traversed (Unmitigated): When the price has completely crossed the FVG but has not yet "invalidated" it (closed beyond the FVG).
Mitigated: When the FVG is invalidated by price action, it disappears from the chart to avoid clutter. This disappearance only occurs after the closing of the mitigating candle.
Full Customization: You can adjust all colors and border styles for each FVG state via the indicator's settings, as well as the maximum number of FVGs displayed.
----------------------------------------------------------------------------------------------------------------------

MVWAP 5/21/50 + LWMA 400Moving vwap de 5,21,50 y media movil ponderada de 400
se puede utilizar con cruces

Adiyogi Trend🟢🔴 “Adiyogi” Trend — Market Alignment Visualizer
“Adiyogi” Trend is a powerful, non-intrusive trend detection system built for traders who seek clarity, discipline, and alignment with true market flow. Inspired by the meditative stillness of Adiyogi and the need for mindful, high-probability decisions, this tool offers a clean and intuitive visual guide to trending environments — without cluttering the chart or pushing forced trades.
This is not a buy/sell signal generator. Instead, it is designed as a background confirmation engine that helps you stay on the right side of the market by identifying moments of true directional strength.
🧠 Core Logic
The “Adiyogi” Trend indicator highlights the background of your chart in green or red when multiple layers of strength and structure align — including momentum, market positioning, and relative force. Only when these internal components agree does the system activate a directional state.
It’s built on three foundational energies of trend confirmation:
Strength of movement
Structure in price action
Conviction in momentum
By combining these into one visual background, the indicator filters out indecision and helps you stay focused during real trend phases — whether you're day trading, swing trading, or holding longer-term positions.
📌 Core Concepts Behind the Tool
The indicator integrates three essential market filters—each confirming a different dimension of trend strength:
ADX (Average Directional Index) – Measures trend momentum.
You’ve chosen a very responsive setting (ADX Length = 2), which helps catch the earliest possible signs of momentum emergence.
The threshold is ADX ≥ 22, ensuring that weak or sideways markets are filtered out.
SuperTrend (10,1) – Captures short-term trend direction.
This setup follows price closely and reacts quickly to reversals, making it ideal for fast-moving assets or intraday strategies.
SuperTrend acts as the structural confirmation of directional bias.
RSI (Relative Strength Index) – Measures strength based on recent price closes.
You’ve configured RSI > 50 for bullish zones and < 50 for bearish—a neutral midpoint standard often used by professional traders.
This ensures that only trades in sync with momentum and recent strength are highlighted.
🌈 How It Visually Works
Background turns GREEN when:
ADX ≥ 22, indicating strong momentum
Price is above the 20 EMA and above SuperTrend (10,1)
RSI > 50, confirming recent strength
Background turns RED when:
ADX ≥ 22, indicating strong momentum
Price is below the 20 EMA and below SuperTrend (10,1)
RSI < 50, confirming recent weakness
The background remains neutral (transparent) when trend conditions are not clearly aligned—this is the tool's way of keeping you out of indecisive markets.
A label (BULL / BEAR) appears only when the bias flips from the previous one. This helps avoid repeated or redundant alerts, focusing your attention only when something changes.
📊 Practical Uses & Benefits
✅ Stay with the trend: Perfectly filters out choppy or sideways markets by only activating when conditions align across momentum, structure, and strength.
✅ Pre-trade confirmation: Use this tool to confirm trade setups from other indicators or price action patterns.
✅ Avoid noise: Prevent overtrading by focusing only on high-quality trend conditions.
✅ Visual clarity: Unlike arrows or plots that clutter the chart, this tool subtly highlights trend conditions in the background, preserving your price action view.
📍 Important Notes
This is not a buy/sell signal generator. It is a trend-confirmation system.
Use it in conjunction with your existing entry setups—such as breakouts, order blocks, retests, or candlestick patterns.
The tool helps you stay in sync with the dominant direction, especially when combining multiple timeframes.
Can be used on any market (stocks, forex, crypto, indices) and on any timeframe.

[TH] กลยุทธ์ SMC หลายกรอบเวลา (V5.2 - M15 Lead)English Explanation
This Pine Script code implements a multi-timeframe trading strategy based on Smart Money Concepts (SMC). It's designed to identify high-probability trading setups by aligning signals across three different timeframes.
The core logic is as follows:
High Timeframe (HTF) - M15: Determines the overall market direction or bias.
Medium Timeframe (MTF) - M5: Identifies potential Points of Interest (POI), such as Order Blocks or Fair Value Gaps, in alignment with the M15 bias.
Low Timeframe (LTF) - Current Chart: Looks for a specific entry trigger within the M5 POI to execute the trade.
Detailed Breakdown
## Part 1: Inputs & Settings
This section allows you to customize the indicator's parameters:
General Settings:
i_pivotLookback: Sets the lookback period for identifying pivot highs and lows on the LTF, which is crucial for finding the Change of Character (CHoCH).
M15 Bias Settings:
i_m15EmaFast / i_m15EmaSlow: These two EMA (Exponential Moving Average) values on the 15-minute chart determine the main trend. A bullish trend is confirmed when the fast EMA is above the slow EMA, and vice-versa for a bearish trend.
M5 Point of Interest (POI) Settings:
i_showM5Fvg / i_showM5Ob: Toggles the visibility of Fair Value Gaps (FVG) and Order Blocks (OB) on the 5-minute chart. These are the zones where the script will look for trading opportunities.
i_maxPois: Limits the number of POI zones drawn on the chart to keep it clean.
LTF Entry Settings:
i_entryMode:
Confirmation: The script waits for a Change of Character (CHoCH) on the LTF (your current chart) after the price enters an M5 POI. A CHoCH is a break of a recent pivot high (for buys) or pivot low (for sells), suggesting a potential reversal. This is the safer entry method.
Aggressive: The script triggers an entry as soon as the price touches the 50% level of the M5 POI, without waiting for a CHoCH. This is higher risk but can provide a better entry price.
i_showChoch: Toggles the visibility of the CHoCH confirmation lines.
Trade Management Settings:
i_tpRatio: Sets the Risk-to-Reward Ratio (RRR) for the Take Profit target. For example, a value of 2.0 means the Take Profit distance will be twice the Stop Loss distance.
i_slMode: (New in V5.2) Provides four different methods to calculate the Stop Loss:
POI Zone (Default): Places the SL at the outer edge of the M5 POI zone.
Last Swing: Places the SL at the most recent LTF swing high/low before the entry.
ATR: Uses the Average True Range (ATR) indicator to set a volatility-based SL.
Previous Candle: Places the SL at the high or low of the candle immediately preceding the entry. This is the tightest and riskiest option.
i_maxHistory: Sets the number of past trades to display on the chart.
## Part 2: Data Types & Variables
This section defines custom data structures (type) to organize information:
Poi: A structure to hold all information related to a single Point of Interest, including its price boundaries, direction (bullish/bearish), and whether it has been mitigated (touched by price).
Trade: A structure to store details for each trade, such as its entry price, SL, TP, result (Win/Loss/Active), and chart objects for drawing.
## Part 3: Core Logic & Calculations
This is the engine of the indicator:
Data Fetching: It uses request.security to pull EMA data from the M15 timeframe and candle data (high, low, open, close) from the M5 timeframe.
POI Identification: The script constantly scans the M5 data for FVG and OB patterns. When a valid pattern is found that aligns with the M15 bias (e.g., a bullish OB during an M15 uptrend), it's stored as a Poi and drawn on the chart.
Entry Trigger:
It checks if the price on the LTF enters a valid (unmitigated) POI zone.
Based on the selected i_entryMode, it either waits for a CHoCH or enters aggressively.
Once an entry condition is met, it calculates the SL based on the i_slMode, calculates the TP using the i_tpRatio, and creates a new Trade.
Trade Monitoring: For every active trade, the script checks on each new bar if the price has hit the SL or TP level. When it does, the trade's result is updated, and the visual boxes are finalized.
## Part 5: On-Screen Display
This part creates the Performance Dashboard table shown on the top-right of the chart. It provides a real-time summary of:
M15 Bias: Current market direction.
Total Trades: The total number of completed trades from the history.
Win Rate: The percentage of winning trades.
Total R-Multiple: The cumulative Risk-to-Reward multiple (sum of RRR from wins minus losses). A positive value indicates overall profitability.
🇹🇭 คำอธิบายและข้อแนะนำภาษาไทย
สคริปต์นี้เป็น Indicator สำหรับกลยุทธ์การเทรดแบบ Smart Money Concepts (SMC) ที่ใช้การวิเคราะห์จากหลายกรอบเวลา (Multi-Timeframe) เพื่อหาจุดเข้าเทรดที่มีความเป็นไปได้สูง
หลักการทำงานของ Indicator มีดังนี้:
Timeframe ใหญ่ (HTF) - M15: ใช้กำหนดทิศทางหลักของตลาด หรือ "Bias"
Timeframe กลาง (MTF) - M5: ใช้หาโซนสำคัญ หรือ "Point of Interest (POI)" เช่น Order Blocks หรือ Fair Value Gaps ที่สอดคล้องกับทิศทางจาก M15
Timeframe เล็ก (LTF) - กราฟปัจจุบัน: ใช้หาสัญญาณยืนยันเพื่อเข้าเทรดในโซน POI ที่กำหนดไว้
รายละเอียดของโค้ด
## ส่วนที่ 1: การตั้งค่า (Inputs & Settings)
ส่วนนี้ให้คุณปรับแต่งค่าต่างๆ ของ Indicator ได้:
การตั้งค่าทั่วไป:
i_pivotLookback: กำหนดระยะเวลาที่ใช้มองหาจุดกลับตัว (Pivot) ใน Timeframe เล็ก (LTF) เพื่อใช้ยืนยันสัญญาณ Change of Character (CHoCH)
การตั้งค่า M15 (ทิศทางหลัก):
i_m15EmaFast / i_m15EmaSlow: ใช้เส้น EMA 2 เส้นบน Timeframe 15 นาที เพื่อกำหนดเทรนด์หลัก หาก EMA เร็วอยู่เหนือ EMA ช้า จะเป็นเทรนด์ขาขึ้น และในทางกลับกัน
การตั้งค่า M5 (จุดสนใจ - POI):
i_showM5Fvg / i_showM5Ob: เปิด/ปิด การแสดงโซน Fair Value Gaps (FVG) และ Order Blocks (OB) บน Timeframe 5 นาที ซึ่งเป็นโซนที่สคริปต์จะใช้หาโอกาสเข้าเทรด
i_maxPois: จำกัดจำนวนโซน POI ที่จะแสดงผลบนหน้าจอ เพื่อไม่ให้กราฟดูรกเกินไป
การตั้งค่า LTF (การเข้าเทรด):
i_entryMode:
ยืนยัน (Confirmation): เป็นโหมดที่ปลอดภัยกว่า โดยสคริปต์จะรอให้เกิดสัญญาณ Change of Character (CHoCH) ใน Timeframe เล็กก่อน หลังจากที่ราคาเข้ามาในโซน POI แล้ว
เชิงรุก (Aggressive): เป็นโหมดที่เสี่ยงกว่า โดยสคริปต์จะเข้าเทรดทันทีที่ราคาแตะระดับ 50% ของโซน POI โดยไม่รอสัญญาณยืนยัน CHoCH
i_showChoch: เปิด/ปิด การแสดงเส้น CHoCH บนกราฟ
การตั้งค่าการจัดการเทรด:
i_tpRatio: กำหนด อัตราส่วนกำไรต่อความเสี่ยง (Risk-to-Reward Ratio) เพื่อตั้งเป้าหมายทำกำไร (Take Profit) เช่น 2.0 หมายถึงระยะทำกำไรจะเป็น 2 เท่าของระยะตัดขาดทุน
i_slMode: (ฟีเจอร์ใหม่ V5.2) มี 4 รูปแบบในการคำนวณ Stop Loss:
โซน POI (ค่าเริ่มต้น): วาง SL ไว้ที่ขอบนอกสุดของโซน POI
Swing ล่าสุด: วาง SL ไว้ที่จุด Swing High/Low ล่าสุดของ Timeframe เล็ก (LTF) ก่อนเข้าเทรด
ATR: ใช้ค่า ATR (Average True Range) เพื่อกำหนด SL ตามระดับความผันผวนของราคา
แท่งเทียนก่อนหน้า: วาง SL ไว้ที่ราคา High/Low ของแท่งเทียนก่อนหน้าที่จะเข้าเทรด เป็นวิธีที่ SL แคบและเสี่ยงที่สุด
i_maxHistory: กำหนดจำนวนประวัติการเทรดที่จะแสดงย้อนหลังบนกราฟ
## ส่วนที่ 2: ประเภทข้อมูลและตัวแปร
ส่วนนี้เป็นการสร้างโครงสร้างข้อมูล (type) เพื่อจัดเก็บข้อมูลให้เป็นระบบ:
Poi: เก็บข้อมูลของโซน POI แต่ละโซน เช่น กรอบราคาบน-ล่าง, ทิศทาง (ขึ้น/ลง) และสถานะว่าถูกใช้งานไปแล้วหรือยัง (Mitigated)
Trade: เก็บรายละเอียดของแต่ละการเทรด เช่น ราคาเข้า, SL, TP, ผลลัพธ์ (Win/Loss/Active) และอ็อบเจกต์สำหรับวาดกล่องบนกราฟ
## ส่วนที่ 3: ตรรกะหลักและการคำนวณ
เป็นหัวใจสำคัญของ Indicator:
ดึงข้อมูลข้าม Timeframe: ใช้ฟังก์ชัน request.security เพื่อดึงข้อมูล EMA จาก M15 และข้อมูลแท่งเทียนจาก M5 มาใช้งาน
ระบุ POI: สคริปต์จะค้นหา FVG และ OB บน M5 ตลอดเวลา หากเจ้ารูปแบบที่สอดคล้องกับทิศทางหลักจาก M15 (เช่น เจอ Bullish OB ในขณะที่ M15 เป็นขาขึ้น) ก็จะวาดโซนนั้นไว้บนกราฟ
เงื่อนไขการเข้าเทรด:
เมื่อราคาใน Timeframe เล็ก (LTF) วิ่งเข้ามาในโซน POI ที่ยังไม่เคยถูกใช้งาน
สคริปต์จะรอสัญญาณตาม i_entryMode ที่เลือกไว้ (รอ CHoCH หรือเข้าแบบ Aggressive)
เมื่อเงื่อนไขครบ จะคำนวณ SL และ TP จากนั้นจึงบันทึกการเทรดใหม่
ติดตามการเทรด: สำหรับเทรดที่ยัง "Active" อยู่ สคริปต์จะคอยตรวจสอบทุกแท่งเทียนว่าราคาไปถึง SL หรือ TP แล้วหรือยัง เมื่อถึงจุดใดจุดหนึ่ง จะบันทึกผลและสิ้นสุดการวาดกล่องบนกราฟ
## ส่วนที่ 5: การแสดงผลบนหน้าจอ
ส่วนนี้จะสร้างตาราง "Performance Dashboard" ที่มุมขวาบนของกราฟ เพื่อสรุปผลการทำงานแบบ Real-time:
M15 Bias: แสดงทิศทางของตลาดในปัจจุบัน
Total Trades: จำนวนเทรดทั้งหมดที่เกิดขึ้นในประวัติ
Win Rate: อัตราชนะ คิดเป็นเปอร์เซ็นต์
Total R-Multiple: ผลตอบแทนรวมจากความเสี่ยง (R) ทั้งหมด (ผลรวม RRR ของเทรดที่ชนะ ลบด้วยจำนวนเทรดที่แพ้) หากเป็นบวกแสดงว่ามีกำไรโดยรวม
📋 ข้อแนะนำในการใช้งาน
Timeframe ที่เหมาะสม: Indicator นี้ถูกออกแบบมาให้ใช้กับ Timeframe เล็ก (LTF) เช่น M1, M3 หรือ M5 เนื่องจากมันดึงข้อมูลจาก M15 และ M5 มาเป็นหลักการอยู่แล้ว
สไตล์การเทรด:
Confirmation: เหมาะสำหรับผู้ที่ต้องการความปลอดภัยสูง รอการยืนยันก่อนเข้าเทรด อาจจะตกรถบ้าง แต่ลดความเสี่ยงจากการเข้าเทรดเร็วเกินไป
Aggressive: เหมาะสำหรับผู้ที่ยอมรับความเสี่ยงได้สูงขึ้น เพื่อให้ได้ราคาเข้าที่ดีที่สุด
การเลือก Stop Loss:
"Swing ล่าสุด" และ "โซน POI" เป็นวิธีมาตรฐานตามหลัก SMC
"ATR" เหมาะกับตลาดที่มีความผันผวนสูง เพราะ SL จะปรับตามสภาพตลาด
"แท่งเทียนก่อนหน้า" เป็นวิธีที่เสี่ยงที่สุด เหมาะกับการเทรดเร็วและต้องการ RRR สูงๆ แต่ก็มีโอกาสโดน SL ง่ายขึ้น
การบริหารความเสี่ยง: Indicator นี้เป็นเพียง เครื่องมือช่วยวิเคราะห์ ไม่ใช่สัญญาณซื้อขายอัตโนมัติ 100% ผู้ใช้ควรมีความเข้าใจในหลักการของ SMC และทำการบริหารความเสี่ยง (Risk Management) อย่างเคร่งครัดเสมอ
การทดสอบย้อนหลัง (Backtesting): ควรทำการทดสอบ Indicator กับสินทรัพย์และตั้งค่าต่างๆ เพื่อให้เข้าใจลักษณะการทำงานและประสิทธิภาพของมันก่อนนำไปใช้เทรดจริง

ATR Stop-Loss with Fibonacci Take-Profit [jpkxyz]ATR Stop-Loss with Fibonacci Take-Profit Indicator
This comprehensive indicator combines Average True Range (ATR) volatility analysis with Fibonacci extensions to create dynamic stop-loss and take-profit levels. It's designed to help traders set precise risk management levels and profit targets based on market volatility and mathematical ratios.
Two Operating Modes
Default Mode (Rolling Levels)
In default mode, the indicator continuously plots evolving stop-loss and take-profit levels based on real-time price action. These levels update dynamically as new bars form, creating rolling horizontal lines across the chart. I use this mode primarily to plot the rolling ATR-Level which I use to trail my Stop-Loss into profit.
Characteristics:
Levels recalculate with each new bar
All selected Fibonacci levels display simultaneously
Uses plot() functions with trackprice=true for price tracking
Custom Anchor Mode (Fixed Levels)
This is the primary mode for precision trading. You select a specific timestamp (typically your entry bar), and the indicator locks all calculations to that exact moment, creating fixed horizontal lines that represent your actual trade levels.
Characteristics:
Entry line (blue) marks your anchor point
Stop-loss calculated using ATR from the anchor bar
Fibonacci levels projected from entry-to-stop distance
Lines terminate when price breaks through them
Includes comprehensive alert system
Core Calculation Logic
ATR Stop-Loss Calculation:
Stop Loss = Entry Price ± (ATR × Multiplier)
Long positions: SL = Entry - (ATR × Multiplier)
Short positions: SL = Entry + (ATR × Multiplier)
ATR uses your chosen smoothing method (RMA, SMA, EMA, or WMA)
Default multiplier is 1.5, adjustable to your risk tolerance
Fibonacci Take-Profit Projection:
The distance from entry to stop-loss becomes the base unit (1.0) for Fibonacci extensions:
TP Level = Entry + (Entry-to-SL Distance × Fibonacci Ratio)
Available Fibonacci Levels:
Conservative: 0.618, 1.0, 1.618
Extended: 2.618, 3.618, 4.618
Complete range: 0.0 to 4.764 (23 levels total)
Multi-Timeframe Functionality
One of the indicator's most powerful features is timeframe flexibility. You can analyze on one timeframe while using stop-loss and take-profit calculations from another.
Best Practices:
Identify your entry point on execution timeframe
Enable "Custom Anchor" mode
Set anchor timestamp to your entry bar
Select appropriate analysis timeframe
Choose relevant Fibonacci levels
Enable alerts for automated notifications
Example Scenario:
Analyse trend on 4-hour chart
Execute entry on 5-minute chart for precision
Set custom anchor to your 5-minute entry bar
Configure timeframe setting to "4h" for swing-level targets
Select appropriate Fibonacci Extension levels
Result: Precise entry with larger timeframe risk management
Visual Intelligence System
Line Behaviour in Custom Anchor Mode:
Active levels: Lines extend to the right edge
Hit levels: Lines terminate at the breaking bar
Entry line: Always visible in blue
Stop-loss: Red line, terminates when hit
Take-profits: Green lines (1.618 level in gold for emphasis)
Customisation Options:
Line width (1-4 pixels)
Show/hide individual Fibonacci levels
ATR length and smoothing method
ATR multiplier for stop-loss distance

ABCD Pattern FinderThis is a basic version: more robust implementations use zigzag structures and advanced filtering.
You may want to filter by Fibonacci ratios like 61.8%, 78.6%, or 127.2% depending on your preferred ABCD variation.

X ORTX ORT — Opening Range & Time Reference Tool
Overview
The X ORT indicator is a precision tool designed for intraday traders seeking to anchor their trading decisions to high-probability price levels. It captures key market reference points including Opening Ranges, Settlement Prices, and Time-Specific Opens, all based on New York time, to help identify potential pivots and directional bias in the market.
Key Features & Usage
🔹 Opening Range Boxes (ORs)
The indicator defines up to two customizable Opening Ranges (e.g., 9:30–9:59 and 8:20–8:49 ET). Each range dynamically tracks the high, low, and midpoint price as the session unfolds, and continues to extend those levels forward throughout the day.
Use as Pivots: The high and low of the Opening Range often act as intraday support and resistance zones. A breakout above the ORH (Opening Range High) may signal bullish intent, while a drop below the ORL (Opening Range Low) may suggest bearish momentum.
Use for Directional Bias: If price remains above or below the range after completion, it may indicate a continuation in that direction. The midpoint (dashed line) serves as a mean-reversion or fair value pivot.
🔸 Settlement Price Anchors
The indicator optionally plots Daily, Weekly, and Monthly Settlement Prices, which are significant institutional reference points.
Use as Market Anchors: Settlement prices are often used by professionals to gauge positioning. Price acceptance above or below settlement can signal strength or weakness and guide directional trades.
Historical weekly and monthly settlements help define multi-day or swing levels for broader context.
🔹 Time-Based Open Levels
X ORT also draws horizontal lines at the open price of specific time points: Midnight, 8:30 AM, 9:30 AM, and 1:30 PM ET.
Use for Session Anchors: These reference opens are useful for understanding session shifts, aligning with key economic releases (like 8:30 AM), and gauging session-to-session continuity.
Why Use X ORT?
Objective Structure: Provides rule-based levels to avoid emotional trading.
Visual Clarity: Transparent, extendable boxes and labeled lines help traders focus on key decision zones.
Multi-Time Context: Blends intraday and higher timeframe levels to support short-term and swing traders.
Whether you're breakout trading, fading range extremes, or gauging market bias, X ORT offers a reliable structural foundation that aligns with how professionals track price behavior throughout the trading day.

Liquidity Sweeps [SB1]Liquidity Sweeps
This indicator detects liquidity sweep events where price briefly breaks above or below recent swing points before reversing. These sweeps often occur during stop hunts, fakeouts, or liquidity grabs, and are commonly used by smart money traders to trap breakout participants before reversing direction.
🔍 What It Does
Identifies key swing highs and lows based on user-defined pivot strength.
Detects:
Bearish Sweeps: Price breaks a recent high but fails to close above it.
Bullish Sweeps: Price breaks a recent low but fails to close below it.
Tracks whether these sweeps are simply wicks, full breakouts and retests, or a combination of both.
Highlights these zones with boxes and labels to signal high-probability reversal or reaction zones.
🧠 Why Use It
Liquidity sweeps are often used by institutions and large players to trigger stops and create movement. Detecting these events helps traders:
Avoid chasing false breakouts
Time entries around exhaustion or reversal points
Align trades with Smart Money Concepts (SMC), ICT principles, or Order Block Theory
Avoid chasing false breakouts
Time entries around exhaustion or reversal points
Align trades with Smart Money Concepts (SMC), ICT principles, or Order Block Theory
⚙️ Settings & Customization
Swings: Adjusts the sensitivity of swing high/low detection.
Detection Type:
Only Wicks: Detects when a wick pierces a level but closes back inside.
Only Outbreaks & Retests: Detects when a candle breaks out and later retests.
Wicks + Outbreaks & Retests: Shows both types for full coverage.
Extend Zones: Draws boxes across future bars until invalidation.
Colors: Fully customizable for bullish and bearish sweeps.
🧬 Original Enhancements
This script is based on open-source work by LuxAlgo and has been significantly enhanced with:
Multiple detection modes
Real-time alert support📣 📣
Efficient pivot memory cleanup📣 📣
Sweep zone auto-extension until broken
Improved visual clarity with dotted/dashed lines, and color-coded boxes
✅ Note: The original version had no alerts. This version adds real-time detection alerts for practical trading use. Credit: Original swing detection logic inspired by LuxAlgo’s open-source Liquidity Sweep framework. This version is extended and modified under the terms of the CC BY-NC-SA 4.0 license.
📣 📣 Alerts Included📣📣
🔼 Bullish Wick Sweep📣
🔽 Bearish Wick Sweep📣
These alerts allow traders to be notified the moment a liquidity sweep occurs, providing immediate edge for reactive or anticipatory trading.
📈 How to Use It
Add to your chart.
Choose the detection type based on your trading style:
Wicks for reversals and stop hunts
Outbreaks for failed breakouts or retests
Wait for sweep zones to form and monitor price behavior around them.
Use in conjunction with:
Fair Value Gaps (FVG)
Order Blocks
VWAP Anchors
Market Structure Breaks

SymFlex Band - RSI-MAD Asymmetric
🔮 SymFlex Band – RSI-MAD Asymmetric Band by Kwang Il Lee
Source: surirang.com
The SymFlex Band is a unique asymmetric envelope built on a hybrid concept that fuses RSI momentum dynamics with MAD (Mean Absolute Deviation). Unlike traditional symmetric bands (like Bollinger Bands or Keltner Channels), this band expands and contracts asymmetrically, reflecting the directional momentum of the market.
🎯 Core Innovation
🔸 RSI-Based Asymmetry
This band is not centered merely on price volatility. Instead, it uses the RSI's deviation from the neutral line (50) to determine whether bullish or bearish pressure is dominating — dynamically expanding or compressing the upper/lower bands accordingly.
🔸 MAD-Weighted Scaling
To ensure the band responds accurately to real price deviation, MAD is used instead of standard deviation or ATR. It provides a more robust and median-sensitive envelope for noisy or volatile markets.
🔸 Dynamic Adaptation
The band is adaptive in both direction and width:
When RSI rises above 50, the upper band stretches wider.
When RSI falls below 50, the lower band stretches instead.
A minimum width threshold ensures stability.
📈 How to Use
Use breakouts from the band as potential trend signals.
Confirm market strength via table: Check if price is “In Range” or breaking out.
Monitor the correlation between MAD and RSI in the dynamic table to detect momentum sync.
🔍 Technical Notes
Supports multiple MA types (SMA, EMA, TEMA, DEMA, Zerolag, etc.) as the band basis.
Designed for both trend-following and range-trading interpretations.
Fully responsive to different market conditions through minimal user inputs.
🚨 Note: This is not a combination of unrelated indicators. The RSI-MAD structure is purpose-built to represent a new type of envelope based on directional momentum and deviation sensitivity.

HEMA Trend by Rostek (Filters + ATR + RR) For testing by anyone. Enjoy! :)
HEMA Trend Levels with Gradient, ATR-based SL & TP, HTF Filter, and R/R Statistics
This advanced indicator is designed to help you detect high-quality trend crossovers using HEMA (Hull Exponential Moving Average) smoothing logic. It integrates dynamic visualization, strong multi-layer filters, and risk management levels — all in one package.
✅ Core Concept
The indicator plots two HEMAs (fast and slow), with a gradient fill between them that dynamically changes color based on the trend direction. Crossovers between these HEMAs generate potential trade signals (long or short).
🎨 Key Visual Features
Smooth gradient fill area between fast and slow HEMA.
Dynamic arrows marking crossover points (precisely above/below HEMA cross).
Optional ATR-based Stop Loss (SL) and Take Profit (TP) levels shown as dashed lines with labels.
Automatic display of calculated Risk/Reward (R/R) ratio next to TP level.
⚙️ Powerful Filters
You can enable/disable each of these filters individually:
✅ EMA Filter — Confirm signals only when the price is above/below a selected EMA (default: 100).
✅ ADX Filter — Confirms signals only if ADX value exceeds a set threshold (default: 20).
✅ RSI Filter — Filter signals based on RSI value (e.g., >50 for longs, <50 for shorts).
✅ Higher Time Frame (HTF) EMA Filter — Only take signals aligned with a higher timeframe EMA trend (e.g., daily EMA 100).
📏 Risk Management Features
ATR-based Stop Loss (SL): Dynamic stop level calculated using ATR, configurable multiplier (e.g., 1.5 × ATR).
ATR-based Take Profit (TP): Dynamic take profit level based on ATR, configurable multiplier (e.g., 3 × ATR).
Risk/Reward Statistics: Calculates and displays R/R ratio on the chart to help visually evaluate trade setups.
🔔 Alerts
A single unified alert condition for both long and short filtered signals, making it easy to set up TradingView alerts.
⚡ Usage Tips
Adjust HEMA lengths (default: 20 & 40) to tune responsiveness.
Enable/disable filters depending on your strategy and market conditions.
Fine-tune ATR multipliers for SL/TP based on your risk tolerance.
Use HTF filter to trade only in the direction of the main higher timeframe trend.
✅ Ideal for
Trend-following traders who want smoothed entries.
Traders looking for integrated visual risk management levels.
Users who want precise, customizable signals with strong filtering logic.

Avg High/Low Lines with TP & SL아래 코드는 TradingView Pine Script v6으로 작성된 스크립트로, 주어진 캔들 수 동안의 평균 고가와 저가를 계산해서 그 위에 수평선을 그리며, 해당 수평선 돌파 시 진입 가격을 기록하고, 손절가(SL)와 목표가(TP)를 자동으로 계산하여 표시하는 전략입니다. 알림(alert) 기능도 포함되어 있습니다.
코드 주요 기능 요약
length 기간 동안 평균 고가, 저가를 단순 이동평균(SMA)으로 계산
평균 고가선, 저가선 수평선을 일정 바 개수만큼 좌우 연장하여 차트에 표시
평균 고가 돌파 시 매수 진입, 평균 저가 돌파 시 매도 진입 처리
진입 가격 저장 및 상태 관리 (inLong, inShort 플래그)
손절가(SL): 롱이면 평균 저가, 숏이면 평균 고가
목표가(TP): 진입가에서 손절 거리의 1.5배만큼 설정
진입가 기준으로 TP, SL 라인과 라벨 표시
상단 돌파 후 종가 마감 시 매수 알림, 하단 돌파 후 종가 마감 시 매도 알림
Sure! Here’s the English explanation of your TradingView Pine Script v6 code:
Summary of Key Features
Calculates the simple moving average (SMA) of the high and low prices over a user-defined number of candles (length).
Draws horizontal lines for the average high and average low, extending them a specified number of bars to the left and right on the chart.
Detects breakouts above the average high to trigger a long entry, and breakouts below the average low to trigger a short entry.
Records the entry price and manages trade states using flags (inLong, inShort).
Sets the stop loss (SL) at the average low for long positions, and at the average high for short positions.
Calculates the take profit (TP) level based on the entry price plus 1.5 times the stop loss distance.
Draws lines and labels for the TP and SL levels starting from the entry bar, extended to the right.
Sends alerts when the price closes above the average high after a breakout (long signal), or closes below the average low after a breakout (short signal).
-onestar-
