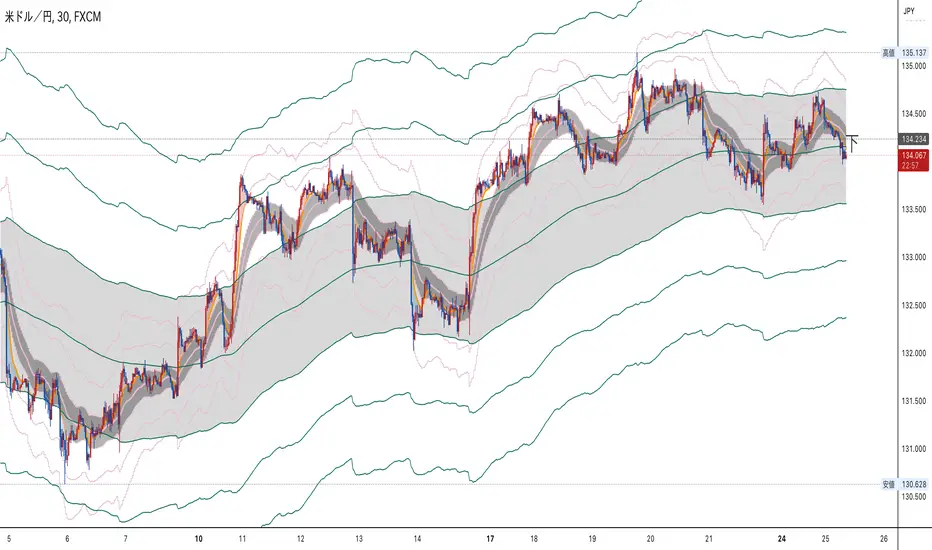
LIZ-ATR-Based EMA EnvelopesThis envelope has an "auto band adjustment function" that reflects the most recent volatility in the band width by ATR.
This makes it easy to handle without the need to change the band width according to the volatility of the stocks to be displayed.
The time periods and colors of each time frame that can be displayed and the central band of the envelope are as follows.
Monthly: 2-year line (light blue)
Weekly: 3-month line (black)
Daily: 1 month line (blue)
4-hourly: 1-week line (green)
1 hour: 24 hour line (purple)
30-minute: 12-hour line (light purple)
15-minute: 4-hour line (orange)
5min:2hr (skin color)
1 minute: 30 minute line (gray-blue)
30 seconds: 10 minute line (blue-purple)
15-seconds: 7.5-minute line (sky blue)
10-seconds: 5-minute line (brown)
5-seconds: 2-minute line (emerald green)
Depending on where the price resides in the band, the following situations can be identified
・When inside the first band: Trendless
・Between the first and second band: Normal trend
・Between the 2nd and 3rd band: Strong trend
・When the third line is exceeded: Overheat condition
The first range is painted in gray and encourages not to follow the trend. In addition, the "up" sign will automatically light up when the price is above this gray zone, the "middle" sign when the price is in the middle of the gray zone, and the "down" sign when the price is below the gray zone.
このエンベロープは直近のボラティリティーをATRによってバンド幅に反映させる、「オートバンド調整機能」を搭載しています。
そのため、表示させる銘柄のボラティリティーに合わせてバンド幅を変更する必要がなく扱いやすいです。
表示できる各時間足と、エンベロープの中心バンドの期間・色は、以下の通りです。
月足:2年線(水色)
週足:3ヶ月線(黒)
日足:1ヶ月線(青)
4時間足:1週間線(緑)
1時間足:24時間線(紫)
30分足:12時間線(薄紫)
15分足:4時間線(オレンジ)
5分足:2時間線(肌色)
1分足:30分線(グレーブルー)
30秒足:10分線(青紫)
15秒足:7.5分線(スカイブルー)
10秒足:5分線(茶色)
5秒足:2分線(エメラルドグリーン)
価格がバンドのどこに存在するかによって以下の状況がわかります。
・1本目のバンド内側にある時:トレンドレス
・1本目から2本目の間にある時:ノーマルトレンド
・2本目から3本目の間にある時:強いトレンド
・3本目をオーバーしている時:過熱状態
1本目の範囲はグレーで塗られ、トレンドフォローしない事を促します。また、このグレーゾーンの上に価格がある時は「上」、中にある時は「中」、下にあるときは「下」の文字サインが自動点灯します。
Average True Range (ATR)
kaptanFantastik[Take Profit and Stop Loss Finder]Hello all,
It's ATR based active take profit & stop loss finder.
You can set multipliers for taking profit and stop losing and you can change the price source for the calculation. Also, you can change the ATR level.
Defaults are my best settings. 2.2x for taking profit and 1.5x for stop losing. Open price is the source. Also, I think 5 ATR is the best for day and swing trade.
Levels are determined according to the open prices (This is because we can enter the position after our other indicators give the signal following the close price. Yet, you can change it). Since it's active and based on my calculation with ATR values, percentages for the taking profits and stop losing may change. Because of this, you need to note the take profit and stop lose prices after your entry price level is determined by the other indicators for the best success rates.
It can be used in any time frame with the other indicators to determine the best entry points. For example, 3 EMA levels with 5,8 and 13 is good option for the entry. You can enter the position when 5 crosses up 8 and both are above the 13. You can also use custom more advanced buy/sell indicators with this one for entry points.
It can be used with any asset from cryptocurrency to the stocks, from forex to gold etc.
Hint: You can set your levels lower than the take profit prices to maximize the success rate.
Note: Market should be open for the positions.
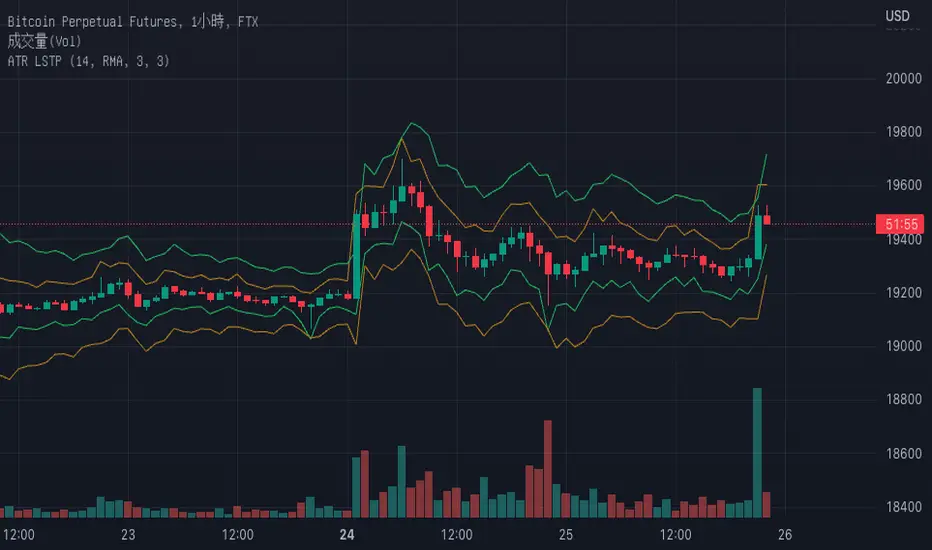
Example trade on the 5-minute timeline.
The below chart has both my custom indicator and the 3 EMAs mentioned above.
Trade 1: Entry price: 19191, Take Profit: 19276. Profit 0.44%
Trade 2: Entry price: 19189, Take Profit: 193009. Profit 0.625%
Türkçe bilen kullanıcılar için açıklama
Herkese merhabalar,
ATR tabanlı aktif kar al ve zararı durdur bulucu.
Kar almak ve zararı kesmek için çarpanlar belirleyebilir ve hesaplama için fiyat kaynağı değiştirebilirsiniz. Ayrıca, ATR seviyesini de değiştirebilirsiniz.
Varsayılanlar benim en iyi ayarlarım. Kar almak için 2,2 kat ve zararı durdurmak için 1,5 kat. Açılış, fiyat kaynağıdır. Ayrıca, 5 ATR'nin günlük ve kısa vade (swing trade) için en iyisi olduğunu düşünüyorum.
Seviyeler açılış fiyatına göre belirlenir (Çünkü diğer göstergelerimiz kapanış fiyatının ardından sinyal verdikten sonra pozisyona girebiliyoruz. Yine de bunu değiştirebilirsiniz). Aktif olduğu için ve ATR değerleri ile yaptığım hesaplamaya göre kar alma ve zarar kes yüzdeleri değişebilir. Bu nedenle, en iyi başarı oranları için; giriş fiyat seviyeniz diğer göstergeler tarafından belirlendikten sonra kar al ve zararı durdur fiyatlarını not etmeniz gerekir.
En iyi giriş noktalarını belirlemek için diğer göstergelerle herhangi bir zaman diliminde kullanılabilir. Örneğin, 5,8 ve 13 ile 3 EMA seviyesi giriş için iyi bir seçenektir. 5, 8'i geçtiğinde ve her ikisi de 13'ün üzerinde olduğunda pozisyona girebilirsiniz. Giriş noktaları için bununla birlikte daha gelişmiş özel al/sat göstergelerini de kullanabilirsiniz.
Kripto paradan hisse senetlerine, forexten altına vb. her türlü varlıkla kullanılabilir.
İpucu: Başarı oranını en üst düzeye çıkarmak için seviyelerinizi kar alma fiyatlarından daha düşük ayarlayabilirsiniz.
Not: Pozisyonlar için piyasa açık olmalıdır.
5 dakikalık zaman çizilgesinde örnek işlem.
Yukarıdaki örnek grafikte hem özel indikatörüm hem de yukrıda belirtilen 3 EMA var.
İşlem 1: Giriş fiyatı: 19191, Kazanç Al: 19276. Kar %0.44
İşlem 2: Giriş fiyatı: 19189, Kazanç Al: 193009. Kar %0.625

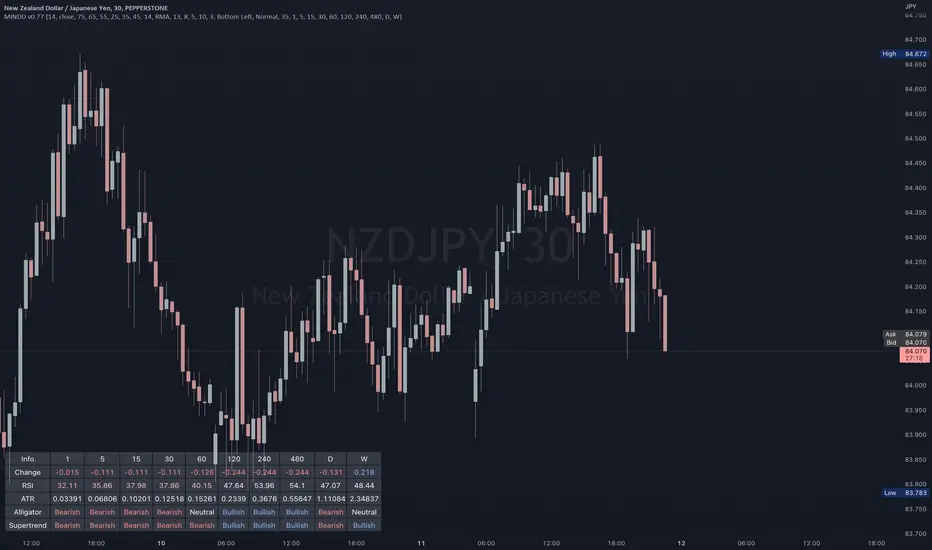
Multi IND Dashboard [Skiploss]Multi IND Dashboard is dashboard combine with price change, RSI, ATR, Alligator and Supertrend. With a maximum of 10 timeframes, I think it's going to make your life easier. In looking at the momentum of each chart.
How it work??
Change :
It is the distance from the close price of previous candlestick and shows the movement value of the candlestick in that timeframe.
RSI :
Default setting are 14 and source close
Value >= 75 : Fill text color maximum overbought
Value >= 65 : Fill text color medium overbought
Value >= 55 : Fill text color minimum overbought
Value >= 45 : Fill text color minimum overbought
Value >= 35 : Fill text color medium overbought
Value >= 25 : Fill text color maximum overbought
ATR :
Default setting are 14 length and RMA smoothing, It like the average swing of the candlesticks.
Alligator :
Default setting are 13, 8 and 5
Bullish status is value lips > teeth and teeth > jaw
Bearish status is value lips < teeth and teeth < jaw
Neutral status status is value lips > teeth and teeth < jaw or lips < teeth and teeth > jaw
Supertrend :
Default setting are 8 and 3.0
Bullish status is uptrend
Bearish status is downtrend
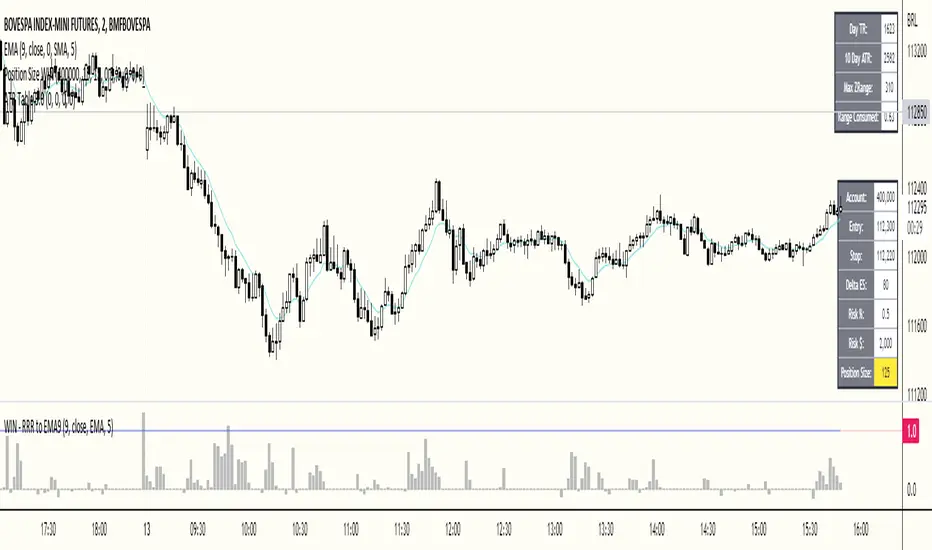
ATR+This is an indicator which uses the ATR (average true range) to calculate take profit levels, stop loss levels, and position sizing.
It acts an ATR indicator, based on concepts found in the No Nonsense Forex (NNFX) trading system.
ATR works by looking at the past N periods (14 by default) to see on average, how many pips or dollars an asset has moved. It is widely used by itself or as part of another indicator.
This script also implements money/risk management to determine:
Take Profit : 1.00x ATR (default)
Stop Loss : 1.50x ATR (default)
Risk : 2% of account size (default)
Position Sizing : How many lots/shares/units you need to achieve the indicated risk
Trade Value : The total cost of the lots/shares/units
This indicator only displays information in the status line. It does not guarantee a successful trade, and is only intended to be used to calculate take profit and stop loss levels, or as a point of reference when entering trades. Always do your own research.

1st Gray Cross Signals ━ Histogram SQZMOM [whvntr][LazyBear]This is the Histogram Version of one of my other indicators named: SQZ Momentum + 1st Gray Cross Signals (with arrows) Which is a modification of "Squeeze Momentum Indicator" by user: "LazyBear". In that indicator of his he described, and suggested, the use of his gray cross signals to find points of interest for trading based on the direction of momentum when the first gray cross appears... I have programmed these points, and highlighted them, for ease of use. The 1st gray cross strategy, he said , is from John F. Carter's book, Chapter 11, "Mastering the Trade".
Here we have the Histogram version, with background highlights only, and nothing on the chart, in true SQZ Momentum style.
Disclaimer: using this indicator, or any indicator anywhere, involves risk when trading and isn't a guarantee of 100% accurate results.

ATR Oscillator - Index (Average True range Oscillator)The purpose of converting the ATR value indicator to an oscillator;
It is known that the ATR value is not between the two specified values. So it is not compressed between 0 and 100 like RSI and %B etc. Therefore, conditions such as "A condition if ATR value is X, B condition if ATR value is Y" cannot be created. In order to create these conditions, the max and min value range of the ATR value must be determined. This indicator converts the ATR values into a percentage number according to the maximum and minimum ATR values in the period you will choose. Max value is 100, min value is 0. The considered ATR value, on the other hand, corresponds to the % of the difference between the max and min value in the selected period.
In this way, conditions such as "If the ATR Oscillator value is greater than 10 or 20 or 30" can now be created, or the value of another indicator can be calculated based on the ATR Oscillator value. For example; Let's say we want the standard deviation of BBand to change according to the value of the ATR Oscillator. If BBand Standard Deviation is 3 if ATRO value is 100, BBand Standard Deviation is 2 if ATRO value is 0, and BBand Standard Deviation is 2.5 when ATRO value is 50;
We can encode it as BBand_Std_Dev=((ATRO*0.01)+2 )
If the ATRO value is between .... and ...., you can make improvements such as plot color X.

Trendly
╭━━━━╮╱╱╱╱╱╱╱╱╭┳╮
┃╭╮╭╮┃╱╱╱╱╱╱╱╱┃┃┃
╰╯┃┃┣┻┳━━┳━╮╭━╯┃┃╭╮╱╭╮
╱╱┃┃┃╭┫┃━┫╭╮┫╭╮┃┃┃┃╱┃┃
╱╱┃┃┃┃┃┃━┫┃┃┃╰╯┃╰┫╰━╯┃
╱╱╰╯╰╯╰━━┻╯╰┻━━┻━┻━╮╭╯
╱╱╱╱╱╱╱╱╱╱╱╱╱╱╱╱╱╭━╯┃
╱╱╱╱╱╱╱╱╱╱╱╱╱╱╱╱╱╰━━╯
About the script:
This script is an easy-to-use trend indicator, which is based on another popular indicator called "Supertrend" . The basic idea is very simple, i.e. to compute Average True Range(ATR) and use that as the basis for trend detection. The key difference lies in a custom trend detection method, that computes trends across different timeframes and projects them in a table view. The script also tries to improve the behaviour of the existing indicator by highlighting flat regions on the chart, indicating sideways market or potential trend reversals.
How to use it:
You can use it just like any other indicator, add it to your chart and start analysing market trends. Results can be interpreted as follows.
Indicator output is currently made up of two main components:
>> Trend Table:
Appears at the bottom right of your screen
Contains trend indicator for 9 different timeframes
Timeframes can be adjusted using indicator settings panel
Green Up Arrow --> Up Trend
Red Down Arrow --> Down Trend
>> Enhanced Supertrend:
Shows up as a line plot on the chart
Green line indicates up trend
Red line indicates down trend
White regions indicates slow moving markets or a potential trend reversal
Indicator can be used on any timeframe, it provides a view of current and historical market trend
Can be used as an indicator for entering/exiting trades
Can be used to build custom trading strategies

BankNifty Dash
This indicator to be used only in BankNifty , shows Values of BankNifty Index & its top constituents.
Dashboard Interpretation :
LTP - Last Traded Price.
D High - Day High.
D Low - Day Low.
I Points - Shows the contribution of top BankNifty constituents according to its weightage.
PH-PL - "PH - PL" means LTP is trading between Previous Days High( PH ) & Previous Days Low( PL ) which indicates Rangebound-ness.
"+ PH" means LTP is trading above Previous Days High( PH ) which indicates Bullish-ness.
"- PL" means LTP is trading below Previous Days Low( PL ) which indicates Bearish-ness.
ATR - Displays the Daily ATR (Average True Range) (14 period).
DTR - Current Day Range.
DTR% - Current Day Range percentage.
( DTR & DTR%, changes colour based on percent value. < 61.8 is green and > 61.8 is red.)
For example if the Daily ATR is 100 and the current range of the day is 200 this would be 200% the original move.
EMA:-
Default value of 5 is used in Fast EMA.
Default value of 21 is used in Slow EMA.
Default value of 200 is used in EMA (Used for trend direction).
User can change values from input section.
If the colour filled between Fast EMA and Slow EMA is green, the market is in a uptrend
If the colour filled between Fast EMA and Slow EMA is red, the market is in a downtrend.
ADR :-
Plots ADR (Average Day Range) zones are used as support and resistance, ADR zones are calculated using a 5 or 10 day period unless you change the settings.
PDH/PDL :-
Plots Previous Day High(PDH) and Previous Day low(PDL).

Remaining ATR [vnhilton]ATR levels can be used on a trading day to look for overextensions beyond the average, where you can look to take profits. Remaining ATR is calculated as the current day range subtracted by the previous day ATR. RATR is then plotted away from the high & low lines. All lines (except for the day open) are dynamic, so RATR lines will move according to how much RATR remains.
Note: This indicator only works on intraday timeframes
(FEATURES)
- Works on either RTH or ETH sessions
- Select Day ATR period, & 3 multipliers that will be applied to RATR values away from respective intraday high & low
- Extend current lines to the right
- Show recent lines only
- Change line style, colours within & out the intraday range, & thickness
- Change label offset, size, & colours within & out the intraday range
- Hide RATR lines & labels when within intraday range
- Plot fill between lines (note: RATR plot fills are from their lines to the intraday high & low, so there'll be overlapping)
To show more lines in the past, go to higher intraday timeframes.
Same chart & timeframe as above but on RTH session only.

Volatility Compression Ratio by M-CarloHello traders. I created this simple indicator to use as a FILTER.
He does not provide any operational signals but tells us if we are in a period of volatility compression or expansion and it can work on all market.
This filter works great for all strategies that work on breakouts
The concept is this: I will enter at breakout of a price level that I consider important, only if there is a volatility compression and not in the case of expansion of volatility.
Technically the calculation is very simple:
Step 1: I calculate the ATR at "x" periods, I set 7 by default because I get better results but you can change it as you like using the "atr length" field. You can also choose whether to calculate the ATR via RMA, SMA or EMA.
Step 2: I Calculate a simple average of the previous ATR over a longer period, longer period than set with the "length multiplier" parameter, which multiplies the "atr length" value by "x" times. Here I set the default 3 but you can change it as you like.
Step 3: I divide the ATR value calculated in step1 by its long-term average calculated in step2, obtaining a value that will oscillate above and below the value of 1
So:
if the indicator is above the value of 1 it means that volatility is expanding
If the indicator is below the value of 1 it means that we are in a period of volatility compression (and as we know volatility explodes sooner or later)
If you have any questions write to me and I hope this filter helps you! Have good Trading!

Position Size and PNL CalculatorPosition Size and PNL Calculator is a Tool indicator which will help trader determine Trading's Position Size base on many risk management method such is Risk Per Trade, Fix Position Size, Fix Initial cost. The stoploss of the order will be set after ATR Stoploss method like my lasted Indicator ATR Stop Loss and Take Profit Finder .
This Tool is using the concept of
- ATR ( Average True Range )
- Risk Reward Ratio (Money Management method)
- Leverage Position Size Calculation
- Leverage PNL Calculation
- Risk Per Trade money management for calculating the size of position base on Account Balance and Risk
How Position Size and PNL Calculator working?
1) The tool will let user Input time and price that trader are entering the order. Then trader have to select the direction of trade, weather it is long position or short position
2) Next It will use entry price to Calculate the Stoploss price buy Calculating its ATR according to the setting then, then The entry price will be plus/mins by ATR*Multiply to get a Stoploss price
3) then we will * Risk Reward Ratio to the distance of stoploss in order to create Takeprofit price
4) After then the tool will simulate and calculate Initial cost/Initial position size base on your setting, and will display Stoploss Price, Take Profit Price, PNL% of Loss if Stoploss is trigger, PNL% of Gain if Take profit is Trigger and current RR/ PNL%
5) User can adjust the leverage and other setting in Indicator setting
How to use Position Size and PNL Calculator
As it was mention, Position Size and PNL Calculator is just a tool that help trader determine Trading's Position Size, PNL and risk management. Trader must use this tool only as a Position Tracking after you help entry order with your our trading strategy

Average True Range Refurbished💡 Objective
This script is a rebuild of the pre-existing ATR indicator, with improvements and fine-tuning.
🪄Improvements
1. Normalization option (range 0 to 100)
2. Optional calculation of the ratio between current volatility and average volatility
3. Optional smoothing
4. Show a moving average
5. Show Bollinger Bands with 3 bands
6. Change bar colors according to ATR and Bollinger Bands
📚 Definition
'The Average True Range (ATR) is a tool used in technical analysis to measure volatility. Unlike many of today's popular indicators, the ATR is not used to indicate the direction of price. Rather, it is a metric used solely to measure volatility, especially volatility caused by price gaps or limit moves.'
(TradingView)

ATR & APCAverage True Range (ATR) and Average Price Change (APC). Shows the ATR and APC as well as the TR and PC for the current bar, colour coded to indicate very large/small bars. The ATR and APC are also colour coded to reflect whether they are increasing or decreasing. Style will need to be customized.

ATR / Volatility / Leverage [JoseMetal]============
ENGLISH
============
- Description:
This is a utility indicator, it prints a table with ATR for 3 custom timeframes, using the ATR of basis, it calculates volatility (%) and a recommended leverage depending on your risk settings.
I use this tool to determine the leverage for each asset and keep the same risk management for all of them.
- Visual:
It shows a table with ATR, volatility and leverage for 3 timeframes.
For each timeframe it also prints 2 periods, short and long, also customizable, so you can determine the range.
- Customization:
You can customize up to 3 different timeframes, ATR short and long length, as well as a multiplier.
There's a risk setting that you should tweak depending on your way to trade.
Everything else customizable (as usual in my scripts), colors, indicator settings etc.
- Usage and recommendations:
Default settings are my own, feel free to tweak them as you wish, i usually trade on 4H using 1-2% of my account balance per trade with low leverage, so you probably want to increase the risk setting, that's also extremely recommended if you trade forex and metals, because i trade crypto mainly.
Enjoy!
============
ESPAÑOL
============
- Descripción:
Este es un indicador de utilidad, muestra una tabla con ATR para 3 temporalidades personalizables, usando el ATR de base, calcula la volatilidad (%) y un apalancamiento recomendado dependiendo de tu configuración de riesgo.
Yo uso ésta herramienta para determinar el apalancamiento para cada activo y mantener la misma gestión de riesgo para todos ellos (no tiene sentido ir a 5x en BTC y 5x en ORO, por ejemplo... ésta utilidad resuelve ese problema).
- Visual:
Muestra una tabla con el ATR, la volatilidad y el apalancamiento para 3 temporalidades.
Para cada temporalidad también muestra 2 rangos de periodización, corto y largo, también personalizables, para que puedas determinar de un vistazo los rangos en los que se mueve.
- Personalización:
Puedes personalizar hasta 3 temporalidades diferentes, la longitud del ATR corto y largo, así como un multiplicador.
Hay un ajuste de riesgo que debes ajustar dependiendo de tu forma de operar.
Todo lo demás es personalizable (como es habitual en mis scripts), colores, configuración de los indicadores, etc.
- Uso y recomendaciones:
Los ajustes por defecto son los míos, siéntete libre de ajustarlos como desees, yo suelo operar en 4H utilizando el 1-2% del saldo de mi cuenta por operación con un bajo apalancamiento, por lo que probablemente quieras aumentar el ajuste de riesgo, eso también es muy recomendable si operas fórex y metales, porque yo tradeo cripto principalmente.
¡Que lo disfrutes!

ATR Table 2.0ATR Table 2.0
This script was created in order to display a table that "calculates" how far the price can go on the current day .
The script is a table with 3 lines that calculates:
First Line - Day TR: The True Range of the current day ( - , including an Opening GAP if it exists);
Second Line - 10 Day ATR: The Average True Range of the asset (including Opening GAPs) for the last 10 days;
Third LIne - Range Consumed: How much of the 10 Day ATR it was consumed on the current day.
Example of how to use the information on the table and the understanding of it's purpose:
1) Supose you are day trading an asset that, during the last 10 days, have moved around $1.00 a day - This is the 10 Day ATR.
2) On this day, after 2 hours of the opening market, the price have already moved $0.50 (supose that it has moved $0.30 up and $0.35 down from the close of the prior day and the price is now near the close of the prior day).
3) In this situation, knowing that the price often moves around $1.00 a day, and knowing that it already moved $0.65 ($0.30 up and $0.35 down based on the close of the prior day), you may pay attention when the price breaksthrough the max or the min of the day, cause it can still move $0.35 in that direction ($1.00 - $0.65).
----------------------------------------------
ATR Table 2.0
Esse script foi criado para disponibilizar uma tabela que "calcula" quanto o preço pode andar ainda no dia em questão .
O script é uma tabela com 3 linhas que calcula:
Primeira Linha - TR do Dia: O Range Verdadeira do dia em questão ( - , incluindo GAP de Abertura se for o caso);
Segunda Linha - ATR de 10 Dias: A média do Range Verdadeira do ativo (incluindo GAPs de abertura) dos últimos 10 dias;
Terceira Linha - Range Consumido: O quanto do ATR de 10dias já foi consumido no dia em questão.
Exemplo de como usar essa informação na tabela e o entendimento do seu propósito:
1) Suponha que você está realizando day trade de um ativo que, durante os últimos 10 dias, se move em torno de $1.00 por dia. Esse é o ATR de 10 dias.
2) Nesse dia, após 2 horas da abertura do pregão, o preço já se moveu $.050 (suponhamos que ele tenha se moveu $0.30 para cima e $0.35 para baixo a partir do fechamento do dia anterior e agora o preço está próximo do fechamento do dia anterior).
3) Nessa situação, sabendo que o preço se move por volta de $1.00 por dia, e sabendo que ele já se moveu $0.65 ($0.30 pra cima e $0.35 pra baixo a partir do fechamento do dia anterior), você deve se atentar para quando o preço romper a máxima ou a mínima do dia, pois ele pode se mover ainda $.035 na direção do rompimento ($1.00 - $0.65).
ATR+ Advanced Sessions ATR for DaterangeATR+ Advanced Sessions ATR for Daterange
The ATR+ adds the following additional filters to the stock ATR indicator by Tradingview:
- Calculates the overall average ATR for a user defined daterange, optionally filtered by trading session and selected weekdays, presented as a secondary line over the standard ATR line.
- Basic ATR line, with colour highlight to indicate the selected sessions, days and timeframe being calculated by the average ATR+ line.
- Average ATR+ line indicating the average of all ATRs within the defined timeframe, optionally filtered by instances of a selected trading session and selected weekdays.
- Customisable appearance.
- The ATR+ also includes the basic ATR configuration options typically found in the standard ATR by Tradingview, including period length and smoothing type. Defaults are set to the factory standards: 14 length, RMA smoothing type.
What Is the Average True Range (ATR)?
The ATR is a technical analysis tool that measures market volatility by decomposing the entire range asset price for that period. Investopedia describes the ATR as follows:
"The average true range (ATR) is a technical analysis indicator, introduced by market technician J. Welles Wilder Jr. in his book New Concepts in Technical Trading Systems, that measures market volatility by decomposing the entire range of an asset price for that period.
The true range indicator is taken as the greatest of the following: current high less the current low; the absolute value of the current high less the previous close; and the absolute value of the current low less the previous close. The ATR is then a moving average, generally using 14 days, of the true ranges."
For more information on the ATR and its calculations and use cases, see here:
Investopedia link here.
Tradingview link here.
Note
The indicator may time out if the number of bars being calculated is too long. If this happens, you will need to reduce the datetime range, or increase the chart timeframe in order to reduce the number of bars being calculated and the indicator will attempt to recalculate.

Interactive ATR Stop-Loss [TANHEF]This indicator is "Interactive" which means some inputs can are manually added through the first click after adding the indicator to the chart (ATR Trailing Stop-loss start point). See images below for more explanation.
Why use a trailing stop-loss?
A trailing stop-loss provides an exit when price moves against you but also enables you to move the exit point further into profit when price is moving in the desired direction of a trade. The ATR (Average True Range) which is used to measure volatility, is very effective at functioning as a trailing stop loss.
Indicator Explanation
Initially when this indicator is added to the chart, you will be prompted to select where to begin the ATR Trailing Stop-loss.
For a long stop-loss, select below price.
For a short stop-loss, select above price.
After this indicator is placed, it can be modified via dragging or from within the settings by modifying the time and the price input. Or simply re-add the indicator to the chart.
The ATR Stop Loss plotted. Note that the trailing value that is considered as the stop loss value is the value of the ATR from the prior candle. The settings for the ATR calculation can be modified within the settings.
An optional fixed profit target can be added within the settings. This profit target will only actively be plotted when the ATR Trailing Stop-loss has not be hit hit yet or until the profit target has been hit.
Here shows that the profit target was hit, then later on the ATR Trailing Stop-loss was hit.
Note, trailing stop-loss will continue to be plotted until it has been hit regardless of the profit target being hit or not.
Alerts
1. 'Check' alerts to use within indicator settings (trailing stop hit and/or profit target hit).
2. Select 'Create Alert'
3. Set the condition to 'Interactive ATR''
4. Select create.

Average True Range with stop loss and take profit finderBased on the official original average true volatility (ATR), two functions have been extended.
Users can see the suggested stop loss and take profit parameters when entering a long or short order with each K-line.
Part of the settings:
Length: The preset is 14 K lines, which can help you grab the suggested stop loss point.
Long-short single profit-loss ratio: After entering the value of the profit-loss ratio (floating point) you want, it will automatically convert and calculate the past take-profit point.
The five values displayed on the chart are from left to right: ATR, Short Stop Loss, Long Stop Loss, Short Take Profit, and Long Take Profit.
ATR - Average True Range + Dynamic Trend w/ Signals | by Octopu$↕ ATR - Average True Range + Dynamic Trend w/ Signals | by Octopu$
What is ATR?
ATR stands for Average True Range
A Technical Analysis Indicator that measures market volatility by decomposing the range of a Security Price in a specific period.
The ATR can be used as a High Low Spectrum,
As well as a variation of a Moving Average, considering the ranges on a timeframe, generally this being 14 days.
Shorter periods can be used (will generate more signals) or longer periods for steadier trends (for fewer signals)
A ticker on a high volatility has a high ATR.
A ticker on a low volatility has a low ATR.
It is an useful resource for a trading system:
Can be used to enter or exit trades and/or also measure the daily spectrum of a stock.
Does not necessarily points price direction, but takes into account gaps and strong legs.
Can also be used as trading positions confirmation,
Rather be it for stop losses or take profits,
As well as setting trailing stops or limit orders.
This tool offers a great Risk to Reward Ratio, considering the fact you will be aware of the possible moves that an asset can perform.
This indicator should not be used as a standalone tool.
(The combination of factors relies on your own knowledge about Confluence Factors along with your Due Diligence)
This indicator is not an advice to buy or sell securities.
www.tradingview.com
SPY
ANY Ticker. ANY Timeframe.
(Used SPY 5m as Example only)
Features:
• ATR ( Average True Range )
• Range UP and DOWN
• Movement from Price Line
• Dynamic ATR
• Cross/Test Signals
• Live and Last Close
Options:
• Specific Factors Setup
• Length Customization
• Toggle On/Off
• Color PIcker
• Styling Options
Notes:
v1.0
Indicator release.
Changes and updates can come in the future for additional functionalities or per requests. Follow and Stay Tuned!
Did you like it? Please Support and Shoot me a message! I'd appreciate if you dropped by to say thanks! Thank you.
- Octopu$
🐙

Profit Bands [Loxx]Profit Bands is a supplementary indicator to be used with Loxx's backtests and combination indicators that use volatility-based take profits and stop loss. This indicator includes two types of volatility: Average True Range and True Range Double. Additional volatility sources will be added in the future. The lines painted on the screen are multiples of ATR for Take Profits and Stoploss for Long/Short positions that you can change in the settings. 3 Take Profits and 1 Stoploss is supported. You can turn on/off each UI element. Position size is determined by calculating the size of an investment where you'd lose only X% of your balance if the Stoploss is hit. You can enter your total balance available to trade and the desired % risk you'd be willing to lose at SL. Typically this number is 1-2% of total balance per trade.
Always remember to wait for bar close on a signal to and then peg this indicator to 1 bar backward to fix the price levels the then seed the exact levels you'll use for Take Profits and Stoploss. This indicator will match exactly the levels in other indicators in Loxx's scripts such as Kaleidoscope. You would overlay this script over any other script that uses volatility stops to see where to place your TPs and SL

Didi ATR HybridThis is a hybrid indicator that combines the Didi Index with the Average True Range.
It acts as both an ATR and a Confirmation indicator, based on the No-Nonsense Forex (NNFX) trade rules.
The Didi Index takes three moving averages to build a fast line (MA1 and MA2) and a slow line (MA2 and MA3). You can use it several different ways (2 lines cross, zero-cross); in this setup, we only use the slow line with the zero-cross to produce a signal (source code is set up to take advantage of the fast line - you just need to plot it yourself).
ATR is a measure of candle volatility.
The plotted value is equal to the ATR, which then gets colored based on:
Black : Didi Index is below 0 - do not enter trade
Red : Didi Index is above 1, but the previous candle closed >1x ATR - do not enter trade (too volatile)
Green : Didi Index is above 1, and the previous candle closed <1x ATR - a possible trend is confirmed and you may enter the trade (use other indicators too)
The provided chart does not look exciting - as with NNFX, I am posting it with the OANDA:EURUSD , which is one of the harder FX pairs to trade.

WilliamTrendFollowerWith this indicator, we try to catch the trends in price. With continued use of this indicator, we expect it to eventually escape horizontal positions and catch up with continuous trends.
Combined with the WilliamsR indicator and the exponential moving average indicator.
The WilliamsR Fisher Transforms are combined with the ATR indicator to create a line that lags behind the moving average value.
Since it is a tracking indicator, we created a line that is more connected to the price and itself.
In this way, a curve close to the price line is obtained in uptrends and downtrends.
In this indicator, if you choose the parameters correctly, you can easily bypass the horizontal positions. This gives you a safe visualization of support and resistance points as well.
With this tracker, you can generate Buy and Sell signals and you can see them on the chart.
From the settings of these indicators, you can set the multiplier and the exponential moving average period.
It works in all time intervals.
But it was calculated without volume , instead it was created using fisher transforms, moving averages, and the average true range .
You can set an alarm for Buy and Sell orders.
You can see the processing entry and exit areas in a straight line.
The Fisher Transform indicator is an oscillator that helps identify trend reversals and can be applied to any financial instrument. J.F. Created by Ehlers
Golden SlopeGolden Slope is an ATR based trend tool that mixes KNN machine learning to allow you to confirm your entry and exits, which can give out significantly more accurate signals.
Flag and rectangle signals are machine learning signals, they confirm an entry and exit position. You can use entry and exit signals alone but it's more accurate to confirm with machine learning signals. The idea is to either see a machine learning signal first and confirm it by Golden Slope entry or the other way around.
PS. Watch out if candle starts hitting the golden belly (or the yellow area after an entry signal is given because it can indicate a reversal before machine learning or the golden slope itself catch it, but these events happen rarely.
