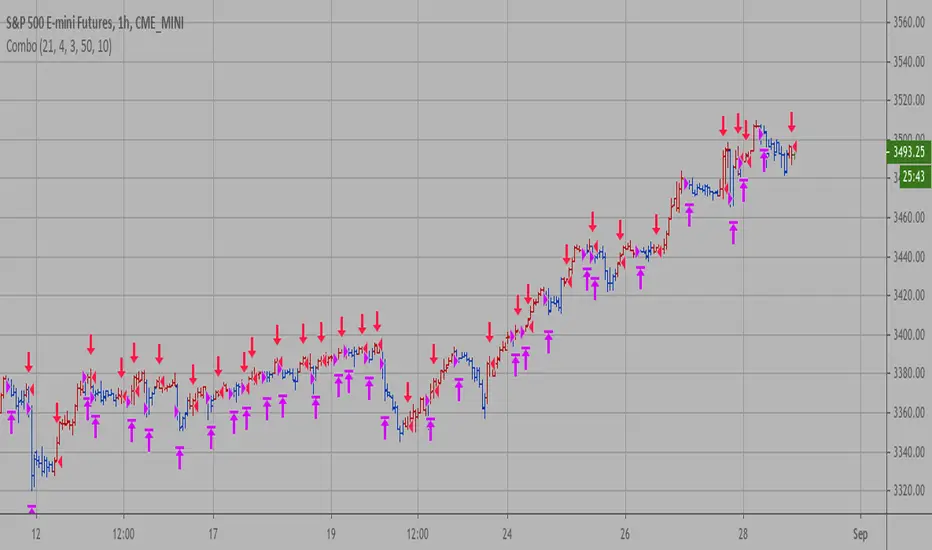
Phenom 5.3.1This has been a private script until now. I will be sharing it in order to get some feedback until it is ready to be made "invite only"
WHAT IT IS:
This is a scalping method (mostly) that works on nearly all markets and timeframes. THIS IS A BACKTEST SCRIPT! PLAN ACCORDINGLY!
HOW IT WORKS:
This script uses common indicators (5) in non-standard ways. When combined together, they can give fairly accurate results (40-65%) with acceptable Profit Factor ratings (1.7-3+).
This uses CCI, Moving Average, Stochastic, PSAR, and Bollinger Bands.
With these we have 4 base strategies usable.
Each indicator can be disabled (one at a time).
Each indicator has a SL method (stackable).
Each indicator has a TP method (stackable).
BEST RESULTS:
I have received best results as a scalper on 5min or 1HR timeframes. Mostly used on Index CFD's and CRYPTO markets.
NOT RESPONSIBLE FOR MISUSE OR LOST FUNDS! D.Y.O.R
Backtest

Combo Backtest 123 Reversal & Volume SMA This is combo strategies for get a cumulative signal.
First strategy
This System was created from the Book "How I Tripled My Money In The
Futures Market" by Ulf Jensen, Page 183. This is reverse type of strategies.
The strategy buys at market, if close price is higher than the previous close
during 2 days and the meaning of 9-days Stochastic Slow Oscillator is lower than 50.
The strategy sells at market, if close price is lower than the previous close price
during 2 days and the meaning of 9-days Stochastic Fast Oscillator is higher than 50.
Second strategy
Volume and SMA
WARNING:
- For purpose educate only
- This script to change bars colors.

Cyatophilum Scalper [BACKTEST]This indicator comes with a backtest and alert version. This is the backtest version. Its purpose is to create low timeframe and scalping strategies, by choosing from a list of built-in entry points which are described in detail below, and by configuring a risk management system to your liking.
Before diving into the entry points, I will explain the strategy and risk management settings.
These 3 settings allow to choose your strategy direction, and main behavior.
- Go Long ↗: activate or deactivate long entry points.
- Go Short ↘: activate or deactivate short entry points.
- Reversal strategy ↗↘↗↘: Activate this option will allow trades to reverse position from an opposite entry point. Keep it deactivated and trades will either wait a TakeProfit(TP) or StopLoss(SL) to be closed. When neither SL nor TP or set, this option is automatically activated.
StopLoss settings:
Both Long and Short SL can be activated and configured.
The base % price is the starting point of the stoploss, in a percentage of current price.
Trailing stop, when activated, works with 2 settings:
- % Price to Trigger: a percentage of current price the price should move in a bar to trigger a trailing movement.
- % Price Movement: the stoploss variation in a percentage of current price that moves on each bar.
TakeProfit settings:
Both Long and Short TP can be activated and configured.
The base % price is the value of the TP, in a percentage of current price.
Trailing Profit Deviation %: Percent deviation for the trailing take profit.
DCA:
DCA stands for Dollar Cost Average. The idea is to open additional orders from the base order so as to improve risk management.
These additional orders are also called Safety Orders. The indicator can handle up to 9 safety orders.
The strategy will exit either from a take profit based on percentage from base order or from a total volume percentage (Configurable in the parameters).
The steps spacing (space between each step) and safety orders volume (order size) can both scale by adding a scale multiplier.
By choosing from the base strategy dropdown menu, the indicator will generate entry points.
1. BUY SELL:
-> Low timeframes spot trading, with simple buy and sell orders.
How it works:
The indicator used is a combination of QQE (Atr based trend following indicator) and RMA 100 trendline.
I think the QQE does a great job in low timeframes because it is not impacted by the noise.
The RMA which is the moving average used in the RSI, will help giving confirmation to the entry points.
How to use:
It is meant to be used as a reversal strategy, but you can add a TP or SL if you want.
When comparing to Buy & Hold, make sure to deactivate the "Short results in the backtest" setting.
2. TREND SCALPING
-> A strategy for low timeframes trading.
How it works:
The strategy creates high volatility entries filtered by a duo convergence of adaptive trendlines (Adaptive HULL MA using the chart's resolution, Adaptive Tilson T3 using 1H resolution) and a higher timeframe (1H) RSI filter (long threshold: 70, short threshold: 40, RSI length: 10).
How to use:
Must be used on charts with a resolution smaller than 1H. Recommended: from 1m to 30m.
Must NOT be used as reversal strategy. Use it with a take profit and stop loss, and DCA if you can.
Sample risk management settings:
3. Support/Resistance BREAKOUTS
-> Trade low timeframes pivot points breakouts.
How it works:
The indicator calculates the 100 previous bars swing high and low. Any break above high or below low will trigger an entry point.
The entry is however filtered by an Adaptive Tilson T3 Trendline, an ADX 30 minimum threshold and a minimum average volume threshold.
How to use:
I recommend to click "Reversal" Strategy and set a Takeprofit target.
Find the best timeframe between 1m and 30m using the backtest version.
Example here with BTCUSDTPERP on 15m:
4. AGGRESSIVE SCALPING
-> Lots of trades in low timeframes.
How it works:
Created using Cyato AI, Higher/Lower Highs and Lows and 2 HULLMA crosses as entries, and 2 Adaptive Tilson T3 as trendfilter, a 25 ADX threshold filter and a volume filter.
How to use:
Recommended Risk Management settings: Takeprofit, Stoploss and DCA (Safety orders).
Find which timeframe work the best from 30 min and below. Should not be used above 30 min since this is the resolution for the MTF Tilson.
How to create Strategy Alerts:
Write your alert messages for EXIT, LONG and SHORT orders in the settings (Backtest section).
Then click add alert, and in the alert message, write the following:
{{strategy.order.alert_message}}
BACKTEST PARAMETERS
- Inital capital: 10 000$
- Base order size: 0.1 contract (0.1 btc)
- Safety order size: 0.1 contract (0.1 btc)
- Commission: 0.1%
- Slippage: 100 ticks
Oldest trade: 2020-08-31
Backtest Period: From 2020-08-31 to 2020-11-12
Configuration used: see the live chart configuration panel at the top.
To gain access to this paid indicator, please use the link below.

Combo Backtest 123 Reversal & Gann Swing Oscillator This is combo strategies for get a cumulative signal.
First strategy
This System was created from the Book "How I Tripled My Money In The
Futures Market" by Ulf Jensen, Page 183. This is reverse type of strategies.
The strategy buys at market, if close price is higher than the previous close
during 2 days and the meaning of 9-days Stochastic Slow Oscillator is lower than 50.
The strategy sells at market, if close price is lower than the previous close price
during 2 days and the meaning of 9-days Stochastic Fast Oscillator is higher than 50.
Second strategy
The Gann Swing Oscillator has been adapted from Robert Krausz's book,
"A W.D. Gann Treasure Discovered". The Gann Swing Oscillator helps
define market swings.
WARNING:
- For purpose educate only
- This script to change bars colors.

Combo Backtest 123 Reversal & FX Sniper: T3-CCI This is combo strategies for get a cumulative signal.
First strategy
This System was created from the Book "How I Tripled My Money In The
Futures Market" by Ulf Jensen, Page 183. This is reverse type of strategies.
The strategy buys at market, if close price is higher than the previous close
during 2 days and the meaning of 9-days Stochastic Slow Oscillator is lower than 50.
The strategy sells at market, if close price is lower than the previous close price
during 2 days and the meaning of 9-days Stochastic Fast Oscillator is higher than 50.
Second strategy
This simple indicator gives you a lot of useful information - when to enter, when to exit
and how to reduce risks by entering a trade on a double confirmed signal.
You can use in the xPrice any series: Open, High, Low, Close, HL2, HLC3, OHLC4 and ect...
WARNING:
- For purpose educate only
- This script to change bars colors.

Combo Backtest 123 Reversal & Volatility Finite Volume ElementsThis is combo strategies for get a cumulative signal.
First strategy
This System was created from the Book "How I Tripled My Money In The
Futures Market" by Ulf Jensen, Page 183. This is reverse type of strategies.
The strategy buys at market, if close price is higher than the previous close
during 2 days and the meaning of 9-days Stochastic Slow Oscillator is lower than 50.
The strategy sells at market, if close price is lower than the previous close price
during 2 days and the meaning of 9-days Stochastic Fast Oscillator is higher than 50.
Second strategy
This is another version of FVE indicator that we have posted earlier
in this forum.
This version has an important enhancement to the previous one that`s
especially useful with intraday minute charts.
Due to the volatility had not been taken into account to avoid the extra
complication in the formula, the previous formula has some drawbacks:
The main drawback is that the constant cutoff coefficient will overestimate
price changes in minute charts and underestimate corresponding changes in
weekly or monthly charts.
And now the indicator uses adaptive cutoff coefficient which will adjust to
all time frames automatically.
WARNING:
- For purpose educate only
- This script to change bars colors.

Combo Backtest 123 Reversal & FSK (Fast and Slow Kurtosis) This is combo strategies for get a cumulative signal.
First strategy
This System was created from the Book "How I Tripled My Money In The
Futures Market" by Ulf Jensen, Page 183. This is reverse type of strategies.
The strategy buys at market, if close price is higher than the previous close
during 2 days and the meaning of 9-days Stochastic Slow Oscillator is lower than 50.
The strategy sells at market, if close price is lower than the previous close price
during 2 days and the meaning of 9-days Stochastic Fast Oscillator is higher than 50.
Second strategy
This indicator plots the Fast & Slow Kurtosis. The Kurtosis is a market
sentiment indicator. The Kurtosis is constructed from three different parts.
The Kurtosis, the Fast Kurtosis(FK), and the Fast/Slow Kurtosis(FSK).
WARNING:
- For purpose educate only
- This script to change bars colors.

Combo Backtest 123 Reversal & Fractal Chaos Oscillator This is combo strategies for get a cumulative signal.
First strategy
This System was created from the Book "How I Tripled My Money In The
Futures Market" by Ulf Jensen, Page 183. This is reverse type of strategies.
The strategy buys at market, if close price is higher than the previous close
during 2 days and the meaning of 9-days Stochastic Slow Oscillator is lower than 50.
The strategy sells at market, if close price is lower than the previous close price
during 2 days and the meaning of 9-days Stochastic Fast Oscillator is higher than 50.
Second strategy
The value of Fractal Chaos Oscillator is calculated as the difference between
the most subtle movements of the market. In general, its value moves between
-1.000 and 1.000. The higher the value of the Fractal Chaos Oscillator, the
more one can say that it follows a certain trend – an increase in prices trend,
or a decrease in prices trend.
Being an indicator expressed in a numeric value, traders say that this is an
indicator that puts a value on the trendiness of the markets. When the FCO reaches
a high value, they initiate the “buy” operation, contrarily when the FCO reaches a
low value, they signal the “sell” action. This is an excellent indicator to use in
intra-day trading.
WARNING:
- For purpose educate only
- This script to change bars colors.

Simple SMA Strategy Backtest Part 5Simple SMA strategy
In this stream, we will create an intraday trade cap.
WARNING:
- For purpose educate only
- This script to change bars colors
Stream:
www.tradingview.com

Combo Backtest 123 Reversal & Floor Pivot Points This is combo strategies for get a cumulative signal.
First strategy
This System was created from the Book "How I Tripled My Money In The
Futures Market" by Ulf Jensen, Page 183. This is reverse type of strategies.
The strategy buys at market, if close price is higher than the previous close
during 2 days and the meaning of 9-days Stochastic Slow Oscillator is lower than 50.
The strategy sells at market, if close price is lower than the previous close price
during 2 days and the meaning of 9-days Stochastic Fast Oscillator is higher than 50.
Second strategy
The name ‘Floor-Trader Pivot,’ came from the fact that Pivot points can
be calculated quickly, on the fly using price data from the previous day
as an input. Although time-frames of less than a day can be used, Pivots are
commonly plotted on the Daily Chart; using price data from the previous day’s
trading activity.
WARNING:
- For purpose educate only
- This script to change bars colors.

EURUSD signal [DinhChienFX Corner] Ver 3.0* Signals are tested successfully for 3.5 years with a steady win rate year on year until now.
Risk: 1%.
* Backtest time: 3.5 years / Premium, varies between currency pairs (Cryto default backtest time is shorter since the market is open both Saturday and Sunday: about 2 years).
The price rule of EURUSD in 20,000 past H1 candles past:
- Upterm (Long): Buy
+ When the price crossing up (Crossover) the Upper line gives 1 point.
- Downterm (Short): Sell
+ When the price crossing down (Crossunder) the Lower line gives 1 point.
- 2 or more points (> = 2), the entry conditions are met
- The entry point for the highest winning rate: when the price adjusts to the Upper / Lower line, the order price is at the closing price of the adjustment candle.
- When the above conditions are met, the Indicator shows a Buy / Sell signal according to the trend.
-----------------------------------
- Maximum risk / reward winning ratio: 1 / 1.05
- Stoploss: Calculated from the entry point + - actual fluctuation with the formula ATR (20) * risk ratio (risk).
- Profit: Calculated from the entry point + - actual fluctuation by the formula ATR (20) * reward ratio (reward).
- Profit: So the product has a stable profit of over 30% / year.
- Should backtest 3 Years (long term), every Year (medium term) and quarterly or 6 months (short term). If each year the success rate is always over 50%, it can be used for real trade.

Combo Backtest 123 Reversal & Future Lines of Demarcation This is combo strategies for get a cumulative signal.
First strategy
This System was created from the Book "How I Tripled My Money In The
Futures Market" by Ulf Jensen, Page 183. This is reverse type of strategies.
The strategy buys at market, if close price is higher than the previous close
during 2 days and the meaning of 9-days Stochastic Slow Oscillator is lower than 50.
The strategy sells at market, if close price is lower than the previous close price
during 2 days and the meaning of 9-days Stochastic Fast Oscillator is higher than 50.
Second strategy
An FLD is a line that is plotted on the same scale as the price and is in fact the
price itself displaced to the right (into the future) by (approximately) half the
wavelength of the cycle for which the FLD is plotted. There are three FLD's that can be
plotted for each cycle:
An FLD based on the median price.
An FLD based on the high price.
An FLD based on the low price.
WARNING:
- For purpose educate only
- This script to change bars colors.

Combo Backtest 123 Reversal & Fisher Transform Indicator This is combo strategies for get a cumulative signal.
First strategy
This System was created from the Book "How I Tripled My Money In The
Futures Market" by Ulf Jensen, Page 183. This is reverse type of strategies.
The strategy buys at market, if close price is higher than the previous close
during 2 days and the meaning of 9-days Stochastic Slow Oscillator is lower than 50.
The strategy sells at market, if close price is lower than the previous close price
during 2 days and the meaning of 9-days Stochastic Fast Oscillator is higher than 50.
Second strategy
Market prices do not have a Gaussian probability density function
as many traders think. Their probability curve is not bell-shaped.
But trader can create a nearly Gaussian PDF for prices by normalizing
them or creating a normalized indicator such as the relative strength
index and applying the Fisher transform. Such a transformed output
creates the peak swings as relatively rare events.
Fisher transform formula is: y = 0.5 * ln ((1+x)/(1-x))
The sharp turning points of these peak swings clearly and unambiguously
identify price reversals in a timely manner.
WARNING:
- For purpose educate only
- This script to change bars colors.
AltS Swing [Backtester]
PLEASE READ THIS DESCRIPTION TO SAVE TIME AND UNDERSTAND WHAT THIS INDICATOR DOES
This is the backtesting version for this script
In this back tested version I have shown it to be used on regular candles with realistic calculations in regards to positions sizes, slippage, fees and more
Kind Regards
This is a official version of AltSignals Long/Short Reverse Indicator
Description:
This indicator uses various indicators in combination with each other, some of the key ones to mention is Hulls, EMA , MA. Along with that it uses EMA crossovers to get the precise entries and exits.
The recommended time frames with this indictor are shorter ones, for example 5m,10m,15m work well, along with that I have found that some of the more unique time frames also work well such as 20m,45m,2hr and so on.
This indicator is not super advanced but it's still very powerful, with only 130 lines of code.
This indicator works on every chart, time, and candle type but you must play with the settings to find what is best, the same setting will not work on every pair etc.
With AltSignals Swing Indicator it trades one way, that means it gives 3 pieces of information. BUY/TakeProfit/StopLoss.
Unlike most indicators which Buy and Sell both ways this one focuses on one direction of trading so please take into account when using this.
I have added in a reverse strategy which basically shows the opposite values of of the buy, so if you select the box in the settings and un-tick it, then it will show opposite directions so sells only.
This feature is very useful especially in general bear markets when buying is difficult.
I have also added in the option for no stop losses to be used, if you set the stop loss value = 100 then it will show no stop losses.
I suggest a stop loss somewhere in the region of 1-2-3%, please note that you can use decimal stop losses too so for example 0.1 or 0.5.
This indicator is NOT a once size fits all, every chart is different, time frame and candles also, so i would suggest spending some time going through and playing with the channel length settings, which will change the EMA numbers.
Using this along with the back script to find the ideal settings is the best way to use this script, once you have done that make sure to save those values somewhere.
Its important to remember that the Regular script and the back testing script values should be the same for them to match up on the chart, so the channel lengths, stop losses and so on values should be the same.
Side note
This is not financial advice.
We will continue making updates as time goes on.
If you would like to try this script for free please visit our website or message us on Tradingview live chat.

Combo Backtest 123 Reversal & Finite Volume Elements (FVE) This is combo strategies for get a cumulative signal.
First strategy
This System was created from the Book "How I Tripled My Money In The
Futures Market" by Ulf Jensen, Page 183. This is reverse type of strategies.
The strategy buys at market, if close price is higher than the previous close
during 2 days and the meaning of 9-days Stochastic Slow Oscillator is lower than 50.
The strategy sells at market, if close price is lower than the previous close price
during 2 days and the meaning of 9-days Stochastic Fast Oscillator is higher than 50.
Second strategy
The FVE is a pure volume indicator. Unlike most of the other indicators
(except OBV), price change doesn?t come into the equation for the FVE (price
is not multiplied by volume), but is only used to determine whether money is
flowing in or out of the stock. This is contrary to the current trend in the
design of modern money flow indicators. The author decided against a price-volume
indicator for the following reasons:
- A pure volume indicator has more power to contradict.
- The number of buyers or sellers (which is assessed by volume) will be the same,
regardless of the price fluctuation.
- Price-volume indicators tend to spike excessively at breakouts or breakdowns.
WARNING:
- For purpose educate only
- This script to change bars colors.

Moving Average Displaced Envelope Backtest Moving Average Displaced Envelope. These envelopes are calculated
by multiplying percentage factors with their displaced expotential
moving average (EMA) core.
How To Trade Using:
Adjust the envelopes percentage factors to control the quantity and
quality of the signals. If a previous high goes above the envelope
a sell signal is generated. Conversely, if the previous low goes below
the envelope a buy signal is given.
WARNING:
- For purpose educate only
- This script to change bars colors.

Combo Backtest 123 Reversal & Extracting The Trend This is combo strategies for get a cumulative signal.
First strategy
This System was created from the Book "How I Tripled My Money In The
Futures Market" by Ulf Jensen, Page 183. This is reverse type of strategies.
The strategy buys at market, if close price is higher than the previous close
during 2 days and the meaning of 9-days Stochastic Slow Oscillator is lower than 50.
The strategy sells at market, if close price is lower than the previous close price
during 2 days and the meaning of 9-days Stochastic Fast Oscillator is higher than 50.
Second strategy
Extracting The Trend
The related article is copyrighted material from Stocks & Commodities Mar 2010
WARNING:
- For purpose educate only
- This script to change bars colors.

Combo Backtest 123 Reversal & Ergodic TSI This is combo strategies for get a cumulative signal.
First strategy
This System was created from the Book "How I Tripled My Money In The
Futures Market" by Ulf Jensen, Page 183. This is reverse type of strategies.
The strategy buys at market, if close price is higher than the previous close
during 2 days and the meaning of 9-days Stochastic Slow Oscillator is lower than 50.
The strategy sells at market, if close price is lower than the previous close price
during 2 days and the meaning of 9-days Stochastic Fast Oscillator is higher than 50.
Second strategy
r - Length of first EMA smoothing of 1 day momentum 4
s - Length of second EMA smoothing of 1 day smoothing 8
u- Length of third EMA smoothing of 1 day momentum 6
Length of EMA signal line 3
Source of Ergotic TSI Close
This is one of the techniques described by William Blau in his book "Momentum,
Direction and Divergence" (1995). If you like to learn more, we advise you to
read this book. His book focuses on three key aspects of trading: momentum,
direction and divergence. Blau, who was an electrical engineer before becoming
a trader, thoroughly examines the relationship between price and momentum in
step-by-step examples. From this grounding, he then looks at the deficiencies
in other oscillators and introduces some innovative techniques, including a
fresh twist on Stochastics. On directional issues, he analyzes the intricacies
of ADX and offers a unique approach to help define trending and non-trending periods.
WARNING:
- For purpose educate only
- This script to change bars colors.

Combo Backtest 123 Reversal & Ergodic MDI This is combo strategies for get a cumulative signal.
First strategy
This System was created from the Book "How I Tripled My Money In The
Futures Market" by Ulf Jensen, Page 183. This is reverse type of strategies.
The strategy buys at market, if close price is higher than the previous close
during 2 days and the meaning of 9-days Stochastic Slow Oscillator is lower than 50.
The strategy sells at market, if close price is lower than the previous close price
during 2 days and the meaning of 9-days Stochastic Fast Oscillator is higher than 50.
Second strategy
This is one of the techniques described by William Blau in his book "Momentum,
Direction and Divergence" (1995). If you like to learn more, we advise you to
read this book. His book focuses on three key aspects of trading: momentum,
direction and divergence. Blau, who was an electrical engineer before becoming
a trader, thoroughly examines the relationship between price and momentum in
step-by-step examples. From this grounding, he then looks at the deficiencies
in other oscillators and introduces some innovative techniques, including a
fresh twist on Stochastics. On directional issues, he analyzes the intricacies
of ADX and offers a unique approach to help define trending and non-trending periods.
WARNING:
- For purpose educate only
- This script to change bars colors.
Combo Backtest 123 Reversal & Ergodic MACD This is combo strategies for get a cumulative signal.
First strategy
This System was created from the Book "How I Tripled My Money In The
Futures Market" by Ulf Jensen, Page 183. This is reverse type of strategies.
The strategy buys at market, if close price is higher than the previous close
during 2 days and the meaning of 9-days Stochastic Slow Oscillator is lower than 50.
The strategy sells at market, if close price is lower than the previous close price
during 2 days and the meaning of 9-days Stochastic Fast Oscillator is higher than 50.
Second strategy
This is one of the techniques described by William Blau in his book
"Momentum, Direction and Divergence" (1995). If you like to learn more,
we advise you to read this book. His book focuses on three key aspects
of trading: momentum, direction and divergence. Blau, who was an electrical
engineer before becoming a trader, thoroughly examines the relationship
between price and momentum in step-by-step examples. From this grounding,
he then looks at the deficiencies in other oscillators and introduces some
innovative techniques, including a fresh twist on Stochastics. On directional
issues, he analyzes the intricacies of ADX and offers a unique approach to help
define trending and non-trending periods.
Blau`s indicator is like usual MACD, but it plots opposite of meaningof
stndard MACD indicator.
WARNING:
- For purpose educate only
- This script to change bars colors.
Combo Backtest 123 Reversal & Ergodic CSI This is combo strategies for get a cumulative signal.
First strategy
This System was created from the Book "How I Tripled My Money In The
Futures Market" by Ulf Jensen, Page 183. This is reverse type of strategies.
The strategy buys at market, if close price is higher than the previous close
during 2 days and the meaning of 9-days Stochastic Slow Oscillator is lower than 50.
The strategy sells at market, if close price is lower than the previous close price
during 2 days and the meaning of 9-days Stochastic Fast Oscillator is higher than 50.
Second strategy
This is one of the techniques described by William Blau in his book
"Momentum, Direction and Divergence" (1995). If you like to learn more,
we advise you to read this book. His book focuses on three key aspects
of trading: momentum, direction and divergence. Blau, who was an electrical
engineer before becoming a trader, thoroughly examines the relationship between
price and momentum in step-by-step examples. From this grounding, he then looks
at the deficiencies in other oscillators and introduces some innovative techniques,
including a fresh twist on Stochastics. On directional issues, he analyzes the
intricacies of ADX and offers a unique approach to help define trending and
non-trending periods.
This indicator plots Ergotic CSI and smoothed Ergotic CSI to filter out noise.
WARNING:
- For purpose educate only
- This script to change bars colors.
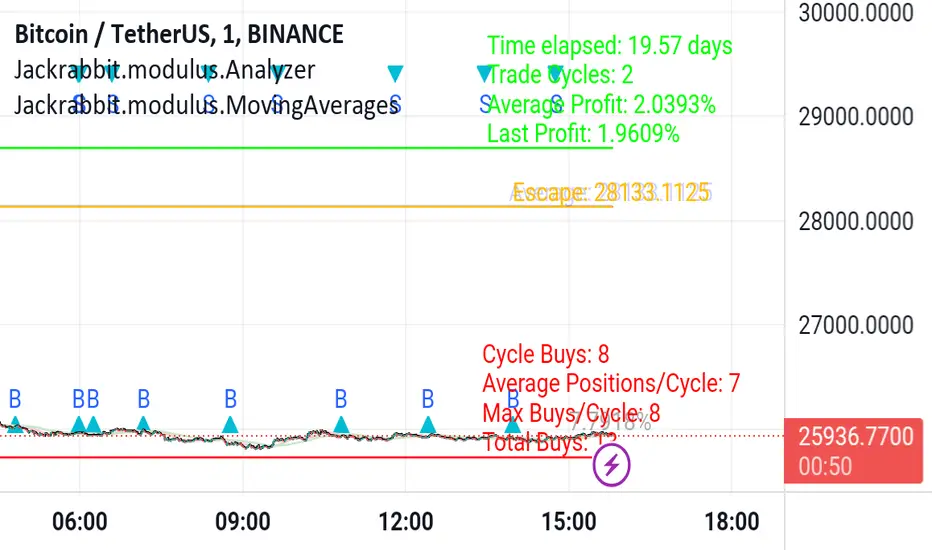
Jackrabbit.modulus.AnalyzerThis is the module Analyzer for the Jackrabbit suite and modulus framework.
As the modulus framework has grown both in size and complexity, it has become ever increasingly difficult to evaluate the profitability a very complex multi-layered modules combined.
The Jackrabbit Analyzer module allows you to do just that. Connect this module to the end of your IoI chain and it will tell you the profitability of your current combination, using TradingView's strategy backtesting capabilities.
With this module connected to your IoI chain, you can literally watch in real time as the analyzer evaluates your current settings and updates each time you make a change in those settings, giving you a better and more realistic approach to what is possible with your current strategy.
While this module is not a substitute for paper trading, it significantly increases the construction and analysis of a multi-layered trading paradigm that can then be taken to a paper trader with a high level of confidence of success.
Only the signal line is displayed.
The Jackrabbit modulus framework is a plug in play paradigm built to operate through TradingView's indicator on indicatior (IoI) functionality. As such, this script receives a signal line from the previous script in the IoI chain, and evaluates the buy/sell signals appropriate to the current analysis.
This script is by invitation only. To learn more about accessing this script, please see my signature or send me a PM. Thank you.
Cyatophilum Levels [BACKTEST]Cyatophilum Levels - Version 1.0 - Backtest
This indicator allows you to build your own strategy based on Fibonacci levels, and see the backtest results in the Strategy Tester.
The Fibonacci levels are printed automatically in real time and without repainting on the chart.
You configure your own strategy in the indicator parameters. You can choose to go long or to go short, or both, on which Fib levels to enter Long/Short, and on which Fib levels to exit (up to 2 entry levels and exit levels).
Detailed Guide:
This is a guide that can be useful if you do not understand the strategy or an indicator parameter. Instructions on how to get access are at the bottom.
To configure your strategy, you need to open the indicator settings. You can either right-click on the indicator and click "settings", or click the settings button near the indicator's name.
You should know that the Fibonnaci levels are calculated from the support and resistance levels, which are calculated using the last swing high and swing low. This behavior can be tweaked in the settings with the first 2 parameters:
· Noise reduction
Dropdown menu. Options are "NONE", "SMALL", "MEDIUM", "HUGE". Used to get a smoother level behavior. The higher it is, the less often the support and resistance levels will move. Can be useful to cut off fakeouts.
· Swings lookback
This is the number of historical bars used to calculate the last swing high and swing low.
In TradingView, we usually wait bar close to validate a signal (trade entry or exit), in order to avoid repainting. But since this indicator is purely based on price action, there is an option called Alert Type if you want to receive intra-bar alerts or not.
· Entry Alert Type
2 options : "Once Per Bar Close", "Once Per Bar". These correspond to the alerts options. You must use the same alert type in the indicator settings and in the alert options. When using "Once Per Bar", the candle high and low are used for the cross conditions, otherwise, candle close is used.
· Exit Alert Type
Same but for exit alerts.
The long trades setup can be configured independantly from the short trade setup, but the parameters are the same.
■ Go Long/Short
Check this box to enable/disable long/short trades.
· Long/Short Entry Condition
Dropdown menu from which you can pick the condition for your entry. Options available are "Cross Over","Cross Under" and "Just Cross".
· Long/Short Entry 1
Dropdown menu from which you can pick the level for your entry n°1. Options available are "Support","FIB 23", "FIB 38", "FIB 50","FIB 61","FIB 78" and "Resistance".
· Long/Short Entry 2
Additional FIB level entry.
· Long/Short Exit 1
Dropdown menu from which you can pick the level for your exit. Options available are "Support","FIB 23", "FIB 38", "FIB 50","FIB 61","FIB 78" and "Resistance".
· Long/Short Exit 2
Additional FIB level exit.
■ Trend Filter
Optionnal Tilson T3 TrendLine to make the strategy go long only when price is above T3 (green) and short only when price is below (red). The length in bars is configurable.
· Backtest period
The day of the start and end period of the backtest can be configured, as long as it is included in the available chart data which is around 20 000 candles. For example a 3 minutes chart data is around 41 days. (20000x3/60/24 = 41.3)
· Limit orders
By default the strategy tester uses market orders. With this option you can simulate limit orders with a limit price.
· Configuration Panel
It should appear on the left of the chart. This panel displays the whole indicator settings in a compact and easy-to-read way. You can replicate a strategy from just this info panel. Can be turned off if needed.
· Graphic options
A red/green background corresponding to the strategy position (short/long) can be turned off.
The Fib levels labels can be turned off all at once.
Backtesting Guide:
To open the backtest parameters, open the indicator settings and go to the "properties" tab.
The commission is set by to 0.1 % by default. You can change it to suit your exchange's fees.
Futures, Forex:
- The Order Size must be set to "contracts", or else you will get "no data".
Stocks, CFD, Cryptocurrency, Index:
- Both "% equity" and "contracts" can be used as Order Size.
Note: the net profit percentage is related to the initial capital set in the backtest properties.
Risk management
Place your secondary exit one or two levels above/below your entry to act as a stop loss.
Backtest Settings:
· Initial Capital: 10 000 $
· Order Size: 5 000 contracts
· Commission : 0.1€ per order (total commission paid: 20.00 €)
Oldest trade: 2019-10-01
Backtest Period: From 2019-10-01 to 2020-07-14
Default settings set for 15m.
Use the link below to obtain access to this indicator
