RePaNoCHa V4 [Backtest]This is the Backtest version of the previous one.
It's important to correctly set the "TICKS / PIPS CORRECTION" parameter in each different chart.
Enjoy!
Backtest

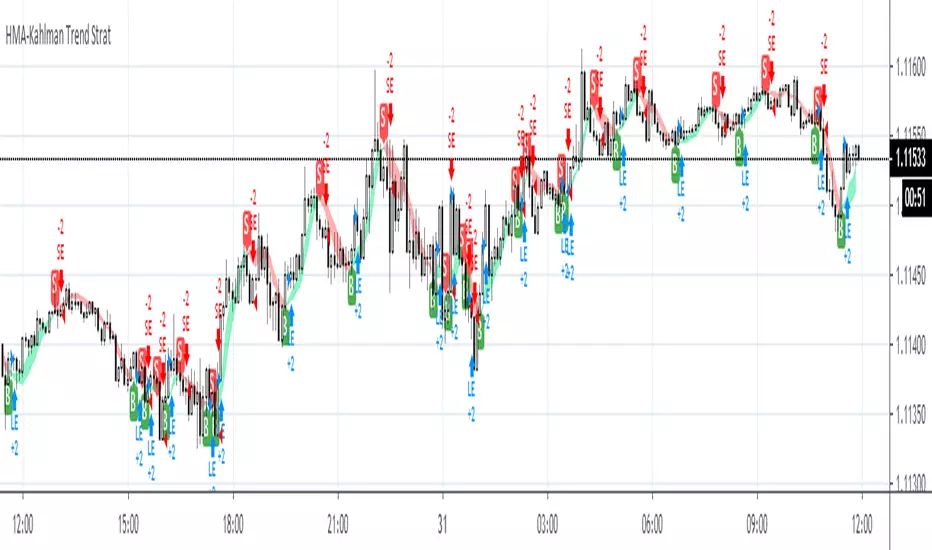
Hull Trend with Kahlman Strategy BacktestA simple backtest version of a Hull Trend with Kahlman strategy
Cyatophilum Scalping Bot V2 [ADVANCED SETTINGS] [BACKTEST]Advanced Settings version of Cyatophilum Scalping Bot V2
For people who like tweaking settings =)

Cyatophilum Scalping Bot V2 [BACKTEST]Improved version of Cyatophilum Scalping Bot
Default settings for BITMEX:XBTUSD
2% stop loss
2% trailing take profit

Combo Backtest 123 Reversal & Breakout Range Short This is combo strategies for get a cumulative signal.
First strategy
This System was created from the Book "How I Tripled My Money In The
Futures Market" by Ulf Jensen, Page 183. This is reverse type of strategies.
The strategy buys at market, if close price is higher than the previous close
during 2 days and the meaning of 9-days Stochastic Slow Oscillator is lower than 50.
The strategy sells at market, if close price is lower than the previous close price
during 2 days and the meaning of 9-days Stochastic Fast Oscillator is higher than 50.
Second strategy
Breakout Range Short Strategy
WARNING:
- For purpose educate only
- This script to change bars colors.

Ema BacktesterA simple, but useful script for backtesting purposes. Find the optimal Settings for your strategy.
tips are always welcome at: 38uGQJDDZDL6wX48x4gYTccPeQ3ZHVYmY4 (btc)
I hope you enjoy the script :)

Combo Backtest 123 Reversal & Bill Williams. AO with Signal Line This is combo strategies for get a cumulative signal.
First strategy
This System was created from the Book "How I Tripled My Money In The
Futures Market" by Ulf Jensen, Page 183. This is reverse type of strategies.
The strategy buys at market, if close price is higher than the previous close
during 2 days and the meaning of 9-days Stochastic Slow Oscillator is lower than 50.
The strategy sells at market, if close price is lower than the previous close price
during 2 days and the meaning of 9-days Stochastic Fast Oscillator is higher than 50.
Second strategy
This indicator plots the oscillator as a histogram where blue denotes
periods suited for buying and red . for selling. If the current value
of AO (Awesome Oscillator) is above previous, the period is considered
suited for buying and the period is marked blue. If the AO value is not
above previous, the period is considered suited for selling and the
indicator marks it as red.
You can make changes in the property for set calculating strategy MA, EMA, WMA
WARNING:
- For purpose educate only
- This script to change bars colors.

FREE BACKTEST STRATEGY BTC/USDT 15m Binance LONGA long only strategy for trading BINANCE:BTCUSDT in a 15m timeframe built upon Donchian Channels.
The script is already configured for this market /timeframe.
I built it using my generic version that you can request access by leaving a comment:
To get access to the alert setup version and automate the strategy, you need to purchase a subscription on my website .
Thanks for the feedback/support !

Cyatophilum PSAR Bot Trader V2 [BACKTEST]A strategy built upon Parabolic Stop And Reverse.
This new version includes my whole Trend Detector / Stop Loss / Takeprofit / Trailing System.

Cyatophilum Bands Pro Trader V5 [BACKTEST]Hi guys, I improved my script once again :)
This version includes a new feature.
Trailing Take Profit with % deviation.
For those seeing the indicator for the first time, it works like Donchian Channels with lag and a channel width condition to detect breakouts. On top of that I integrated a Stop Loss and Take Profit system to pinescript.
Backtest results below are calculated with :
Short + Long Strategy
0.05% Commission
100% of 10 000% equity per trade
Strategy data from 25/04/2019 to 18/05/2019
Default Configuration for BITFINEX:ETHBTC 3 minutes timeframe.
This version also has the Stop Loss / Take Profit system included in the previous version, plus a short / long setup distinction. For example you can choose a different stop loss % for long and for short trades.
Previous version:
This Backtest version is free to test. Just Leave a comment, thanks !
Get access to the Alert Setup version and automate the strategy today !
Purchase the Cyatophilum Indicators pack
I will publish backtests and configurations so make sure to follow me if you don't want to miss anything !
My Website - blockchainfiesta.com -
My Discord channel - discord.gg -

Bitcoin FREE BACKTEST Version BTCUSD 5m BITFINEXA strategy for trading BTC/USD in 5m timeframe.
The strategy includes long and short trades.
You can find the Alert Setup version below.

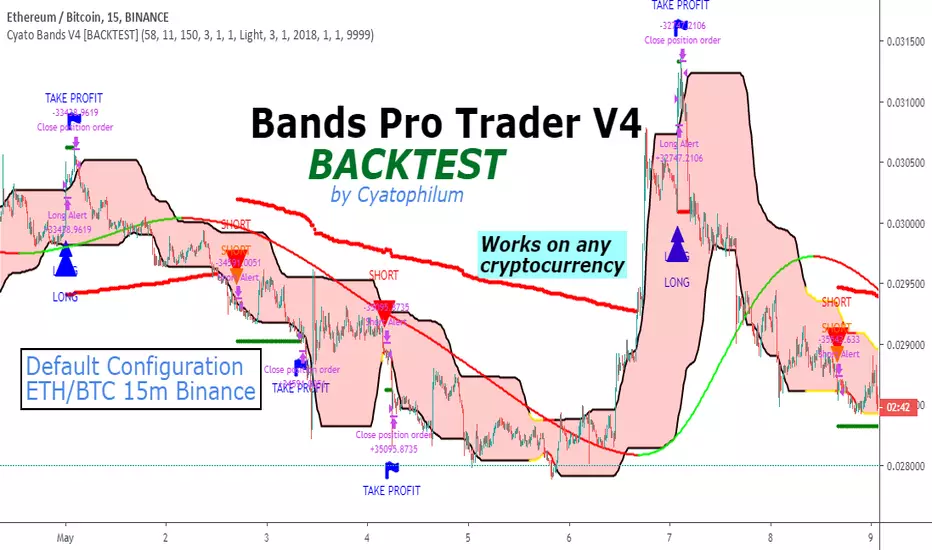
Cyatophilum Bands Pro Trader V4 [BACKTEST]This version includes a new feature, engineered to increase profitability.
About the backtest below:
Short + Long Strategy
0.05% Commission
10% of 10 000% equity per trade. Net Profit can be increased with a bigger % of equity.
Strategy data from 01/11/2019 to 30/04/2019
The Cyatophilum Bands, Trailing Stop Loss and Take Profit System are explained in the last version:
The access to this indicator and its Alert Setup version are included in the Cyatophilum Indicators pack available on my website blockchainfiesta.com
To get a free trial, leave a comment, thank you.
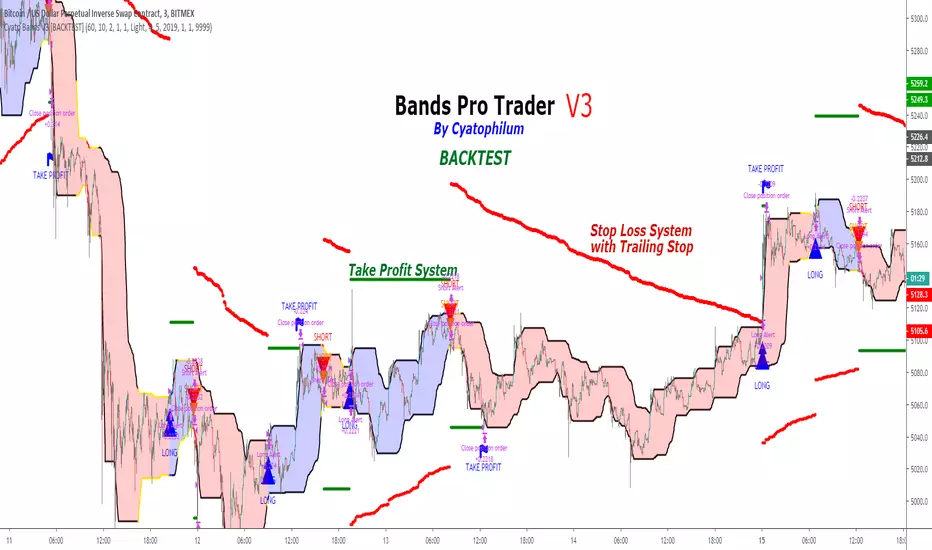
Cyatophilum Bands Pro Trader V3 [BACKTEST]An Original Automated Strategy that can be used for Manual or Bot Trading, on any timeframe and market.
>> Presentation <<
How it works
No, these are NOT Bollinger Bands..
The Cyatophilum Bands are an original formula that I created. You will probably never find it anywhere else.
Their behavior is the following:
When they are horizontal it means the trend is going sideways and they represent supports (lower band) and resistances (upper band).
When they are climbing or falling it means the trend is either bullish or bearish and they represent Trend Lines.
The strategy enters Long on a Bull Breakout and enters Short on a Bear Breakout.
The exits are triggered either on a Trend Reversal, a Stop Loss or a Take Profit.
FEATURES
Take Profit System
Stop Loss System
Show Net profit Line
More features here
Finding a profitable configuration is GUARANTEED
0. Choose your symbol and timeframe. Then add the Backtest version to your chart. If at any time you decide to change your timeframe, go back to step 1.
1. Open the strategy tester and look at the buy & hold line.
If it is mostly climbing (last value greater than 0) then it means we are in a bull market. You should then opt or a long only strategy.
If it is mostly dropping (last value lower than 0) then it means we are in a bear market. You should then opt or a short only strategy.
Note : This first step is really important. Trading against the market has very little chances to succeed.
2. Go into the Strategy Input Parameters:
check "Enable Long Results" and uncheck "Enable Short Results" if you are in a long only strategy.
check "Enable Short Results" and uncheck "Enable Long Results" if you are in a short only strategy.
3. Open the Strategy Tester and open the Strategy Properties.
We are going to find the base parameters for the Bands.
The "Bands Lookback" is the main parameter to configure for any strategy. It corresponds to how strong of a support and resistance the bands will behave. The lower the timeframe, the higher lookback you will need. It can move from 10 to 60. For example 60 is a good value for a 3 minute timeframe. Try different values, and look at the "net profit" value in the Overview tab of the Strategy Tester. Keep the Lookback value that shows the best net profit value.
Then play with the "Bands Smoothing" from 2 to 20 and keep the best net profit value.
The "Band Smoothing" is used to reduce noise.
Usually, the default value (10) is what gives the best results.
From this point you should already be able to have a profitable strategy (net profit>0), but we can improve it using the Stop Loss and the Take Profit feature.
4. To activate the Stop Loss feature, click on the "SECURITY" checkbox
You should see horizontal red lines appear.
A Long/short exit alert will be triggered if the price were to cross this line. (A red Xcross will appear)
Choose the Stop Loss percentage.
On top of that, you can enable the feature "Trailing Stop". It will make the red line follow the price, at a speed that you can configure with the "Trailing Speed" parameter.
Now, sometimes a stop is triggered and it was just a fakeout. You can enable "Re-entries after a stop" to avoid missing additional opportunities.
5. To activate the Take Profit feature, click on the "TAKE PROFIT" checkbox
You should see horizontal green lines appear.
A Long/short exit alert will be triggered if the price were to cross this line. (A flag will appear)
Choose the Take Profit percentage.
A low takeprofit will provide a safer strategy but can reduce potential profits.
A higher takeprofit will increase risk but can provide higher potential profits.
6. Money Management
You can configure the backtest according to your own money management.
Let's say you have 10 000 $ as initial capital and want to trade only 5%, set the Order Size to 5% of Equity.
You can increase net profit by increasing the order size but this is at your own risk.
How to create alerts explained here
Sample Uses Cases
Use it literally anywhere
This indicator can be used on any timeframe and market (not only cryptocurrencies).
About the Backtest below
The Net Profit (Gross profit - Gross loss) is calculated with a commission of 0.05% on each order.
No leverage used. This is a long strategy.
Each trade is made with 10 % of equity from an inital capital of 10 000$. The net profit can be bigger by increasing the % of equity but this a trader's rule to minimise the risk.
I am selling access to all my indicators on my website : blockchainfiesta.com
To get a 2 days free trial, just leave a comment , thanks !
Join my Discord for help, configurations, requests, etc. discord.gg
Cyatophilum Bands Pro Trader V2 [BACKTEST]An Original Automated Strategy that can be used for Manual or Bot Trading, on any timeframe and market.
Presentation Page with video
How it works
If you haven't yet please check the ALERT SETUP description.
How to use
Use the specific Backtest options to:
Choose a time period
Enable/Disable Long and Short results
Show the Netprofit Line on chart (green line)
About the Backtest
The Net Profit (Gross profit - Gross loss) is calculated with a commission of 0.05% on each order.
Each trade is made with 100 % of equity from an inital capital of 4000$
No leverage used. Shorts and Longs results are enabled.
Note: You can use this backtest version for finding the best configuration for your favorite market/timeframe. I will also be there to help you.
Find more backtests and configurations on my Discord : discord.gg
Can be easily automated with Autoview.
Get the indicator today!

Smeared VCI BacktestThis is the strategy with backtest date range and trailing-stop / stop-loss for vitelot's Smeared VCI indicator:

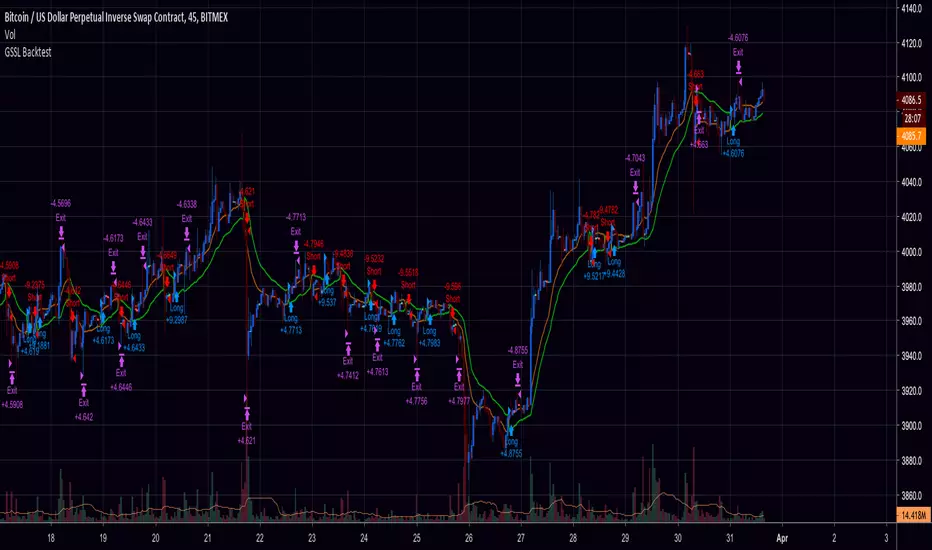
Generalized SSL Backtest w/ TSSLStrategy with Backtest Date Range and Trailing-Stop / Stop-Loss for vitelot's indicator:
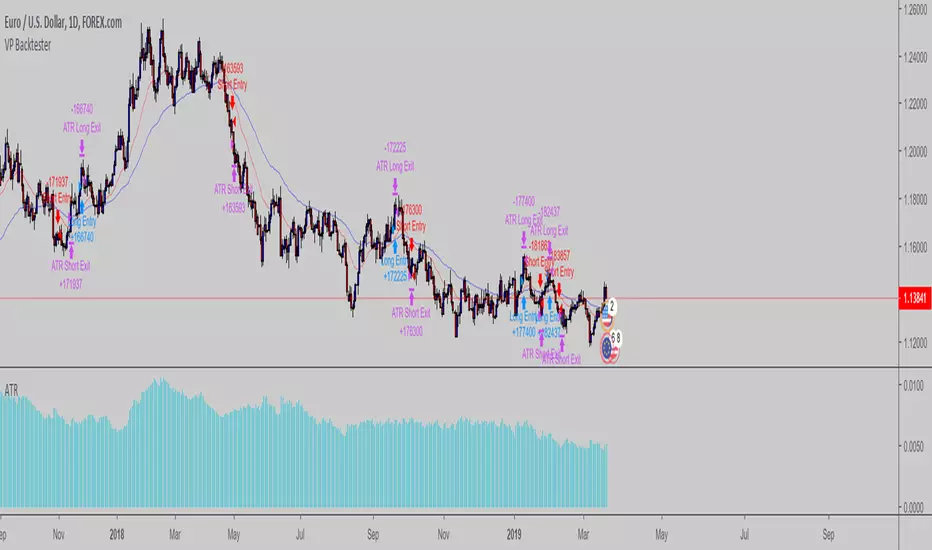
VP Backtester skeletonSimple backtesting skeleton script which uses ATR based stop & profit targets based on the no-nonsense forex way of trading
Commodity Selection Index Backtest The Commodity Selection Index ("CSI") is a momentum indicator. It was
developed by Welles Wilder and is presented in his book New Concepts in
Technical Trading Systems. The name of the index reflects its primary purpose.
That is, to help select commodities suitable for short-term trading.
A high CSI rating indicates that the commodity has strong trending and volatility
characteristics. The trending characteristics are brought out by the Directional
Movement factor in the calculation--the volatility characteristic by the Average
True Range factor.
Wilder's approach is to trade commodities with high CSI values (relative to other
commodities). Because these commodities are highly volatile, they have the potential
to make the "most money in the shortest period of time." High CSI values imply
trending characteristics which make it easier to trade the security.
The Commodity Selection Index is designed for short-term traders who can handle
the risks associated with highly volatile markets.
WARNING:
- For purpose educate only
- This script to change bars colors.

Backtest Larry Williams 9.1 ( exemplo) - JBBacktest simples para compra no rompimento do topo do primeiro candle que abre abaixo e fecha acima da ema de 9 periodos e venda no rompimento do fundo do primeiro candle que fecha abaixo da ema de 9

Three Outside Down Backtest This is a three candlestick bearish reversal pattern consisting of a bearish
engulfing pattern formed by the first two candlesticks then followed by a down
candlestick with a lower close than the prior candlestick.
WARNING:
- For purpose educate only
- This script to change bars colors.

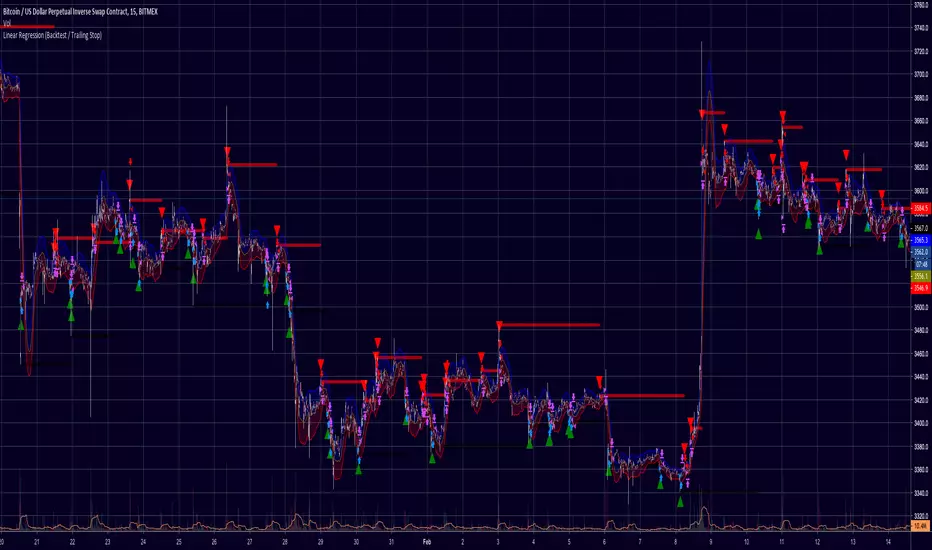
Linear Regression (Backtest / Trailing Stop)A Strategy with Backtest and Trailing Stop for Long/Short
Credits: Study by RafaelZioni - Thanks buddy!
Fisher Transform Multi-Timeframe Backtest (No Trailing)This is the Backtester without Trailing Stops
Credits to mortdiggiddy
