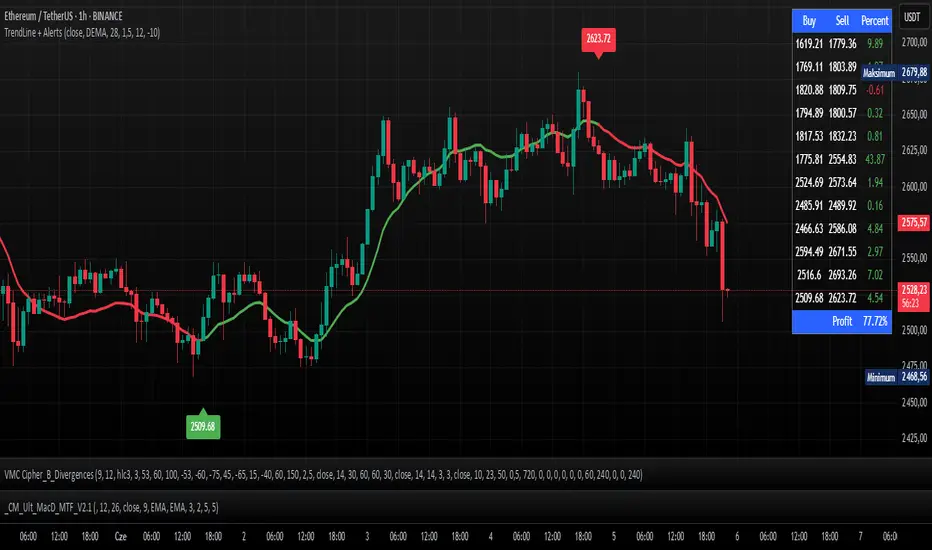
TrendLine + AlertsThe TrendLine + Alerts indicator is an advanced technical analysis tool designed to quickly identify trend direction using various moving averages and RMSD deviation. It dynamically generates buy and sell signals and visually marks entry points with price labels on the chart. Additionally, an optional transaction table can be toggled on or off, displaying buy and sell prices along with the percentage returns of individual trades and an aggregated summary row, facilitating the evaluation of trading strategy performance.
🔧 Key Features:
- Supports multiple moving average types: SMA, EMA, HMA, DEMA, TEMA, RMA, FRAMA
- Dynamic trend analysis based on RMSD deviation, adaptable to current market conditions
- Color-coded trend indication: green for uptrends, red for downtrends
- Alert generation: real-time buy and sell signals (TrendLine BUY / SELL)
- Price labels on the chart for better visualization of entry/exit points
- Interactive settings panel allowing selection of data source (open, close, high, low etc.), adjustable moving average length, and RMSD deviation multiplier
- Optionally displays a dynamic transaction table (toggleable via chart settings) that shows:
- Buy: entry prices
- Sell: exit prices
- Percent: percentage return of each trade, displayed as a number
- A summary row that aggregates the percentage returns, offering a quick evaluation of trading performance
⚙️ Settings:
- Ability to select the data source: open, close, high, low, oc2, hl2, occ3, hlc3, ohlc4, hlcc4
- Adjustable moving average length
- Customizable RMSD deviation multiplier
- Toggle switch to enable or disable the transaction table
🚀 Application:
Ideal for traders seeking an effective method to identify trends and turning points in the market. It is suitable for both short-term day trading and long-term trend analysis, with adjustable settings to suit individual trading strategies.
Backtestable
TTP VWAP BandThis indicator offers 20 VWAP bands and on-chart statistic data about the bands.
Features
- Longs and shorts
- Cherry-pick up to 5 bands for backtesting
- Plots 20 bands
- Step scale to increase deviation percentage on each band
- Period and timeframe selectors
- Band crosses: how many times a band was crossed (also percentage)
- Band bounces: how many times each band was pinched and bounced back (also percentage)
How to use:
1) Set the chart to 15 or 5 minute timeframe for higher backtesting accuracy
2) Select the first band deviation % (MIN Long VWAP % and MIN Short VWAP %), use a small number like 0.3 or 1.0 since the rest of the 20 bands will increase that amount later.
3) Select a step scale or leave it in 1 if you prefer same distance between all bands. Notice that if you use a value below 1 the bands will get closer to each other.
4) Observe the statistics and pay attention to how many times each of the bands are being crossed in percentage. This will later help you make decisions on when to enter and where to potentially put an SL.
Connect with your preferred backtester:
You can backtest a single or multiple bands at once. For example you could use the 7th band to enter a base order and later use crosses of the 4th band to enter safety orders. Any combination is possible!
Let's assume you decide that you will be backtesting only 1 band at the time as your single entry condition for your backtester.
Let's also assume that you want to use the 2nd band for long entries then do follow these steps:
- Set "Band 1 backtesting" to 2 so that it prints 1 every time the price crosses below the 2nd band.
- Leave the other Band backtesting band settings with a 0 so they stay disabled
- Add your backtester to the same chart and select "band 1 long signal"
- This signal will contain 1 every time your conditions are met

TTP Volume CSThis indicator helps you flagging areas where the volume is higher or lower than a moving average of the volume.
You can define a % threshold and whether you want the volume to be below or above the simple moving average of the volume.
The areas that are above the MA of the volume are shown in green and below in red.
Lookback parameter
This parameter allows you to check back in time for your condition. You can use it for reducing the noise of volume fluctuations
Examples of use:
- show areas where the volume is 20% above the SMA30 of the volume
- show areas where the volume is 40% below the SMA30 of the volume
Examples of trading ideas with this indicator:
- Areas of low volume can act as a reversal of the price.
- Areas where volume is too high as well.
- Trading in areas of low volume can affect the results when scalping
TTP RSI drawdownThis indicator offers a way to trade the RSI drawdown combined together with its value.
Parameters
- Lookback. How many candles in the past are used to calculate the drawdown of the RSI
- RSI strength and timeframe
- Lower and Upper RSI limits. These are used to colour the drawdown chart, the greener the closed to your specified lower limit and the more red the closer to the upper limit. These limits are also used to confirm that the signal occurs with an RSI value within the given limits.
- Signal threshold. Buy signals will only be triggered when the drawdown of the RSI is higher than the provided value.
Buy signals
The signal will trigger in white color and will plot a 1 to allow backtesting.
TradingView alerts can be set for buy signals.
Buy signals will be trigger only when:
- RSI value is within the provided lower and upper limit values
- RSI drawdown is higher than the provided threshold.
Features
- Back-testable (plots 1 for buy)
- TV alerts
Chart modes
- show RSI
- show highest RSI
- show RSI drawdown
In the short time I've been playing with this new idea I noticed it can be used both for swing trading and for long term analysis like for example finding market bottoms.
Here's an example setup to find BTC past market cycle bottoms:
- load a chart with INDEX:BTCUSD
- set the chart timeframe to daily
- set the chart to logarithmic scale
- zoom out to see the full chart
- add the RSI drawdown indicator
- use the following parameters in the indicator: timeframe: week, gaps: off, show RSI drawdown: on, lookback:30, length:14, lower: 20, upper: 30: threshold: 40

Two MA Signal IndicatorThis Signal Indicator that emits a signal based on two MAs crossover/crossunder. It is designed to be used as an External Input for "Template Trailing Strategy" to verify the correctness of the External Deal Condition Mode of the aforementioned script and the Internal Strategy logic. Also, this script is a simple example on how to create custom signal indicators that can be "pugged" to the "Template Trailing Strategy" and get all the features this strategy script can provide!