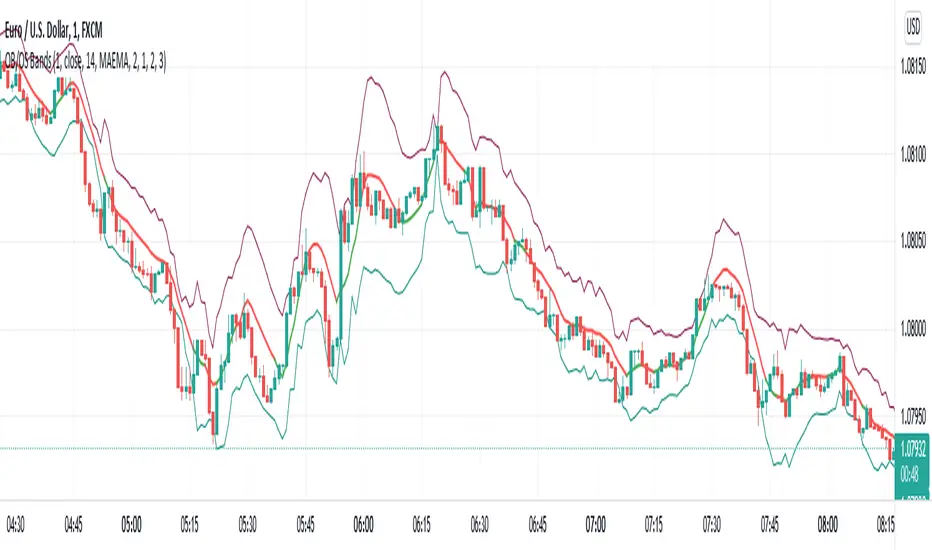
BANDSTrend indicator. It is based on a simple moving average, the maximum and minimum of this moving average for the period. When the moving average coincides with its maximum for the period , the trend is rising, when the moving average coincides with its minimum for the period, the trend is falling. The optimal periods should be selected for each timeframe and trading instrument.
Bands
Moving Average Bands [CC]The Moving Average Bands were created by Vitali Apirine (Stocks and Commodities July 2021 pg 16) and this is a very handy trend following indicator that will give you the overall trend of the underlying stock. As the bands rise then the stock is in an uptrend and as they fall then it is a downtrend. If the bands stay flat then it is a sideways and/or choppy market. I did change the middle band from what he originally authored because I believe this gives more accurate buy and sell signals so keep that in mind. Feel free to use a different moving average than the original exponential moving average in the formula. As always buy when the indicator lines turn green and sell when they turn red.
Let me know if there are any other indicators you would like to see me publish!
Supertrend BandsSupertrend Bands
What is the Supertrend indicator?
"The Supertrend indicator is a trend following overlay on your trading chart, much like a moving average, that shows you the current trend direction.
The indicator works well in a trending market but can give false signals when a market is trading in a range.
It uses the ATR (average true range) as part of its calculation which takes into account the volatility of the market. The ATR is adjusted using the multiplier setting which determines how sensitive the indicator is."
"For the basic Supertrend settings, you can adjust period and factor:
- The period setting is the lookback for the ATR calculation
- Factor is the what the ATR is multiplied by to offset the bands from price"
How to use this indicator
This indicator is inspired by a strategy I found. It includes four Supertrend indicators, each with different settings that displays trend strength and support/resistance zones. The default settings are optimal for cryptocurrency but do work quite well for traditional also. I highly recommend you try experimenting with different settings, increasing them to suit the instrument.
The bands are set from low to high, Band 1 being the fastest and Band 4 being the slowest. Band 4 is the one that sets the overall trend so when price is above Band 4, the trend is bullish and vice versa. Trend is strongest when price is above/below Band 1 and gets weaker as it filters through each band. Band 4 provides the strongest support/resistance and if that breaks the trend flips.
In the menu, you will see an option called "Remove Anti Trend?". It is enabled by default and it removes any bearish/resistance bands when the trend is up and any bullish/support bands when the trend is down. When turned off, it will show all Supertrend Bands as they are by default.
Bar Colors
Bar colors are optional and they reflect the current trend strength based on the Supertrend bands.
Alternate ways of using this indicator
You could leave everything as default or you can display individual bands. For instance, because I use many overlay indicators, most of the time I turn off all the bands and only show bar colors:
You can also turn off Bands 1 and 2 and only show the two slowest lengths:
This removes the noise of the two faster Supertrends.
Or just show the two fastest bands:
Any suggestions to improve this indicator are most welcome :)

GMS: GW-VWAPAlright, as per usual with these, I end up adapting an existing indicator to what I want to accomplish. So this is based off the built in VWAP indicator. I added in the gummy worm to easily identify the trend, as well as the related bands to identify potential areas to either reverse position or to trim an existing one.
The middle part of the bands are the gummy worm version of VWAP. It is the VWAP using the high and another VWAP using the low. The black line is HL2 VWAP (technically 3 VWAPs).
The bands follow what I was mentioning above. So the outer most part of the bands are the high & low VWAP (with the same multiplier) and the inner bands are the HL2 VWAP.
Of course you can set whatever input source you want for these. The default is how I use it. If you want to get rid of the bar color just go to the indicator settings and un-select it at the bottom.
Source code is open so feel free to poke around.
Hope this helps,
Andre

EMA 730 Ribbon MTF - Support and ReistanceThe EMA 730 line is a great way to show dynamic support and resistance . Price action travels "through" this line on each timeframe. This script pulls the EMA 730 Line from multiple timeframes so a trader can visually see price action bounce between support and resistance lines. Lower bands (white lines) can be turned off using "tickbox" in settings. EMA length can also be adjusted in settings. Some charts may work better with a length of 750.
Example of EMA Bands on lower timeframe.

Inverse BandsI'm very new to trading. I've been toying with moving averages to trigger swing trades and wanted an indicator that would swell when price moves sideways and squeeze when price is trending.
So this is the inverse of the popular Bollinger Bands indicator. It makes a very easy identifier for price breakout when paired with your favorite fast moving average. When MA falls outside the bands, it indicates an emerging trend. Still requires some curve fitting, but it is a work in progress.
I hope this isn't a direct copy of something I am not aware of.
Rate Of Change Bands [CC]The Rate Of Change Bands were created by Vitali Apirine (Stocks and Commodities March 2021 pg 14) and this indicator is a great method to not only check the momentum but also check the trend strength as well. I have color coded the lines so buy when the line turns green and sell when it turns red.
Let me know if there are any other indicators you want me to publish!

2 Multi-Timeframe Bollinger BandsThis is two separate Bollinger bands in one study. Customizable middle BB line type ( SMA , EMA , VWMA ), legnth, colors, and deviations provided at .5 increments.
Someone else has a very similar Bollinger Band study but the code was hidden, so I figured I would remake as a learning challenge since I'm new to pinescript and this is the best way to learn it imo.
There will be updates to this script in the future but for now it serves its purpose lol. Publishing this version early as I wanted to give some friends access to it
In terms of usage, I like 4h 50 SMA alot . Having two sets of Bollinger bands is nice so you can turn one off or swap between time frames and such. In terms of techniques using both bbands, I haven't really played with it too much yet but simple things like 1h 50sma bbands expanding past the 4h 50sma bbands probably indicate an exaggerated move in that specific time frame, etc etc.
Hope this helps!

VWMACDV2 w/Intraday Intensity Index Histogram & VBCB Hello traders! In this script i tried to combine Kıvanç Özbilgiç's Volume Based Coloured Bars, Volume Weighted Macd V2 and Intraday Intensity Index developed by Dave Bostian and added to Tradingview by Kıvanç Özbilgiç. Let's see what we got here;
VBCB, Paints candlestick bars according to the volume of that bar. Period is 30 by default. If you're trading stocks, 21 should be better.
Volume Weighted Macd V2, "Here in this version; Exponential Moving Averages used and Weighted by Volume instead of using only vwma (Volume Weighted Moving Averages)." Says, Kıvanç Özbilgiç.
III, "A technical indicator that approximates the volume of trading for a specified security in a given day. It is designed to help track the activity of institutional block traders and is calculated by subtracting the day's high and low from double the closing price, divided by the volume and multiplied by the difference between the high and the low."
*Histogram of vwmacd changes color according to the value of III. (Green if positive, yellow if negative value)*
VWMACD also comes with the values of 21,13,3... Which are fibonacci numbers and that's how i use it. You can always go back to the good old 26,12,9.
Other options according to the fibonacci numbers might be= 21,13,5-13,8,3-13,8,5... (For shorter terms of trading)
Trading combined with the bollinger bands is strongly advised for both VWMACD and III. VBCB is just the candy on top :)
Enjoy!

Adjustable MA & Alternating Extremities [LuxAlgo]Returns a moving average allowing the user to control the amount of lag as well as the amplitude of its overshoots thanks to a parametric kernel. The indicator displays alternating extremities and aims to provide potential points where price might reverse.
Due to user requests, we added the option to display the moving average as candles instead of a solid line.
Settings
Length: MA period, refers to the number of most recent data points to use for its calculation.
Mult: Multiplicative factor for each extremity.
As Smoothed Candles: Allows the user to show the MA as a series of candles instead of a solid line.
Show Alternating Extremities : Determines whether to display the alternating extremities or not.
Lag: Controls the amount of lag of the MA, with higher values returning a MA with more lag.
Overshoot: Controls the amplitude of the overshoots returned by the MA, with higher values increasing the amplitude of the overshoots.
Usage
Moving averages using parametric kernels allows users to have more control over characteristics such as lag or smoothness; this can greatly benefit the analyst. A moving average with reduced lag can be used as a leading moving average in a MA crossover system, while lag will benefit moving averages used as slow MA in a crossover system.
Increasing 'Lag' will increase smoothness while increasing 'overshoot' will reduce lag.
The following indicator puts more emphasis on its alternating extremities, an upper extremity will be shown once the high price crosses the upper extremity, while a low extremity will be shown once the low price crosses the lower extremity. These can be interpreted like extremities of a band indicator.
The MA using a length value of 200 with a multiplicative factor of 1.
In general, extremities will effectively return points where price might potentially bounce in ranging markets while closing prices under trending markets will often be found above an upper extremity and under a lower extremity.
Reducing the lag of the moving average allows the user to obtain a more timely estimate of the underlying trend in the price, with a better fit overall. This allows the user to obtain potentially pertinent extremities where price might reverse upon a break, even under trending markets.
In the above chart, the price initially breaks the upper extremity, however, we can observe that the upper extremity eventually reaches back the price, goes above it, provides a resistance, and effectively indicates a reversal.
Users can plot candles from the moving average, these are fairly similar to heikin-ashi candles in the sense that CandleOpen(t) ≠ CandleClose(t-1) , each point of the candle is calculated as follows for our indicator:
Open = Average between MA(t-1) and MA(t-2)
High = MA using the high price as input
Low = MA using the low price as input
Close = MA using the closing price as input
Details
Lag is defined as the effect of moving averages to reflect past price variations instead of new ones, lag can be observed by the user and is the main cause of false signals. Lag is proportional to the degree of filtering returned by the moving average.
Overshooting is a common effect encountered in non-lagging moving averages, and is defined as the tendency of a moving average to exceed a maximum level (or minimum level, which can be defined as undershooting )
MA and rolling maximum/minimum, both using a length of 50 bars. While we can think of lag as a cost of smoothness, we can think of overshooting as a cost for reduced lag on some occasions.
Explaining the kernel design behind our moving average requires understanding of the logic behind lag reduction in moving averages. This can prove to be complex for non informed users, but let's just focus on the simpler part; moving averages can be defined as a weighted sum between past prices and a set of coefficients (kernel).
MA(t) = b(0)C(t) + b(1)C(t-1) + b(2)C(t-2) + ... + b(n-1)C(t-n-1)
Where n is the period of the moving average. Lag is (non optimally) reduced by "underweighting" past prices - that is multiplying them by negative numbers.
The kernel used in our moving average is based on a modified sinewave. A weighted sum making use of a sinewave as a kernel would return an oscillator centered at 0. We can divide this sinewave by an increasing linear function in order to obtain a kernel allowing us to obtain a low lag moving average instead of a centered oscillator. This is the main idea in the design of the kernel used by our moving average.
The kernel equation of our moving average is:
sin(2πx^α)(1 - x^β)
With 1>x>0 , and where α controls the lag, while β controls the overshoot amplitude.
Using this equation we can obtain the following kernels:
Here only α is changed, while β is equal to 1. Values to the left would represent the coefficients for the most recent prices. Notice how the most significant coefficients are given to the oldest prices in the case where α increases.
Higher overshoot would require more negative values, this is controlled by β
Here only β is changed, while α is equal to 1. Notice how higher values return lower negative coefficients. This effectively increases the overshoots amplitude in our moving average. We can decrease α in order for these negative coefficients to underweight more recent values.
Using α = 0 allows us to simplify the kernel equation to:
1 - x^β
Using this kernel we can obtain more classical moving averages, this can be seen from the following results:
Using β = 1 allows us to obtain a linearly decreasing kernel (the one of a WMA), while increasing allows the kernel to converge toward a rectangular kernel (the one of SMA).

Moving Average BandsUse this script to find buy and sell zones for BTC based on momentum of the move relative to the average asset price over a given period. The script plots a series of offset bands above and below the Simple Moving Average. When price crosses another band further from the SMA, the background is rendered brighter. The brighter the background, the stronger the buy and sell signal is, as the expectation is that price wants to return to the SMA. Settings are adjustable to fine tune to various time frames and assets. Good settings for BTC Daily are length 30, layers at 10, 20, 30, and 40.
On 1H BTC/USD I use length 200, layers at 5, 10, 15, 20 to find decent swing trading opportunities.
On BTC/USD 1D chart, combine with Bitcoin Logarithmic Growth Curve from @mabonyi (original by @quantadelic )for confluence of very reliable signals.

RSI with bands and multiple EMAs Combination of RSI and EMAs, useful in predicting momentum switches and defining overbought/oversold conditions on all time frames.

Overbought/Oversold BandsThe basis of this script is my "Hybrid Overbought/Oversold Detector" which uses many different oscillators to confirm overbought/oversold conditions. The main idea is to generate higher and lower bands around the desired moving average using an average of the volatility (ATR) and the standard deviation (StDev), of course by interfering detected overbought/oversold condition.
Simply put, the more the asset become overvalued/undervalued, the tighter the channel would be and every breakout of the bands announces a return back into the channel in near future.
By default, the multiplier of the standard deviation in the indicator settings is set to 2 which means only less than 5% of price actions would appear outside the bands. Also the default multiplier of the ATR is set to 3 which leads to some similar result, but to achieve more strict results setting StDev multiplier to 3 and ATR multiplier to 4 would be useful.
The type of the central moving average could be picked up from 6 different types which are:
- SMA (Simple Moving Average)
- EMA (Exponential Moving Average)
- HMA (Hull Moving Average)
- LSMA (Least Squares Moving Average)
- TMA (Triangular Moving Average)
- MAEMA (My Personalized Momentum Adjusted EMA)
The latter one leads to a useful combination of the channel with the momentum.
Also the script has multi-timeframe features and the user could apply calculations from other time frames to the current chart.
Hope the idea would be helpful!
Overlay Indicators (EMAs, SMAs, Ichimoku & Bollinger Bands)This is a combination of popular overlay indicators that are used for dynamic support and resistance, trade targets and trend strength.
Included are:
-> 6 Exponential Moving Averages
-> 6 Simple Moving Averages
-> Ichimoku Cloud
-> Bollinger Bands
-> There is also a weekend background marker ideal for cryptocurrency trading
Using all these indicators in conjunction with each other provide great confluence and confidence in trades and price targets.
An explanation of each indicator is listed below.
What Is an Exponential Moving Average (EMA)?
"An exponential moving average (EMA) is a type of moving average (MA) that places a greater weight and significance on the most recent data points. The exponential moving average is also referred to as the exponentially weighted moving average. An exponentially weighted moving average reacts more significantly to recent price changes than a simple moving average (SMA), which applies an equal weight to all observations in the period.
What Does the Exponential Moving Average Tell You?
The 12- and 26-day exponential moving averages (EMAs) are often the most quoted and analyzed short-term averages. The 12- and 26-day are used to create indicators like the moving average convergence divergence (MACD) and the percentage price oscillator (PPO). In general, the 50- and 200-day EMAs are used as indicators for long-term trends. When a stock price crosses its 200-day moving average, it is a technical signal that a reversal has occurred.
Traders who employ technical analysis find moving averages very useful and insightful when applied correctly. However, they also realize that these signals can create havoc when used improperly or misinterpreted. All the moving averages commonly used in technical analysis are, by their very nature, lagging indicators."
Source: www.investopedia.com
Popular EMA lookback periods include fibonacci numbers and round numbers such as the 100 or 200. The default values of the EMAs in this indicator are the most widely used, specifically for cryptocurrency but they also work very well with traditional.
EMAs are normally used in conjunction with Simple Moving Averages.
" What Is Simple Moving Average (SMA)?
A simple moving average (SMA) calculates the average of a selected range of prices, usually closing prices, by the number of periods in that range.
Simple Moving Average vs. Exponential Moving Average
The major difference between an exponential moving average (EMA) and a simple moving average is the sensitivity each one shows to changes in the data used in its calculation. More specifically, the EMA gives a higher weighting to recent prices, while the SMA assigns an equal weighting to all values."
Source: www.investopedia.com
In this indicator, I've included 6 popular moving averages that are commonly used. Most traders will find specific settings for their own personal trading style.
Along with the EMA and SMA, another indicator that is good for finding confluence between these two is the Ichimoku Cloud.
" What is the Ichimoku Cloud?
The Ichimoku Cloud is a collection of technical indicators that show support and resistance levels, as well as momentum and trend direction. It does this by taking multiple averages and plotting them on the chart. It also uses these figures to compute a "cloud" which attempts to forecast where the price may find support or resistance in the future.
The Ichimoku cloud was developed by Goichi Hosoda, a Japanese journalist, and published in the late 1960s.1 It provides more data points than the standard candlestick chart. While it seems complicated at first glance, those familiar with how to read the charts often find it easy to understand with well-defined trading signals."
More info can be seen here: www.investopedia.com
I have changed the default settings on the Ichimoku to suit cryptocurrency trading (as cryptocurrency is usually fast and thus require slightly longer lookbacks) to 20 60 120 30.
Along with the Ichimoku, I like to use Bollinger Bands to not only find confluence for support and resistance but for price discovery targets and trend strength.
" What Is a Bollinger Band®?
A Bollinger Band® is a technical analysis tool defined by a set of trendlines plotted two standard deviations (positively and negatively) away from a simple moving average (SMA) of a security's price, but which can be adjusted to user preferences.
Bollinger Bands® were developed and copyrighted by famous technical trader John Bollinger, designed to discover opportunities that give investors a higher probability of properly identifying when an asset is oversold or overbought."
This article goes into great detail of the complexities of using the Bollinger band and how to use it.
=======
This indicator combines all these powerful indicators into one so that it is easier to input different settings, turn specific tools on or off and can be easily customised.

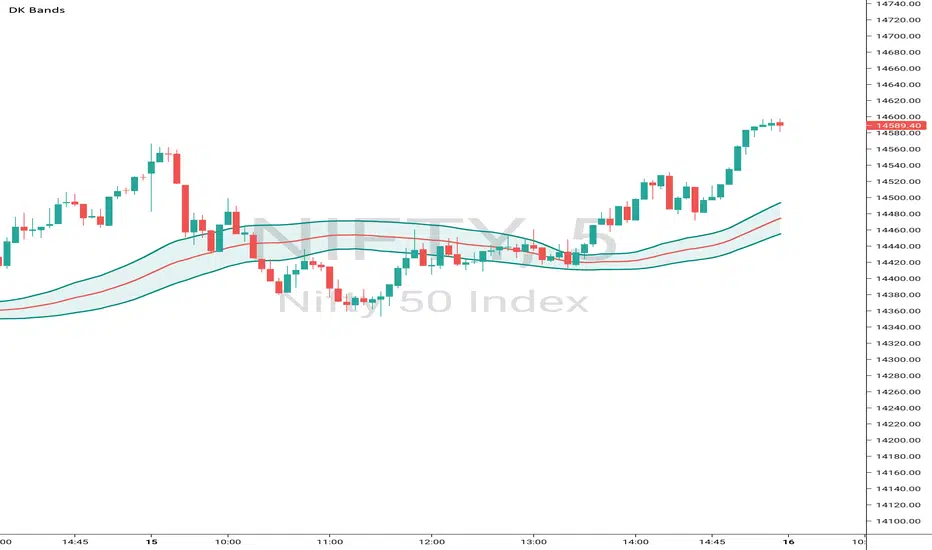
DK BandsThis Bands are formed based on Bollinger Bands. The middle line shows moving average and remaining upper and lower bands are like zones wheh this this band is narrow then price consolidation stage similarly this band are expand then market will trending
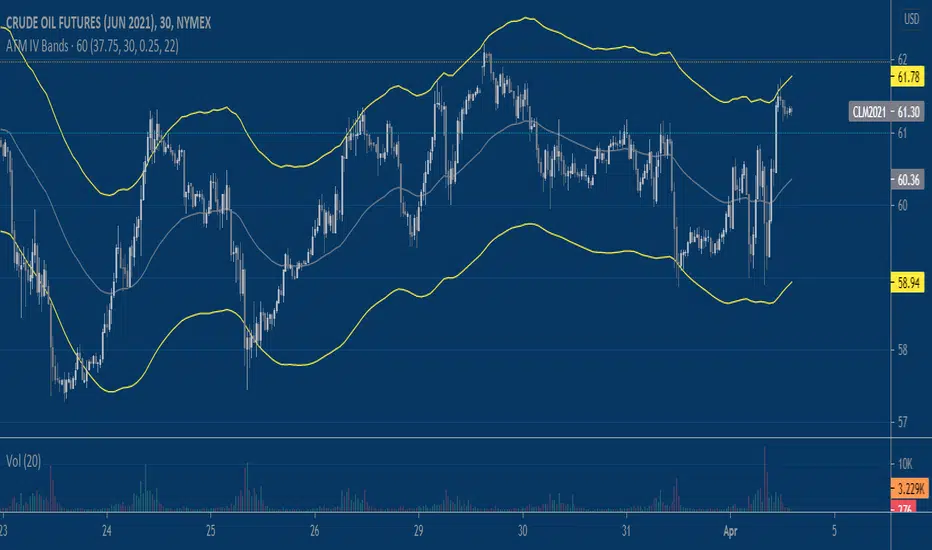
Implied Volatility BandsThis script produces price bands around an EMA based on a manually inputted Implied Volatility. The idea builds on my previous "Implied Move" script which helps visualize the distribution of prices that the market is 'pricing in' via options/implied volatility. It's up to the user to determine the implied volatility level they use, I like using the free version of QuikStrike that you can access via the CME Group website and then update the script's input daily. Another way to use the script is to input the implied volatility based on a forecast that you produce independently. Say implied volatility on June 2021 Crude Oil is 30% and you think it's rich by 2%, you can input 28% into the script to tweak the bands for a declining vol regime.
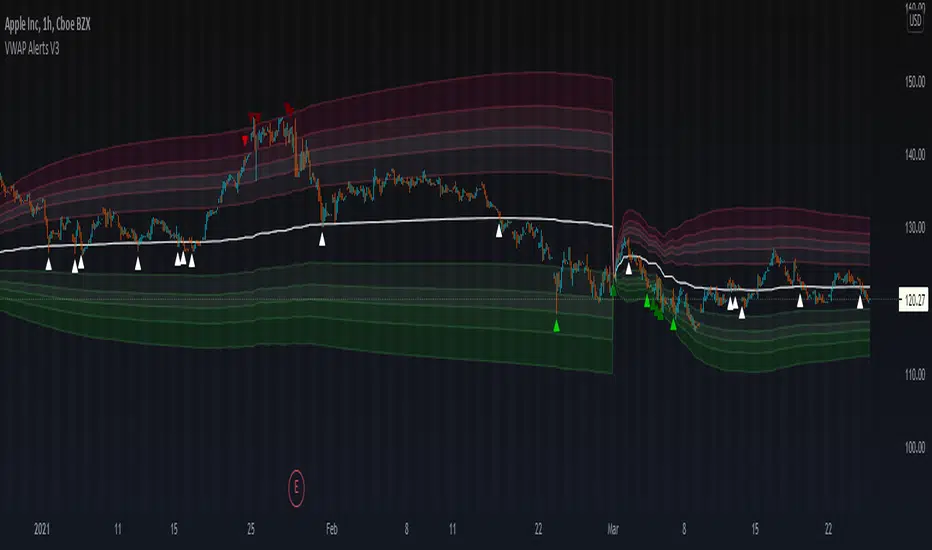
VWAP Alerts V3VWAP Alerts signal over bought/over sold conditions, relative to volume weighted average price, while deviation bands plot an extremely accurate point of mean reversion.
VWAP Alerts V3 includes multiple timeframe selection, along with multiplier input for deviation band setting
Alerts can be set for each individual band, for extreme oversold/overbought conditions, use "Vwap Low Deviation 4" and "Vwap High Deviation 4".
Alerts can also be set for VWAP bounces, by simply setting "VWAP Alert"
Robust Channel [tbiktag]Introducing the Robust Channel indicator.
This indicator is based on a remarkable property of robust statistics , namely, the resistance to the presence of data points that deviate significantly from the established trend (generally speaking, outliers ). Being outlier-resistant, the Robust Channel indicator “remembers” a pre-existing trend and thus exhibits a very peculiar "lag" in case of a sharp price change. This allows high-confidence identification of such price actions as a trend reversal, range break, pullback, etc.
In the case of trending and range-bound market conditions, the price remains within the channel most of the time, fluctuating around the central line.
Technical details
The central line is calculated using the repeated median slope algorithm. For each data point in a lookback window of a user-specified Length , this method calculates the median slope of the lines that connect that point to all other points inside the window. The overall median of these median slopes is then calculated and used as an estimate of the trend slope. The algorithm is very efficient as it uses an on-the-fly procedure to update the array containing the slopes (new data pushed - old data removed).
The outer line is then calculated as the central line plus the Length -period standard deviation of the price data multiplied by a user-defined Channel Width Factor . The inner line is defined analogously below the central line.
Usage
As a stand-alone indicator, the Robust Channel can be applied similarly to the Bollinger Bands and the Keltner Channel:
A close above the outer line can be interpreted as a bullish signal and a close below the inner line as a bearish signal.
Likewise, a return to the channel from below after a break may serve as a bullish signal, while a return from above may indicate bearish sentiment.
Robust Channel can be also used to confirm chart patterns such as double tops and double bottoms.
If you like this indicator, feel free to leave your feedback in the comments below!

Quadratic Regression Trend ChannelIt's been a while since I have published anything meaningful for all members, but here is my next step in evolution of trend channel technology, my attempt at "Quadratic Regression Trend Channel" custom tailored for regression enthusiasts. I'm actually doing a lot more than my profile shall ever reveal. Many members may have heard of "polynomial regression channel"(PRC), but I wouldn't accurately label this as having the "poly-" capability in it with differing amounts of nth degrees/orders.
This indicator is derived from my "HLC Banded Quadratic Regression" indicator, the 3rd indicator I had ever published in my earliest days of tinkering around with Pine Script. It always had a destiny, and TV has graciously delivered on upgrading Pine with many new capabilities to run this algorithm with ease and in the manner that I wished to write it. Any subscribing TradingViewer has the freedom to use this indicator and as many as they shall desire.
Blessed is the "Immense Power of Pine" in 2021, as I utilized a multitude of new Pine features including extensive use of arrays for the quadratic regression formula, arrays of line.new(), input(group=), and input(inline=). I spent an incredible amount of time creating this, and it was no easy task to condense this amount of sophistication within less than 150 lines of code at the time of this original debut release. I have striven to achieve the indicator's computational efficiency potential to be as fast as possible with highly optimized code to handle the large amount of sampling it utilizes and is capable of. I hope you find it analytically favorable and beyond your expectations.
First of all, it has different sampling methods I haven't seen in any other PRC available, providing tightly snug and fit curvatures dependent on my optional choices not found in comparable indicators. This yields the best quality of fit I can provide by employing quadratic regression in order to provide a superb "visual analysis" of your price action in high noise environments. I also included my novel time warp feature to rewind the indicator regression into a previous state of time. If you're trading on really fast timeframes, I included an option to only calculate once per bar at it's closure. This will aid with computational efficiency of the TV servers, and it's intended to not to slow down your charting experience amongst a wide assortment of other indicators in your overlay chart.
I allowed a couple of variability methods for the confidence bands. A variety of coloring options, line thickness, and other perks are there to accommodate your distinct visual acuity. There is also a nifty option to color the regression by the slope of the curvatures. This is enabled by default, and I anticipate that you may find that color option uniquely useful. The amount of chords in the curvature are automatically calculated depending on the regression period selected to achieve a nice fluid arch for any setting.
Anyhow, I believe that sums up most of it's important characteristics in a brief explanation. It's potential is best personally discovered by simply using it with the myriad of control settings available. I published it with protected code, because I simply wanted to confine this monstrosity to my TradingView laboratory. I would rather not have this thing uncaged, rabidly running around the planet frothing out of the mouth on a Frankenstein AI later, unless it's mine on a short leash. Besides, I'm still trying to figure out the math behind "cubic regression". :)
Sorry in advance about not providing the source code, I hope you'll understand... We ALL know what devastation happens when things are "unleashed" from a BSL-4 lab to run amok. Countless billions have yet to learn a horrific lesson about the mania of evil at a future Geneva convention. If you don't know the mythical story about Pandora's box(a jar actually), look it up!
Features List Includes:
Calculation Throttling
Regression Period
Time Warp
Multiple Sampling Methods
Confidence Bands Variability Controls
Indicator Customization Options
When available time provides itself, I will consider your inquiries, thoughts, and concepts presented below in the comments section, should you have any questions or comments regarding this indicator. When my indicators achieve more prevalent use by TV members , I may implement more ideas when they present themselves as worthy additions. Have a profitable future everyone!
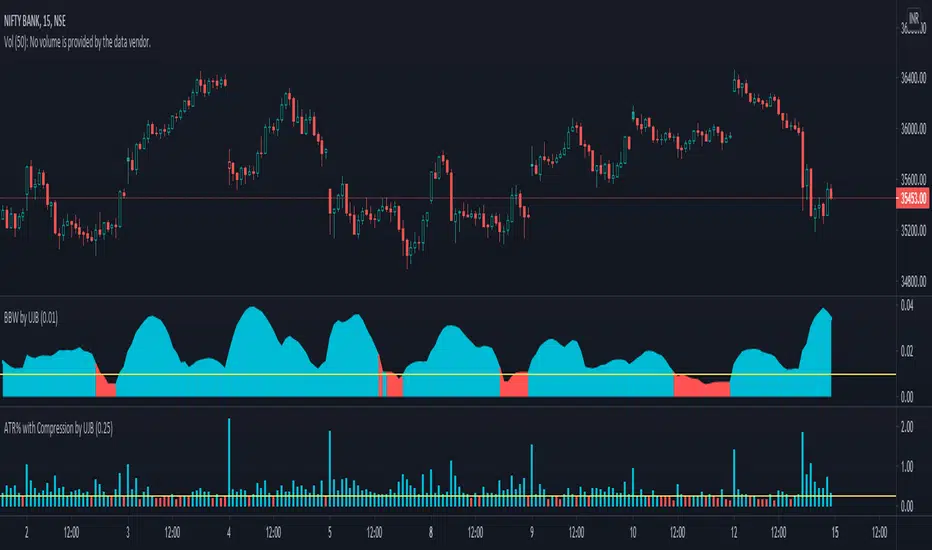
Bollinger Bands Width with Compression by UJBBollinger Band width % with compression line and color changing area.
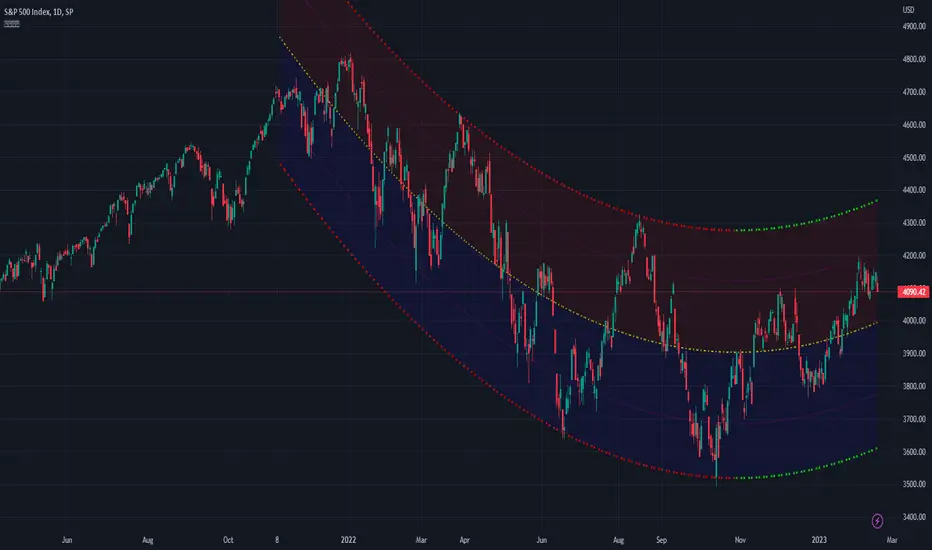
Monte Carlo Range Forecast [DW]This is an experimental study designed to forecast the range of price movement from a specified starting point using a Monte Carlo simulation.
Monte Carlo experiments are a broad class of computational algorithms that utilize random sampling to derive real world numerical results.
These types of algorithms have a number of applications in numerous fields of study including physics, engineering, behavioral sciences, climate forecasting, computer graphics, gaming AI, mathematics, and finance.
Although the applications vary, there is a typical process behind the majority of Monte Carlo methods:
-> First, a distribution of possible inputs is defined.
-> Next, values are generated randomly from the distribution.
-> The values are then fed through some form of deterministic algorithm.
-> And lastly, the results are aggregated over some number of iterations.
In this study, the Monte Carlo process used generates a distribution of aggregate pseudorandom linear price returns summed over a user defined period, then plots standard deviations of the outcomes from the mean outcome generate forecast regions.
The pseudorandom process used in this script relies on a modified Wichmann-Hill pseudorandom number generator (PRNG) algorithm.
Wichmann-Hill is a hybrid generator that uses three linear congruential generators (LCGs) with different prime moduli.
Each LCG within the generator produces an independent, uniformly distributed number between 0 and 1.
The three generated values are then summed and modulo 1 is taken to deliver the final uniformly distributed output.
Because of its long cycle length, Wichmann-Hill is a fantastic generator to use on TV since it's extremely unlikely that you'll ever see a cycle repeat.
The resulting pseudorandom output from this generator has a minimum repetition cycle length of 6,953,607,871,644.
Fun fact: Wichmann-Hill is a widely used PRNG in various software applications. For example, Excel 2003 and later uses this algorithm in its RAND function, and it was the default generator in Python up to v2.2.
The generation algorithm in this script takes the Wichmann-Hill algorithm, and uses a multi-stage transformation process to generate the results.
First, a parent seed is selected. This can either be a fixed value, or a dynamic value.
The dynamic parent value is produced by taking advantage of Pine's timenow variable behavior. It produces a variable parent seed by using a frozen ratio of timenow/time.
Because timenow always reflects the current real time when frozen and the time variable reflects the chart's beginning time when frozen, the ratio of these values produces a new number every time the cache updates.
After a parent seed is selected, its value is then fed through a uniformly distributed seed array generator, which generates multiple arrays of pseudorandom "children" seeds.
The seeds produced in this step are then fed through the main generators to produce arrays of pseudorandom simulated outcomes, and a pseudorandom series to compare with the real series.
The main generators within this script are designed to (at least somewhat) model the stochastic nature of financial time series data.
The first step in this process is to transform the uniform outputs of the Wichmann-Hill into outputs that are normally distributed.
In this script, the transformation is done using an estimate of the normal distribution quantile function.
Quantile functions, otherwise known as percent-point or inverse cumulative distribution functions, specify the value of a random variable such that the probability of the variable being within the value's boundary equals the input probability.
The quantile equation for a normal probability distribution is μ + σ(√2)erf^-1(2(p - 0.5)) where μ is the mean of the distribution, σ is the standard deviation, erf^-1 is the inverse Gauss error function, and p is the probability.
Because erf^-1() does not have a simple, closed form interpretation, it must be approximated.
To keep things lightweight in this approximation, I used a truncated Maclaurin Series expansion for this function with precomputed coefficients and rolled out operations to avoid nested looping.
This method provides a decent approximation of the error function without completely breaking floating point limits or sucking up runtime memory.
Note that there are plenty of more robust techniques to approximate this function, but their memory needs very. I chose this method specifically because of runtime favorability.
To generate a pseudorandom approximately normally distributed variable, the uniformly distributed variable from the Wichmann-Hill algorithm is used as the input probability for the quantile estimator.
Now from here, we get a pretty decent output that could be used itself in the simulation process. Many Monte Carlo simulations and random price generators utilize a normal variable.
However, if you compare the outputs of this normal variable with the actual returns of the real time series, you'll find that the variability in shocks (random changes) doesn't quite behave like it does in real data.
This is because most real financial time series data is more complex. Its distribution may be approximately normal at times, but the variability of its distribution changes over time due to various underlying factors.
In light of this, I believe that returns behave more like a convoluted product distribution rather than just a raw normal.
So the next step to get our procedurally generated returns to more closely emulate the behavior of real returns is to introduce more complexity into our model.
Through experimentation, I've found that a return series more closely emulating real returns can be generated in a three step process:
-> First, generate multiple independent, normally distributed variables simultaneously.
-> Next, apply pseudorandom weighting to each variable ranging from -1 to 1, or some limits within those bounds. This modulates each series to provide more variability in the shocks by producing product distributions.
-> Lastly, add the results together to generate the final pseudorandom output with a convoluted distribution. This adds variable amounts of constructive and destructive interference to produce a more "natural" looking output.
In this script, I use three independent normally distributed variables multiplied by uniform product distributed variables.
The first variable is generated by multiplying a normal variable by one uniformly distributed variable. This produces a bit more tailedness (kurtosis) than a normal distribution, but nothing too extreme.
The second variable is generated by multiplying a normal variable by two uniformly distributed variables. This produces moderately greater tails in the distribution.
The third variable is generated by multiplying a normal variable by three uniformly distributed variables. This produces a distribution with heavier tails.
For additional control of the output distributions, the uniform product distributions are given optional limits.
These limits control the boundaries for the absolute value of the uniform product variables, which affects the tails. In other words, they limit the weighting applied to the normally distributed variables in this transformation.
All three sets are then multiplied by user defined amplitude factors to adjust presence, then added together to produce our final pseudorandom return series with a convoluted product distribution.
Once we have the final, more "natural" looking pseudorandom series, the values are recursively summed over the forecast period to generate a simulated result.
This process of generation, weighting, addition, and summation is repeated over the user defined number of simulations with different seeds generated from the parent to produce our array of initial simulated outcomes.
After the initial simulation array is generated, the max, min, mean and standard deviation of this array are calculated, and the values are stored in holding arrays on each iteration to be called upon later.
Reference difference series and price values are also stored in holding arrays to be used in our comparison plots.
In this script, I use a linear model with simple returns rather than compounding log returns to generate the output.
The reason for this is that in generating outputs this way, we're able to run our simulations recursively from the beginning of the chart, then apply scaling and anchoring post-process.
This allows a greater conservation of runtime memory than the alternative, making it more suitable for doing longer forecasts with heavier amounts of simulations in TV's runtime environment.
From our starting time, the previous bar's price, volatility, and optional drift (expected return) are factored into our holding arrays to generate the final forecast parameters.
After these parameters are computed, the range forecast is produced.
The basis value for the ranges is the mean outcome of the simulations that were run.
Then, quarter standard deviations of the simulated outcomes are added to and subtracted from the basis up to 3σ to generate the forecast ranges.
All of these values are plotted and colorized based on their theoretical probability density. The most likely areas are the warmest colors, and least likely areas are the coolest colors.
An information panel is also displayed at the starting time which shows the starting time and price, forecast type, parent seed value, simulations run, forecast bars, total drift, mean, standard deviation, max outcome, min outcome, and bars remaining.
The interesting thing about simulated outcomes is that although the probability distribution of each simulation is not normal, the distribution of different outcomes converges to a normal one with enough steps.
In light of this, the probability density of outcomes is highest near the initial value + total drift, and decreases the further away from this point you go.
This makes logical sense since the central path is the easiest one to travel.
Given the ever changing state of markets, I find this tool to be best suited for shorter term forecasts.
However, if the movements of price are expected to remain relatively stable, longer term forecasts may be equally as valid.
There are many possible ways for users to apply this tool to their analysis setups. For example, the forecast ranges may be used as a guide to help users set risk targets.
Or, the generated levels could be used in conjunction with other indicators for meaningful confluence signals.
More advanced users could even extrapolate the functions used within this script for various purposes, such as generating pseudorandom data to test systems on, perform integration and approximations, etc.
These are just a few examples of potential uses of this script. How you choose to use it to benefit your trading, analysis, and coding is entirely up to you.
If nothing else, I think this is a pretty neat script simply for the novelty of it.
----------
How To Use:
When you first add the script to your chart, you will be prompted to confirm the starting date and time, number of bars to forecast, number of simulations to run, and whether to include drift assumption.
You will also be prompted to confirm the forecast type. There are two types to choose from:
-> End Result - This uses the values from the end of the simulation throughout the forecast interval.
-> Developing - This uses the values that develop from bar to bar, providing a real-time outlook.
You can always update these settings after confirmation as well.
Once these inputs are confirmed, the script will boot up and automatically generate the forecast in a separate pane.
Note that if there is no bar of data at the time you wish to start the forecast, the script will automatically detect use the next available bar after the specified start time.
From here, you can now control the rest of the settings.
The "Seeding Settings" section controls the initial seed value used to generate the children that produce the simulations.
In this section, you can control whether the seed is a fixed value, or a dynamic one.
Since selecting the dynamic parent option will change the seed value every time you change the settings or refresh your chart, there is a "Regenerate" input built into the script.
This input is a dummy input that isn't connected to any of the calculations. The purpose of this input is to force an update of the dynamic parent without affecting the generator or forecast settings.
Note that because we're running a limited number of simulations, different parent seeds will typically yield slightly different forecast ranges.
When using a small number of simulations, you will likely see a higher amount of variance between differently seeded results because smaller numbers of sampled simulations yield a heavier bias.
The more simulations you run, the smaller this variance will become since the outcomes become more convergent toward the same distribution, so the differences between differently seeded forecasts will become more marginal.
When using a dynamic parent, pay attention to the dispersion of ranges.
When you find a set of ranges that is dispersed how you like with your configuration, set your fixed parent value to the parent seed that shows in the info panel.
This will allow you to replicate that dispersion behavior again in the future.
An important thing to note when settings alerts on the plotted levels, or using them as components for signals in other scripts, is to decide on a fixed value for your parent seed to avoid minor repainting due to seed changes.
When the parent seed is fixed, no repainting occurs.
The "Amplitude Settings" section controls the amplitude coefficients for the three differently tailed generators.
These amplitude factors will change the difference series output for each simulation by controlling how aggressively each series moves.
When "Adjust Amplitude Coefficients" is disabled, all three coefficients are set to 1.
Note that if you expect volatility to significantly diverge from its historical values over the forecast interval, try experimenting with these factors to match your anticipation.
The "Weighting Settings" section controls the weighting boundaries for the three generators.
These weighting limits affect how tailed the distributions in each generator are, which in turn affects the final series outputs.
The maximum absolute value range for the weights is . When "Limit Generator Weights" is disabled, this is the range that is automatically used.
The last set of inputs is the "Display Settings", where you can control the visual outputs.
From here, you can select to display either "Forecast" or "Difference Comparison" via the "Output Display Type" dropdown tab.
"Forecast" is the type displayed by default. This plots the end result or developing forecast ranges.
There is an option with this display type to show the developing extremes of the simulations. This option is enabled by default.
There's also an option with this display type to show one of the simulated price series from the set alongside actual prices.
This allows you to visually compare simulated prices alongside the real prices.
"Difference Comparison" allows you to visually compare a synthetic difference series from the set alongside the actual difference series.
This display method is primarily useful for visually tuning the amplitude and weighting settings of the generators.
There are also info panel settings on the bottom, which allow you to control size, colors, and date format for the panel.
It's all pretty simple to use once you get the hang of it. So play around with the settings and see what kinds of forecasts you can generate!
----------
ADDITIONAL NOTES & DISCLAIMERS
Although I've done a number of things within this script to keep runtime demands as low as possible, the fact remains that this script is fairly computationally heavy.
Because of this, you may get random timeouts when using this script.
This could be due to either random drops in available runtime on the server, using too many simulations, or running the simulations over too many bars.
If it's just a random drop in runtime on the server, hide and unhide the script, re-add it to the chart, or simply refresh the page.
If the timeout persists after trying this, then you'll need to adjust your settings to a less demanding configuration.
Please note that no specific claims are being made in regards to this script's predictive accuracy.
It must be understood that this model is based on randomized price generation with assumed constant drift and dispersion from historical data before the starting point.
Models like these not consider the real world factors that may influence price movement (economic changes, seasonality, macro-trends, instrument hype, etc.), nor the changes in sample distribution that may occur.
In light of this, it's perfectly possible for price data to exceed even the most extreme simulated outcomes.
The future is uncertain, and becomes increasingly uncertain with each passing point in time.
Predictive models of any type can vary significantly in performance at any point in time, and nobody can guarantee any specific type of future performance.
When using forecasts in making decisions, DO NOT treat them as any form of guarantee that values will fall within the predicted range.
When basing your trading decisions on any trading methodology or utility, predictive or not, you do so at your own risk.
No guarantee is being issued regarding the accuracy of this forecast model.
Forecasting is very far from an exact science, and the results from any forecast are designed to be interpreted as potential outcomes rather than anything concrete.
With that being said, when applied prudently and treated as "general case scenarios", forecast models like these may very well be potentially beneficial tools to have in the arsenal.

MACD BandsThis is MACD indicator on the price chart. You can read the same information as the original MACD but much more.
You can use it the same way as MACD but it won't use any space below your chart. Also you can use signal line and cloud as trend confirmation: e.g. if above them it can be a stronger uptrend.
The signal line (yellow by default) can be used as a support-resistance line.
If teal line is above maroon line, MACD is positive, otherwise it is negative
MACD value is the width of the cloud
Cloud color is green when MACD histogram is positive, red if negative
You can change MA types
MACD and histogram values can be seen in Data Window

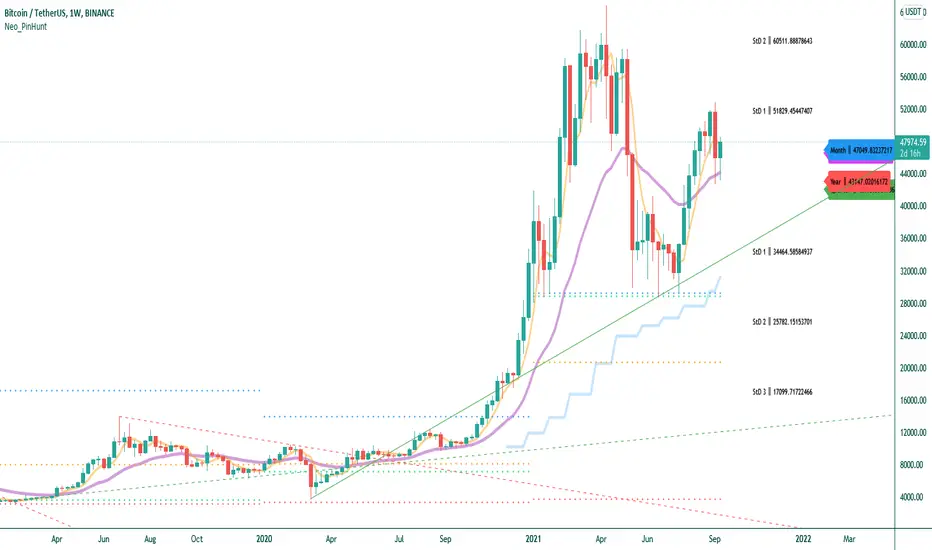
PIN HUNTERScript Components
- Volume Weighted Averages (Daily, Weekly, Monthly and Yearly)
- Price bands created with Standard Deviation
- ALMA Indicator
- Automatic Trend Lines
How to use :
* The script has been written to work properly in all time periods. It is more appropriate to use visually in periods of 4 hours or less.
* First of all, it should be checked whether the price is below or above the yellow colored "ALMA Indicator".
* When the price crosses the yellow line down, it tends to touch the price below (curve, trend line or price line). These touches are used to determine the buying level by looking at the trend direction.
It is also necessary to calculate that the number of items to break below will change depending on the strength of the trend. The script doesn't teach you this experience, the decisions you make are always up to you.
The price, which starts to rise again by touching the lower level, will show an upward trend towards the "ALMA Indicator".
* When the price crosses the yellow "ALMA Indicator" line up, it tends to touch the price (curve, trend line or price line) above it. These touches are used to determine the selling level by looking at the direction of the trend.
* The main levels that are intended to be traded are Standard Deviation bands. (Example: Price crossing StD1 level upwards targets StD2 level in Uptrend. If the trend is still up StD3 level becomes target.)
* Automatic Trend Lines are created by the script as the price moves. Extend the trend lines to the right. These lines will serve as support and resistance in the next candles. Newly formed trend lines appear solid, old trend lines appear dashed.
I wish the script will be useful to everyone. I would like to thank you in advance for any contribution and criticism you will make.
Please have a look at my other scripts. Pivot STRTGY V1 is worth a try.
(Turkish)
Script Bileşenleri
- Hacim Ağırlıklı Ortalamalar ( Günlük, Haftalık, Aylık ve Yıllık)
- Standart Sapma ile oluşturulan fiyat bantları
- ALMA İndikatörü
- Otomatik Trend Çizgileri
Nasıl Kullanılır :
* Script tüm zaman periyodlarında sağlıklı olarak çalışacak şekilde yazılmıştır. Görsel olarak 4 saat ve altındaki periyodlarda kullanılması daha uygundur.
* Öncelikle fiyatın sarı renkli "ALMA İndikatörünün" altında veya üstünde oluduğuna bakılmalıdır.
*Fiyat sarı çizgiyi aşağıya kestiğinde bir altında bulunan fiyata ( eğri, trend çizgisi ya da fiyat hattı) dokunma eğilimi gösterir. Bu dokunuşlar trend yönüne de bakılarak alım seviyesini saptamaya yarar.
Trendin gücüne bağlı olarak aşağıda kırılacak öğe sayısının değişeceğini de hesaplamak gerekir. Script size bu deneyimi öğretmez, alacağınız kararlar her zaman size aittir.
Alt seviyeye dokunarak tekrar yükselmeye başlayan fiyat "ALMA İndikatörüne" doğru yükselme eğilimi gösterecektir.
* Fiyat sarı çizgiyi yukarıya kestiğinde bir üstünde bulunan fiyata ( eğri, trend çizgisi ya da fiyat hattı) dokunma eğilimi gösterir. Bu dokunuşlar trend yönüne de bakılarak satma seviyesini saptamaya yarar.
* Ticaret yapılması amaçlanan ana seviyeler Standart Sapma bandlarıdır. (Örnek : StD1 seviyesini yukarı yönde geçen fiyat Yukarı trendde StD2 seviyesini hedefler. Trend halen yukarı ise StD3 seviyesi hedef haline gelir.)
* Otomatik Trend Çizgileri fiyat hareket ettikçe script tarafından oluşturulur. Trend çizgilerini sağa doğru şekilde uzatın. Bu çizgiler sonraki mumlarda destek ve direnç vazifesi göreceklerdir. Yeni oluşan trend çizgileri katı, eskiden oluşmuş trend çizgileri kesikli olarak gözükürler.
Scriptin herkese faydalı olmasını dilerim. Yapacağınız her türlü katkı ve eleştiri için şimdiden teşekkürlerimi sunuyorum.
Lütfen diğer scriptlerime de göz atınız. Özellikle Pivot STRTGY V1 denemeye değer bir çalışmadır.