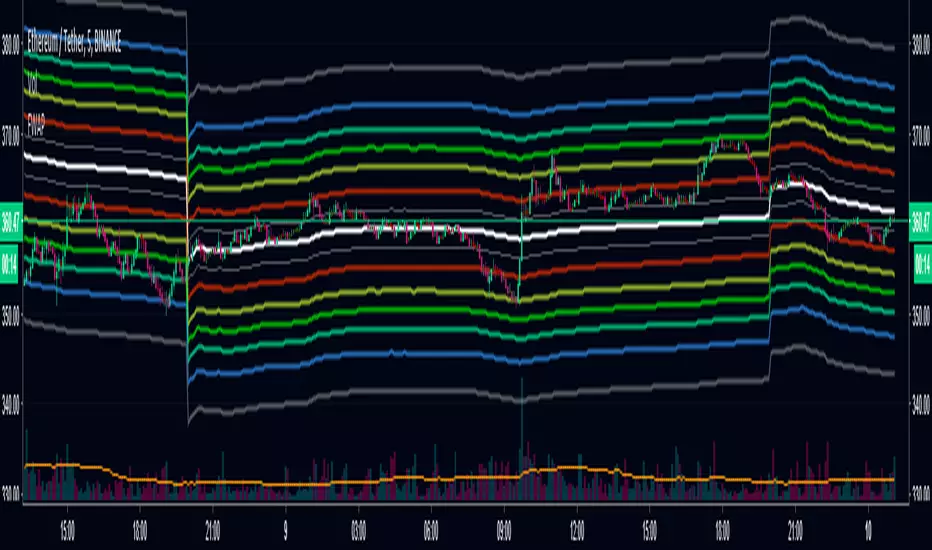
Trader Set - Uni Renko MCCIThis is what Woodie calls MCCI, a band of moving averages.
The name MCCI means Moving Commodity Channel Index, although it's one of the rare woodies original indicators (shame on you woodie lol) he suggests that the relation between the bars or price with the bands are something like the movement of the CCI indicator. I can't accept that. For me, these bands have other usages that I teach to my students.
To use this, you should set your chart on Renko, Traditional with box size of 3.
Please, don't ask for access, only my students from my classes will have access to this indicator, at least for time being. If at any time in future I wish to sell, you will find the price and how to buy in the comments bellow.
Bands

AutoEnvelopeA channel that contains approximately 95% of all price data for the past 100 bars, about five months on a daily chart. It automatically plots correct channels for any trading vehicle in any timeframe.
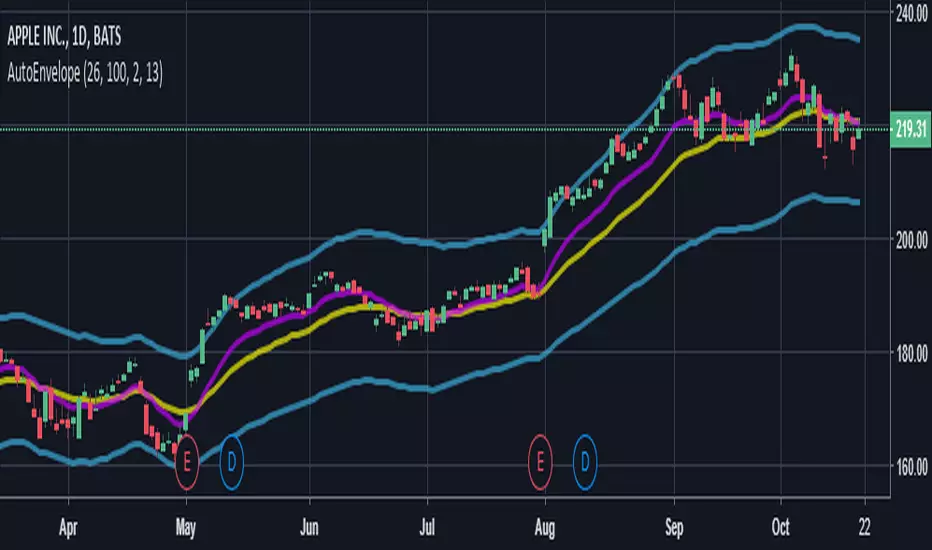
AutoEnvelopeA channel that contains approximately 95% of all price data for the past 100 bars, about five months on a daily chart. It automatically plots correct channels for any trading vehicle in any timeframe.

Bands %ABCThe % Bands multitool to keep volatility and reversals under control using quantitative approach and to trade using different signals.
Features
15 well known % bands
4 display modes ( All Lines , Average Line , Breakouts Histogram , Middle Crosses Histogram )
Bands Customization
Readable and optimized code
Implemented bands
Bomar Bands %BOMAR (by Marc Chaikin and Bob Brogan)
Bollinger Bands %B (by John Bollinger)
Apirine Exponential Standard Deviation Bands (by Vitali Apirine)
Standard Error Bands %SEB (by Jon Andersen)
Kirshenbaum Bands %KB (by Paul Kirshenbaum)
Acceleration Bands %A (by Price Headley)
Keltner Channels %KC (by Chester W. Keltner)
Stoller Average Range Channels Bands %STARC (by Manning Stoller)
Donchian Channels %DC (by Richard Donchian)
Interquartile Range Bands %IQR (by Alex Orekhov)
Median Absolute Deviation Bands %MAD (by Alex Orekhov)
Mean Absolute Deviation Bands %MEANAD (by Alex Orekhov)
Vervoort Volatility Bands %VVB (by Sylvain Vervoort)
High Low Bands %HLB
Projection Bands %PB (by Mel Widner)

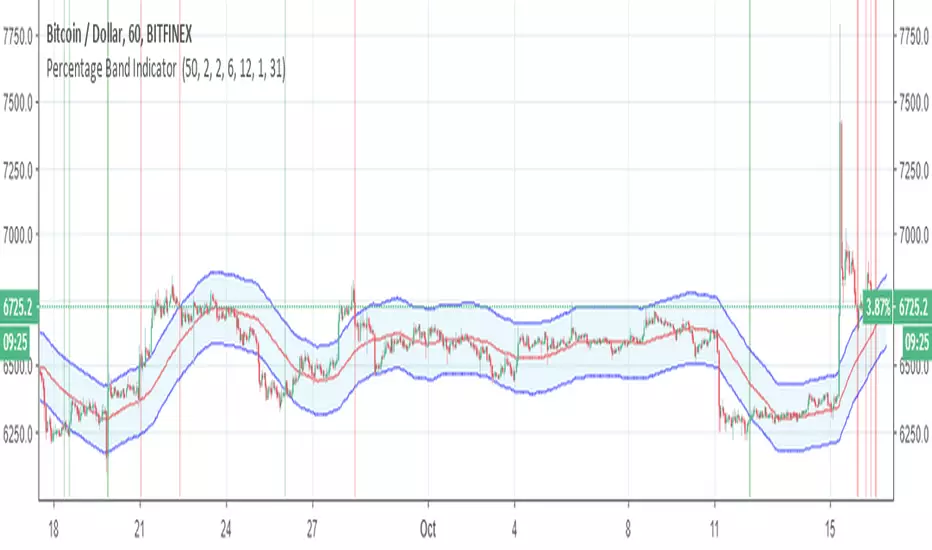
Percentage Band Indicator I added alerts in my Percentage Band strategy
You can see the strategy and backtest here
You can look at my other scripts.
www.tradingview.com
Trend Trader Bands Strategy This is plots the indicator developed by Andrew Abraham
in the Trading the Trend article of TASC September 1998
It was modified, result values wass averages.
And draw two bands above and below TT line.

Trend Trader Bands This is plots the indicator developed by Andrew Abraham
in the Trading the Trend article of TASC September 1998
It was modified, result values wass averages.
And draw two bands above and below TT line.

Standard Error Bandswith the best settings - this indicator is a better version of the bollinger bands, because it uses a linear regression .
Use this carefully and with other indicators.
RSI 𝝙 MapRSI 𝝙 Map is a on-chart application of signals produced by the original RSI 𝝙 Indicator.
RSI 𝝙 is a full study system of several RSI analysis that can be used on different timeframes and adapt strategy to trending markets or trading ranges.
Default Settings:
RSI: 13
Linear Regression of RSI: 34
Signal RSI: 5
Long RSI: 55
RSI 𝝙 Histogram: Delta between RSI and Long RSI based on Signal RSI_Length.
Activate Vertical Bar Highlights and/or Signal Candle Flags for:
- RSI Oversold/Overbought. (Default: Highlight Bar)
- Signal RSI Oversold/Overbought. (Default: Highlight Bar)
- RSI crossing its Linear Regression . (Default: Signal Candle Flag)
- RSI crossing its Long RSI . (Default: Off)
- Signal RSI crossing its RSI . (Default: Off)
- Signal RSI crossing its Long RSI . (Default: Off)
- RSI 𝝙 Histogram crossing baseline. (Default: Off)
Users can also do extra tuning in Style Section of Format options.
The market behaves differently when the pacing changes, volatility changes and when it trends or when it ranges. Develop an understanding of it with the help of this study.
Avoid risking more than 1% per trade. Be responsible for always making a priority about protecting capital and risk management. Develop emotional control and use this RSI study to develop a more complete trading system without any need for extra indicators other than Price and Volume .
👆active signals:
RSI Overbought/Oversold
Signal RSI Overbought/Oversold
RSI crossing Linear Regression
👆active signals:
RSI Overbought/Oversold
Signal RSI Overbought/Oversold
Signal RSI crossing RSI
Signal RSI crossing Long RSI
👆active signals:
RSI Overbought/Oversold
Signal RSI Overbought/Oversold
RSI crossing Linear Regression
RSI crossing Long RSI
Signal RSI crossing RSI
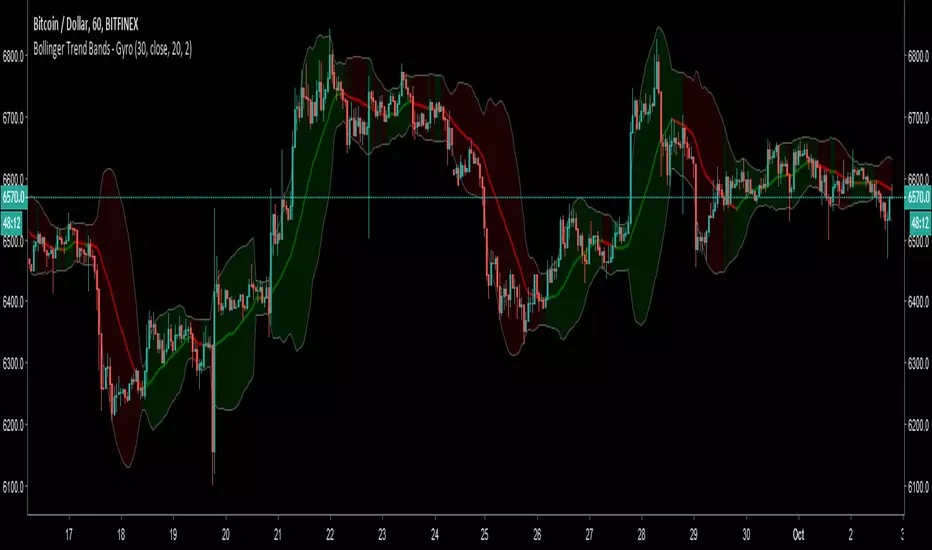
Bollinger Trend Bands - GyroStandard Bollinger Bands of which the bands are filled and MA colored depending on the condition.
Uses an algorithm which is a mixture of CCI, Moving Averages and trends.
Bands are colored red or green as a warning only, not as a trading signal.
There is no particular way to read this indicator, it is experimental.
May become more choppy on smaller time frames.
This is not financial advice, use at your own risk.
Weekly VWAP BandsOriginal Author: SandroTurriate
Weekly VWAP
Weekly VWAP close
Weekly stdv bands
Daily Vwap
band cross alerts

Interquartile Range BandsInterquartile Range Bands script.
This indicator was originally developed by Alex Orekhov at his home.
The idea based on the interquartile range en.wikipedia.org
If price breaks out from the bands then it is `outlier` price.
After breakouts price always returns to its median.
Watch squeeze/expansion periods.
Anyway use it as a supplement to the other indicators.
I will glad to get your feedback.

Triple VWMA+DVB (DeksVolumeBands)Triple VWMA+DVB (DeksVolumeBands)
Hello guys, this script offers to you a triple VWMA (Volume-Weighted Moving Average) with four bands obteined by four standard deviations from first VWMA and not from a simple SMA (Simple Moving Average), like in Bollinger Bands.
I think that are accuratest, because I inserted volumes in the bands' formula so that prices have different wheight gived by volume.
***********************************
Ciao ragazzi, questo script vi offre tre VWMA (Media Mobile Ponderata sui Volumi) con quattro bande ottenute da quattro deviazioni standard dalla prima VWMA e non dalla SMA (Media Mobile Semplice), come avviene nelle bande di Bollinger.
Penso che siano più accurate perchè ho inserito il volume nella formula delle bande cosicchè i prezzi hanno un peso diverso dato dal volume.
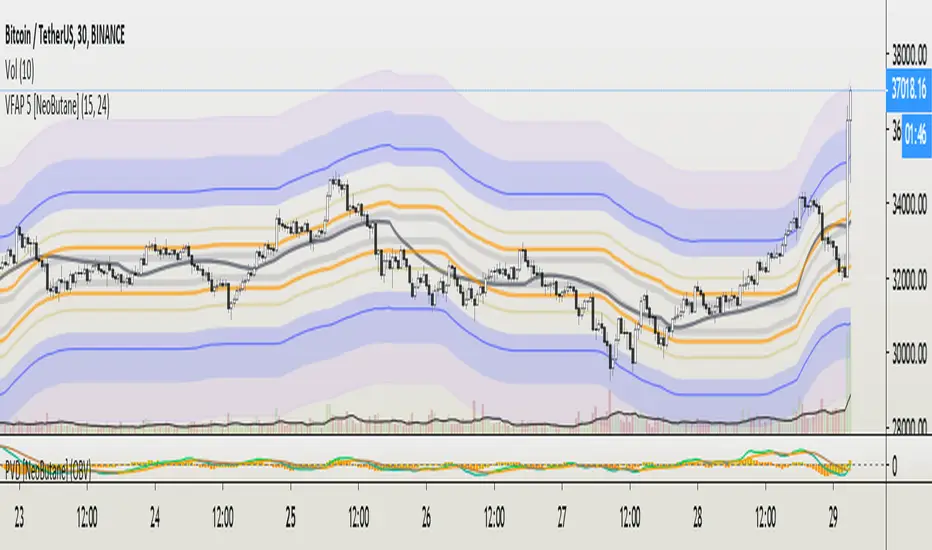
VFAP Bands: Volume Flow Aggregate Price [NeoButane]What VFAP accomplishes is finishing what VWAP started, which is to find the best liquidity for market makers to profit off the bid/ask spread. What price is the best? Of course, nobody would tell you this. Otherwise it would be easy for bigger market participants to hunt or prevent being hunted.
This is where VFAP comes in: by being able to visualize optimal liquidity zones, you will be able to enter/exit positions at the safest entries, front run the market makers, and get stopped out at the coolest prices.
The bands are consistently wicked into and provide insight to minute timeframe movements. The levels are areas of high volume where traders may be trapped or defending their position.
See here for pricing and more information: medium.com
Pictured below are the true basis bands. In a tightening/nonvolatile range, They are able to pre-define the range by having a modified formula and being sooner to update than the traditional VFAP bands.
Trial version here:
{CDT} v1.0 - MTF Fibonacci RSIMulti Timeframe Fibonacci RSI.... **HIGHLY EXPERIMENTAL**
To show retracement potential, squeeze's, support and resistance, overbought and oversold levels... super filtered too... a new RSI! Regular RSI shown on the chart for comparison.
* This is a crazy indicator that is still under development so use at your own risk, i'm putting this out here because i'd like feedback and its been a good leading indicator so far.

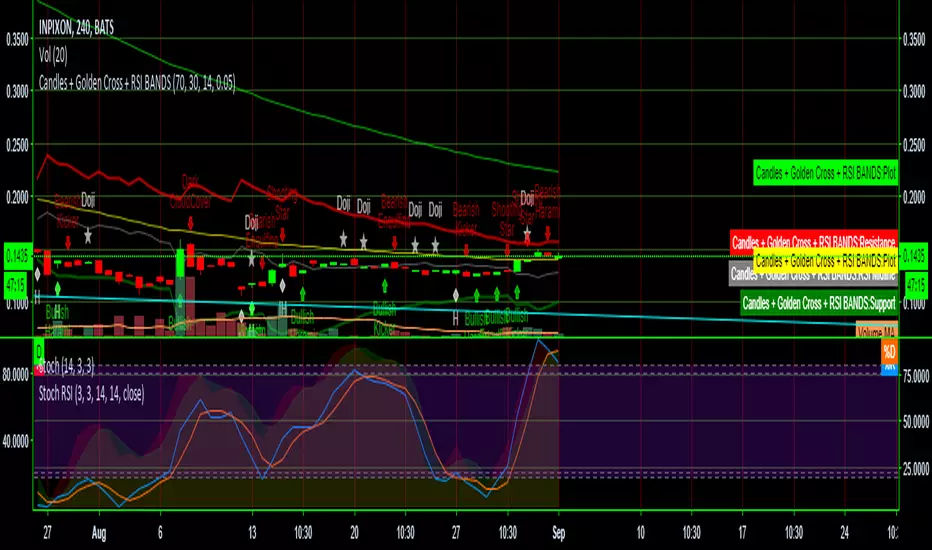
Candles + Golden Cross + RSI BANDSThis script combines three scripts for ease of use
RSI Bands LazyBear
Golden Cross MichMexTrading
Candlestick patterns identified repo32
I combined them because they work exceptionally well together in identifying reversals and other potential changes
Fixed TF BBandsCombined daily and 3D Bollinger Bands into one indicator. It will show the BBands uncoupled from the current candle TF's
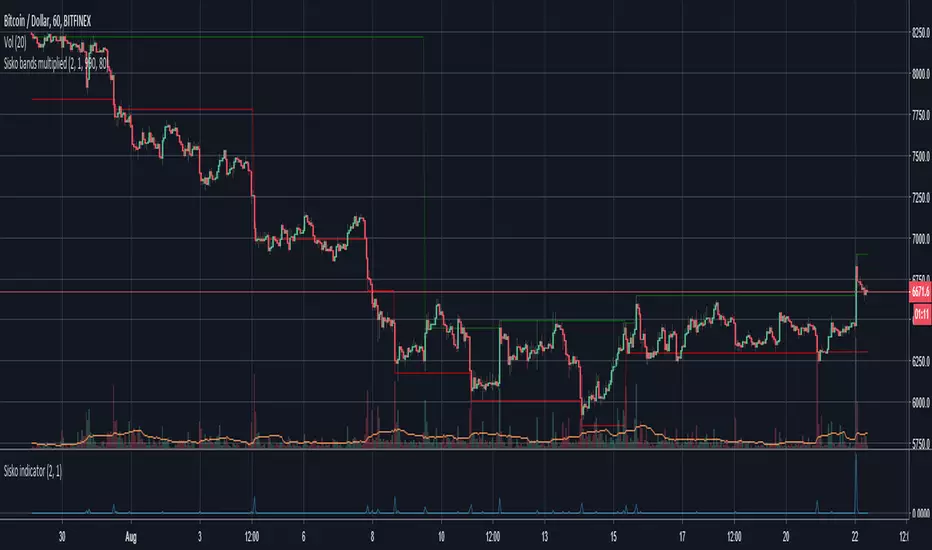
Sisko bands multipliedLooks for support and resistance by finding values at which there is much activity.
Workings:
- Exponents determine how much influence price and volume have.
- Retention percentage determines dissipation of previous oscillator high.
- Threshold percentage determines at what threshold previous oscillator high is overwritten.
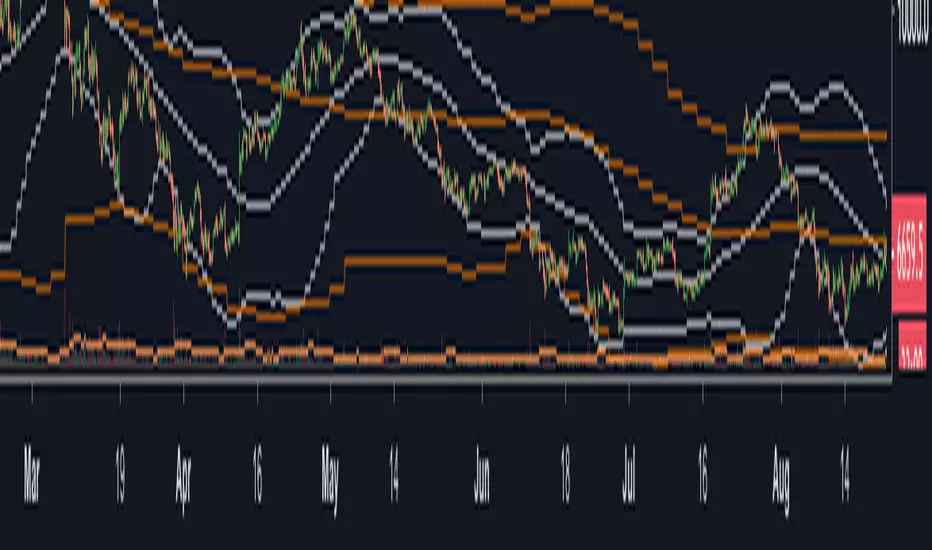
MA Study: Different Types and More [NeoButane]A study of moving averages that utilizes different tricks I've learned to optimize them. Included is Bollinger Bands, Guppy (GMMA) and Super Guppy.
The method used to make it MtF should be more precise and smoother than regular MtF methods that use the security function. For intraday timeframes, each number represents each hour, with 24 equal to 1 day. For daily, 3 is 3 day, for weekly, 4 is the 4 weekly, etc. If you're on a higher timeframe than the one selected, the length will not change.
Log-space is used to make calculations work on many cryptos. The rules for color changing Guppy is changed to make it not as choppy on MAs other than EMA. Note that length does not affect SWMA and VWAP and source does not affect VWAP.
A short summary of each moving average can be found here: medium.com
List of included MAs:
ALMA: Arnaud Legoux
Double EMA
EMA: Exponential
Hull MA
KAMA: Kaufman Adaptive
Linear Regression Curve
LSMA: Least Squares
SMA: Simple
SMMA/RMA: Smoothed/Running
SWMA: Symm. Weighted
TMA: Triangular
Triple EMA
VWMA: Volume Weighted
WMA: Weighted
ZLEMA: Zero Lag
VWAP: Vol Weighted Average
Welles Wilder MA

Fibonacci VWAPFibonacci VWAP bands provide extremely accurate pivot points and a visual scale of deviation from VWAP.