The Composite Predictive Index-(CPI-IGv5)***Main Purpose: Developed by Alcides J. Davila (TradingView: Alcides0265), a Miami-based daily trader and financial consultant specializing in commodities and capital solutions. The primary reason for CPI-IG v5 is to deliver institutional-grade predictive signals for market direction, synthesizing diverse technical factors into a probabilistic "probUp" score (upward movement likelihood) to guide high-confidence trades, aiming for 68-80% predictability in identifying trends/reversals.
Key Features: Probability Engine: Weighted combination of price delta, momentum (CMMI from RSI/mom), volume pressure, volatility (ATR/BB), trend slope, sentiment/news (manual inputs), projection (MACD ratio), and POC crossover; normalized via Z-score and tanh approx, mapped to probUp using normal CDF or logistic.
Signals and Strategies: Base/strong/ultra buy/sell gates based on prob thresholds (e.g., >0.68 for medium-term buys), bullish/bearish alignments (EMA9/20/SMA9 vs. VWAP/POC proxy), Golden/Death crosses (EMA50/200), short/medium/long confirmations, and breakout/breakdown with retest detection.
Visuals and HUD: Overlay plots (EMAs, BB, VWAP, projections), dynamic tables for stats (prob/z/ATR/delta vol), oscillator (bull/neu/bear on LTF/current/HTF), indexes (S&P/DJIA/Nasdaq), ETFs (SPY/QQQ/VIX), all resizable/movable.
Trading Modes: Versatile for scalping (short projections, 0.55 buy thresh), intraday, short/medium/long-term (stricter thresh up to 0.70, adjusted lookbacks/projections up to 500 bars).
Additional Tools: Internal backtest (with TP/SL via ATR mults, slippage/fees), alerts with cooldown, multi-timeframe alignment (HTF strict option).
Design and Protocol Structure: Modular Pine Script v5 with helpers (tanh/erf approx for ASCII-only math, safe div/Z-score norms); core series compute indicators (RSI/MACD/BB/VWAP/volume delta); linear weighted sum -> standardized Z -> prob calc -> gated signals with filters; efficient resource caps (max bars/lines/labels=500).
Reliability: Multi-factor redundancy and confirmations (e.g., simultaneous POC crosses, vol/MACD filters for ultra signals) reduce noise; HTF/LTF integration ensures alignment; backtest tracks cumR/wins/maxDD for validation; robustness via clamping/approx handles extremes/div0.
Efficiency: Real-time computation with rolling sums/Z-windows (50 bars); optimized for daily/institutional use without heavy lag; cooldowns prevent alert overload.
Robustness: Edge-case handling (e.g., na checks, mintick ranges); flexible inputs (weights, mults, modes) adapt to markets; no strict cutoff, continuous updates via security requests.
Flexibility: Customizable weights/thresh/resolutions; manual sentiment/news for external integration; toggles for visuals/backtest; suits pros, institutions, scalpers, daily traders across assets/timeframes.
Market Predictability: Claims 68-80% effectiveness via sophisticated prob model, multi-indicator fusion, and strategy layers; thresholds imply edge (e.g., 70% long-term buy prob), enhanced by projections/breakouts for forward bias.
Tiny Simplified Feedback Summary
CPI-IG v5 excels as a versatile, prob-driven institutional tool for predictive trading (68-80% edge), blending TA factors with custom modes/signals/visuals; robust and efficient for all trader levels, per code analysis and TradingView desc. Cheers!!!
Bande e canali

KIMATIX INFOS – CoreKIMATIX INFOS – Core is a professional trend and entry framework designed to identify market regime shifts, confirm directional bias, and generate high-probability trade signals.
This system blends volume flow, higher-timeframe directional context, and momentum behavior to detect genuine trend transitions while filtering out chop and noise. Trend phases are visualized through an adaptive channel, and trade signals only trigger when structure, bias, and momentum align.
The indicator displays:
Validated trend phases via dynamic trend channels
Long/Short bias based on delta flow and directional structure
Hybrid entry signals combining momentum, structure, and trend
Visual signals for the most recent trend shifts
Built for traders who want clean trend entries, controlled pullback timing, or early trend reversal detection.
Works as a standalone tool or as a modular core logic inside automated systems.
Key Features
• Trend filter to separate trending vs. sideways markets
• Adaptive channel acting as dynamic support/resistance
• Hybrid signal engine that activates only with confirmed trend context
• Arrow markers displaying the latest trend initiations
• Ready-to-use alert conditions for automatic signaling
Benefits for Traders
• Avoids chop and false breakouts
• Captures impulsive directional movement precisely
• Provides clear market direction and real-time validation
• Suitable for scalpers, day traders, and swing traders
• Supports institutional logic

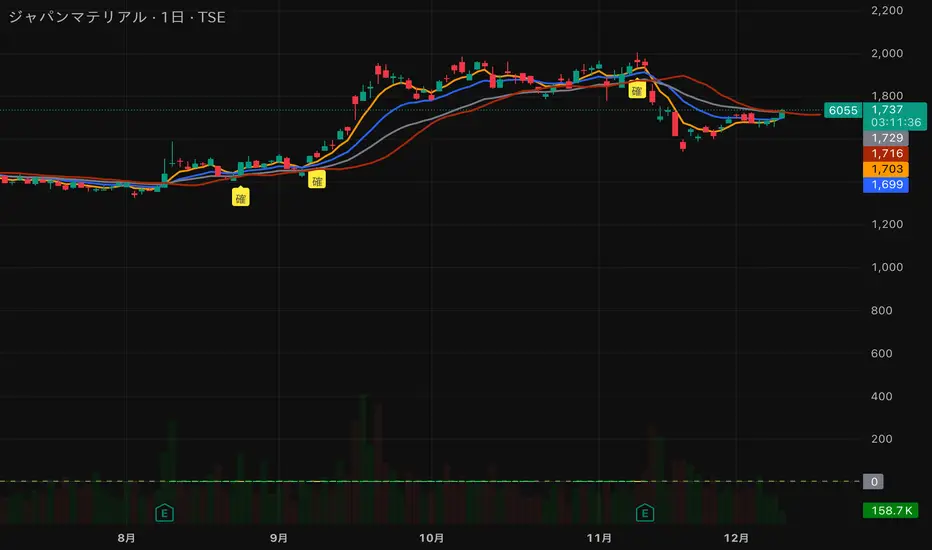
猛の掟・初動スクリーナー v3//@version=5
indicator("猛の掟・初動スクリーナー v3", overlay=true)
// ===============================
// 1. 移動平均線(EMA)設定
// ===============================
ema5 = ta.ema(close, 5)
ema13 = ta.ema(close, 13)
ema26 = ta.ema(close, 26)
plot(ema5, title="EMA5", color=color.orange, linewidth=2)
plot(ema13, title="EMA13", color=color.new(color.blue, 0), linewidth=2)
plot(ema26, title="EMA26", color=color.new(color.gray, 0), linewidth=2)
// ===============================
// 2. MACD(10,26,9)設定
// ===============================
fast = ta.ema(close, 10)
slow = ta.ema(close, 26)
macd = fast - slow
signal = ta.ema(macd, 9)
macdBull = ta.crossover(macd, signal)
// ===============================
// 3. 初動判定ロジック
// ===============================
// ゴールデン並び条件
goldenAligned = ema5 > ema13 and ema13 > ema26
// ローソク足が26EMAより上
priceAbove26 = close > ema26
// 3条件すべて満たすと「確」
bullEntry = goldenAligned and priceAbove26 and macdBull
// ===============================
// 4. スコア(0=なし / 1=猛 / 2=確)
// ===============================
score = bullEntry ? 2 : (goldenAligned ? 1 : 0)
// ===============================
// 5. スコアの色分け
// ===============================
scoreColor = score == 2 ? color.new(color.yellow, 0) : score == 1 ? color.new(color.lime, 0) : color.new(color.gray, 80)
// ===============================
// 6. スコア表示(カラム)
// ===============================
plot(score,
title="猛スコア (0=なし,1=猛,2=確)",
style=plot.style_columns,
color=scoreColor,
linewidth=3)
// 目安ライン
hline(0, "なし", color=color.new(color.gray, 80))
hline(1, "猛", color=color.new(color.lime, 60))
hline(2, "確", color=color.new(color.yellow, 60))
// ===============================
// 7. チャート上に「確」ラベル
// ===============================
plotshape(score == 2,
title="初動確定",
style=shape.labelup,
text="確",
color=color.yellow,
textcolor=color.black,
size=size.tiny,
location=location.belowbar)

Pious 3EMA-8EMA with 89ema when the stock price is above 89 ema and 3emah is above 8emah and 3emal is above 8emal buy prefers and vice versa, other conditions are additive to it

NQ DDNQ DD - Day Displacement Bands
This indicator displays dynamic upper and lower bands designed specifically for NQ (Nasdaq-100 E-mini) futures contracts, including their micro variants (MNQ).
The bands are plotted as blue circles that update at the start of each new trading session, providing key reference levels for intraday trading. These levels help traders identify potential areas of price expansion and contraction throughout the trading day.

ssdv%v2ssdv%v2 is a probabilistic trading indicator that learns from historical price behavior to predict where price is likely to move during today's trading session. Instead of using fixed values, it adapts based on what actually happened in past sessions.

Simple Multi VWAPSimple Multi VWAP - Release Notes
Overview
**Simple Multi VWAP** is a powerful Volume Weighted Average Price (VWAP) indicator that allows you to display up to **four independent VWAP lines** simultaneously on your chart, each with its own customisable anchor period. This provides traders with a comprehensive view of volume-weighted price levels across different timeframes, enabling better analysis of price action and support/resistance levels.
Key Features
Multiple VWAP Lines
- Display up to **4 independent VWAP lines** on a single chart
- Each VWAP can be individually enabled or disabled
- Each VWAP maintains its own anchor period independently
Flexible Anchor Periods
Choose from **10 different anchor periods** for each VWAP:
- **Session** - Resets daily
- **Week** - Resets weekly
- **Month** - Resets monthly
- **Quarter** - Resets quarterly
- **Year** - Resets annually
- **Decade** - Resets every 10 years
- **Century** - Resets every 100 years
- **Earnings** - Resets on earnings announcements
- **Dividends** - Resets on dividend payments
- **Splits** - Resets on stock splits
Native Styling Support
- Full integration with TradingView's native style dialog
- Right-click any VWAP line to customise:
- Colour
- Line style (solid, dashed, dotted, etc.)
- Line thickness
- Opacity
- Default colours provided for easy identification:
- **VWAP #1**: Orange (#f19d37)
- **VWAP #2**: Purple (#7859bc)
- **VWAP #3**: Red (#df484b)
- **VWAP #4**: Cyan (#54b9d1)
Global Settings
- **Source**: Choose the price source (default: Close)
- **Offset**: Shift VWAP lines forward/backward in time
- **Hide on 1D or Above**: Automatically hide VWAPs on daily or higher timeframes
How to Use
Basic Setup
1. **Add the Indicator**: Search for "Simple Multi VWAP" in TradingView's indicator library
2. **Enable VWAPs**: Check the boxes next to the VWAPs you want to display
3. **Select Anchor Periods**: Choose the anchor period for each enabled VWAP using the dropdown next to each VWAP toggle
4. **Customise Styling**: Right-click any VWAP line → "Style" to customise appearance
Recommended Configurations
Intraday Trading
- **VWAP #1**: Session (daily reset)
- **VWAP #2**: Week (weekly reset)
- **VWAP #3**: Month (monthly reset)
Swing Trading
- **VWAP #1**: Week (weekly reset)
- **VWAP #2**: Month (monthly reset)
- **VWAP #3**: Quarter (quarterly reset)
Long-term Analysis
- **VWAP #1**: Month (monthly reset)
- **VWAP #2**: Quarter (quarterly reset)
- **VWAP #3**: Year (yearly reset)
- **VWAP #4**: Decade (decade reset)
Input Settings
Global Settings
- **Source**: Price source for all VWAP calculations (default: Close)
- **Offset**: Number of bars to shift the VWAP lines (default: 0)
- **Hide VWAP on 1D or Above**: Toggle to hide all VWAPs on daily/weekly/monthly charts
VWAP Settings
Each VWAP has two settings displayed on the same line:
- **Enable Toggle**: Checkbox to show/hide the VWAP line (labelled as "VWAP#1", "VWAP#2", etc.)
- **Anchor Period**: Dropdown to select the reset period (labelled as "---> Anchor Period")
*Note: All VWAP settings are grouped under a single "VWAPs" group for easy organisation.*
Technical Details
Calculation Method
The indicator uses TradingView's built-in `ta.vwap()` function, which calculates:
**VWAP** = Σ(Price × Volume) / Σ(Volume)
The calculation resets based on the selected anchor period, ensuring accurate volume-weighted averages for each timeframe.
Event-Based Anchors
For Earnings, Dividends, and Splits anchors, the indicator uses TradingView's data requests to detect these events automatically, ensuring precise reset points.
Use Cases
Support and Resistance Levels
Multiple VWAPs help identify key support and resistance zones across different timeframes. Price often respects these levels, making them valuable for entry and exit decisions.
Trend Analysis
Compare price action against multiple VWAPs to gauge trend strength:
- Price above all VWAPs = Strong uptrend
- Price below all VWAPs = Strong downtrend
- Mixed positioning = Consolidation or trend change
Mean Reversion
When price deviates significantly from VWAP, it may indicate overextension and potential mean reversion opportunities.
Entry/Exit Signals
- **Long Entry**: Price crosses above VWAP with volume confirmation
- **Short Entry**: Price crosses below VWAP with volume confirmation
- **Exit**: Price returns to VWAP after a significant move
Tips & Best Practices
1. **Start Simple**: Begin with 1-2 VWAPs to avoid chart clutter
2. **Match Timeframes**: Use anchor periods that align with your trading timeframe
3. **Combine with Volume**: VWAP works best when combined with volume analysis
4. **Use Multiple Timeframes**: Apply the indicator to multiple chart timeframes for confirmation
5. **Customise Colours**: Use distinct colours for each VWAP to easily identify them
Notes
- The indicator requires volume data to function properly
- VWAP calculations are most accurate on intraday charts
- Event-based anchors (Earnings, Dividends, Splits) require symbol data availability
- All VWAPs share the same source input for consistency
Version Information
**Current Version**: 1.0.0

ssdv%Are you tired of drawing random boxes on your chart that don’t actually correlate to price?
This indicator solves that. It’s a Session-Based Standard Deviation Percentage Calculator designed to show you where price has actually reacted—and where it’s statistically likely to react again.
Just select the session you’re trading as Session 1 and the previous session as Session -1. The script automatically builds a live data pool from those sessions, calculates the true standard-deviation-based percentage levels, and dynamically adjusts as new data comes in.
The result?
Clean, adaptive reversal zones grounded in real volatility, not guesswork—so you can finally stop drawing boxes and start trading price with precision.

Mid-term Valuation Indicator | MiesOnChartsMedium-Term Valuation Indicator
This medium-term valuation indicator integrates multiple valuation metrics to assist investors in identifying oversold and overbought market conditions with greater precision.
How it works:
This indicator uses an average of multiple valuation indicators like technical mean reversion, sentiment and on-chain indicators. Its core innovation is an adaptive z-score aggregation that normalizes these diverse inputs (e.g., RSI for mean reversion or NUPL for on-chain sentiment) into a unified score, minimizing noise from isolated metrics and providing a more reliable valuation snapshot than traditional single-indicator tools.
All included indicators have individual flexible metrics, allowing users to customize them as needed. Additionally, the script uses color-coding based on the aggregation of z-scores, which aids in visualizing whether the market is overvalued or undervalued.
How to Interpret:
The indicator employs adaptive standard deviation bands to define extreme market zones. The red band signals a strongly overbought condition, while the green band indicates a significantly oversold condition.
How to Apply:
Investors can leverage these extreme levels as strategic points for taking profits or implementing dollar-cost averaging (DCA) strategies, optimizing entry and exit decisions in the market.
Disclaimer: NOT Financial advice. Past performance is not indicative of future results. No trading strategy can guarantee success in financial markets.

Moon Boys LineWe have the 44 and 125 day moving averages. When they cross, the trend is bullish or bearish.

The Composite Predictive Index-(CPI-IG v5)**The Composite Predictive Index (CPI-IG v5) is a comprehensive Market Institutional Indicator created by Alcides Davila and is an overlay indicator designed for institutional-grade market analysis and trading signals. Nevertheless, Daily-Short-Term Traders may also take advantage of this robust and efficient indicator. Still, they must make the necessary adjustments for scalping and for short-, medium-, and long-term trading. It synthesizes multiple technical factors (e.g., RSI, MACD, Bollinger Bands, VWAP, EMAs/SMAs, volume pressure, delta volume, manual sentiment/news inputs) into a weighted Z-score-based probability model (probUp) for forecasting price direction—generating buy/sell gates, strong/ultra signals, and short-term projections. It supports multi-timeframe alignment (HTF/LTF), breakout/breakdown detection with retests, internal backtesting, and alerts, while displaying dashboards for probabilities, stats, oscillators (bull/bear/neutral), major indexes (S&P, DJIA, Nasdaq), and ETFs (SPY, QQQ, etc.).
In terms of structure, it's highly reliable and productive: modular code with error-handling (safe divisions, approximations for tanh/erf), customizable modes (scalp to long-term), efficient resource use (max_bars_back=500), and cooldowns to prevent alert spam. Quality is strong, with transparent math, visual flexibility, and no apparent logic bugs—though real-world performance depends on market conditions and user tuning.
Investors can benefit significantly by using it for data-driven decisions, reducing bias through probability scores (e.g., >68% for buys), timing entries/exits with cross-confirmations, and monitoring broader market context via indexes/ETFs. It's especially useful for trend-following or reversal strategies, potentially improving win rates in volatile markets, but, like all indicators, it's not foolproof—use it in combination with risk management.
Strongest feature: The probability engine, which normalizes diverse signals into a robust, Z-scaled probUp metric (via the normal CDF or a logistic), enabling a quantifiable edge over traditional oscillators. Cheers...!!!

CRT Inside Hunter + FVG (Final Fusion)CRT Inside Hunter + FVG (Final Fusion)
This indicator automatically detects Inside Bar → CRT (Consolidation – Range – Trap) structures and generates LONG / SHORT BAM breakout signals whenever the mother bar is violated.
It also includes optional Fair Value Gap (FVG) confirmation.
🔍 1. Inside Bar → Mother Bar Detection
Automatically identifies inside bar sequences.
Creates the Mother Bar with High / Low boundaries.
Draws Q1 – Mid – Q3 levels as visual guidance.
Auto-removes CRT structure after a user-defined number of bars.
🚨 2. BAM Breakout Signals
Breakout events trigger automatic trade signals:
Upper violation → SHORT signal
Lower violation → LONG signal
Signals are displayed as labels and fully support alerts.
🟦 3. FVG (Fair Value Gap) Confirmation
Optional FVG detection mode:
Automatically marks Demand and Supply FVG zones.
If the price touches an FVG at the breakout moment, the signal becomes FVG-Confirmed.
🎨 4. Additional Features
Inside bars highlighted for clarity.
Clean, minimal drawing system.
All drawings reset daily for maximum chart hygiene.
This tool combines liquidity, imbalance, breakout logic and provides a powerful structure for scalping and intraday trading.

Box TheoryBox Theory – Description
This indicator is based on the popular “Box Theory” concept, where the previous session’s High–Low range acts as the most important structure for the next session.
Traders use this because the market often reacts to the same areas where liquidity, orders, and imbalances were created in the prior session.
At every new session open, the indicator automatically records:
Previous High
Previous Low
Middle (50% level)
These three levels form a box, which becomes your roadmap for the new session.
This method is widely used because it highlights where most reversals, sweeps, and reactions occur—without needing any extra indicators.
How the Zones Are Calculated
Previous High
The highest price of the last session.
This forms the top edge, which acts as resistance and the basis for the Sell Zone.
Previous Low
The lowest price of the last session.
This forms the bottom edge, acting as support and the basis for the Buy Zone.
Middle Line (50% Level)
The exact midpoint between High and Low.
This is the fair-value zone, where price often consolidates and becomes directionless.
No signals are triggered near the middle, because trades taken here historically have low accuracy.
Buy Zone (Green Area)
The lower part of the box.
Price often reacts here because this area held buyers in the previous session.
When price enters this green zone inside the box, the indicator can show a Buy Zone label.
Sell Zone (Red Area)
The upper part of the box.
Price commonly rejects here because this area acted as resistance previously.
When price enters this red zone inside the box, the indicator can show a Sell Zone label.
How Zone Size Is Set (Sensitivity %)
You can adjust how big the Buy/Sell zones are using the Sensitivity (%) input.
Lower % → Smaller zones → More precise signals
Higher % → Larger zones → Signals appear earlier and from farther away
Formula:
Zone Size = (Previous High − Previous Low) × (Sensitivity % ÷ 100)
This lets you customize how tight or how early your signals appear.
Inside-Box Only Logic
The indicator only works inside the previous session’s range.
If price breaks above the previous High → No sell signal
If price breaks below the previous Low → No buy signal
This avoids false signals during breakouts or trending markets.
Alerts
The indicator includes two alerts:
Buy Zone Alert → Triggers when price enters the Buy Zone
Sell Zone Alert → Triggers when price enters the Sell Zone
Just enable them in TradingView’s alert panel.

Bollinger Bands SMThis script plots four custom Bollinger Band envelopes on price to map volatility, trend and extremes on a single chart.
What it shows
BB Set 1 – 50-length, 1.25σ (cyan/red)
Short–to–medium-term volatility channel. Good for spotting squeezes, early breakouts and pullbacks in the active trend.
BB Set 2 – 200-length, 1.25σ (lime/yellow)
Higher-timeframe “trend envelope”. When price rides the upper band the trend is strong; closes below the lower band often signal deeper corrections.
BB Set 3 – 14-length, 3.2σ (white/blue, green fill)
Fast, very wide band for short-term volatility spikes. Tags of these outer bands highlight overextended moves that often mean-revert.
BB Set 4 – 200-length, 5σ (white/red, purple fill)
Extreme long-term volatility boundary. Price reaching this zone is rare and can mark exhaustion, blow-off moves or panic washes.
How I use it
Look for squeezes where bands contract tightly before large moves.
Watch for confluence when multiple bands line up as support/resistance.
Treat outer band touches as risk zones, not automatic reversal signals – wait for confirmation from structure or your own system.
This is a visual tool to understand volatility and trend context, not a standalone buy/sell system and not financial advice.

The Composite Predictive Index-(CPI-IG v5)*The Composite Predictive Index (CPI-IG v5) is the creation of Alcides Davila (Alcides0265), Daily Trader. This indicator, which I call "The Predictor Index" and is also known as "The Composite Predictive Index (CPI-IG v5)", is an overlay indicator designed for institutional-grade market analysis and trading signals. Daily traders could also take advantage of this indicator by making the necessary adjustments for each trading session, whether for short-term (scalping), medium-term, or long-term investments. It synthesizes multiple technical factors (e.g., RSI, MACD, Bollinger Bands, VWAP, EMAs/SMAs, volume pressure, delta volume, manual sentiment/news inputs) into a weighted Z-score-based probability model (probUp) for forecasting price direction—generating buy/sell gates, strong/ultra signals, and short-term projections. It supports multi-timeframe alignment (HTF/LTF), breakout/breakdown detection with retests, internal backtesting, and alerts, while displaying dashboards for probabilities, stats, oscillators (bull/bear/neutral), major indexes (S&P, DJIA, Nasdaq), and ETFs (SPY, QQQ, etc.).
In terms of structure, it's highly reliable and productive: modular code with error-handling (safe divisions, approximations for tanh/erf), customizable modes (scalp to long-term), efficient resource use (max_bars_back=500), and cooldowns to prevent alert spam. Quality is strong, with transparent math, visual flexibility, and no apparent logic bugs—though real-world performance depends on market conditions and user tuning.
Investors can benefit significantly by using it for data-driven decisions, reducing bias through probability scores (e.g., >68% for buys), timing entries/exits with cross-confirmations, and monitoring broader market context via indexes/ETFs. It's especially useful for trend-following or reversal strategies, potentially improving win rates in volatile markets, but, like all indicators, it's not foolproof—use it in combination with risk management.
Strongest feature: The probability engine, which normalizes diverse signals into a robust, Z-scaled probUp metric (via the normal CDF or a logistic), enabling a quantifiable edge over traditional oscillators.

The Composite Predictive Index (CPI-IG v5)The Composite Predictive Index (CPI-IG v5) is the creation of Alcides Davila (Alcides0265), Daily Trader. This indicator, which I call "The Predictor Index" and is also known as "The Composite Predictive Index (CPI-IG v5)", is an overlay indicator designed for institutional-grade market analysis and trading signals. Daily traders could also take advantage of this indicator by making the necessary adjustments for the trading sessions, whether for short (scalping), medium, or long-term investments. It synthesizes multiple technical factors (e.g., RSI, MACD, Bollinger Bands, VWAP, EMAs/SMAs, volume pressure, delta volume, manual sentiment/news inputs) into a weighted Z-score-based probability model (probUp) for forecasting price direction—generating buy/sell gates, strong/ultra signals, and short-term projections. It supports multi-timeframe alignment (HTF/LTF), breakout/breakdown detection with retests, internal backtesting, and alerts, while displaying dashboards for probabilities, stats, oscillators (bull/bear/neutral), major indexes (S&P, DJIA, Nasdaq), and ETFs (SPY, QQQ, etc.).
In terms of structure, it's highly reliable and productive: modular code with error-handling (safe divisions, approximations for tanh/erf), customizable modes (scalp to long-term), efficient resource use (max_bars_back=500), and cooldowns to prevent alert spam. Quality is strong, with transparent math, visual flexibility, and no apparent logic bugs—though real-world performance depends on market conditions and user tuning.
Investors can benefit significantly by using it for data-driven decisions, reducing bias through probability scores (e.g., >68% for buys), timing entries/exits with cross-confirmations, and monitoring broader market context via indexes/ETFs. It's especially useful for trend-following or reversal strategies, potentially improving win rates in volatile markets, but, like all indicators, it's not foolproof—use it in combination with risk management.
Strongest feature: The probability engine, which normalizes diverse signals into a robust, Z-scaled probUp metric (via the normal CDF or a logistic), enabling a quantifiable edge over traditional oscillators.

Daily Range Box (RIC) V0.2This update enhances the "Daily Range Box" indicator by adding user-configurable inputs for colors and line styles. Users can now customize the box border color and the midline color independently through dedicated color picker inputs. Additionally, separate dropdown menus allow selection of line styles (Solid, Dashed, or Dotted) for both the box border and the midline, enabling personalized visualization while maintaining the core functionality of drawing daily range boxes with midlines across all timeframes.

Indicator ***TuYa*** V8.2 – HH/HL MTF + Peak Mid ZoneIndicator TuYa V8.0 – HH/HL MTF + Peak Mid Zone
TuYa V8.0 combines multi-timeframe market structure with a Peak Reaction midline to create clean, rule-based reversal and trend entries – designed primarily for 1-minute execution with 1-hour bias.
🧠 Core Concept
This indicator fuses three ideas:
HTF Peak Reaction Midline (1H)
Uses a Peak Reaction style logic on the higher timeframe (HTF, default: 1H).
Identifies a reaction high and reaction low, then calculates their midpoint → the Peak Mid Zone.
This midline acts as a dynamic sentiment divider (above = premium / below = discount).
Multi-Timeframe HH/HL/LH/LL Structure
HTF structure (1H): detects HH, HL, LH, LL using pivot highs/lows.
LTF structure (1m): detects HH, HL, LH, LL on the execution timeframe (chart TF, intended for 1m).
HTF → LTF Confirmation Window
After a 1H structure event (HH, HL, LL, LH), the indicator opens a confirmation window of up to N LTF candles (default: 10 x 1m bars).
Within that window, the required 1m structure event must occur to confirm an entry.
🎯 Signal Logic
All entries are generated on the LTF (e.g. 1m chart), using HTF (e.g. 1H) bias + Peak Mid Zone:
1️⃣ Price ABOVE Peak Mid (Bullish premium zone)
Reversal SELL
HTF: HH (Higher High)
Within N 1m bars: LTF HH
→ SELL signal (fading HTF strength near premium)
Trend/Bullish BUY
HTF: HL (Higher Low)
Within N 1m bars: LTF LL
→ BUY signal (buying dips in an uptrend above midline)
2️⃣ Price BELOW Peak Mid (Bearish discount zone)
Reversal BUY
HTF: LL (Lower Low)
Within N 1m bars: LTF LL
→ BUY signal (catching potential reversal from discount)
Trend/Bearish SELL
HTF: LH (Lower High)
Within N 1m bars: LTF HH
→ SELL signal (shorting strength in a downtrend below midline)
Signals are plotted as small BUY/SELL triangles on the chart and exposed via alert conditions.
🧾 Filters & Options
⏳ HTF → LTF Delay Window
Input: “Max 1m bars after HTF trigger” (default: 10)
After a 1H HH/HL/LL/LH event, the indicator waits up to N LTF candles for the matching 1m structure pattern.
If no match occurs within the window, no signal is generated.
📉 RSI No-Trade Zone (HTF)
Toggle: Use RSI no-trade zone
Inputs:
RSI Length (HTF)
No-trade lower bound (default 45)
No-trade upper bound (default 65)
If HTF RSI is inside the defined band (e.g. 45–65), signals are blocked (no-trade regime), helping to avoid noisy mid-range conditions.
You can turn this filter ON/OFF and adjust the band dynamically.
🧱 5m OB / Direction Filter (Optional)
Toggle: Use 5m OB direction filter
Timeframe: Configurable (default: 5m).
Uses a simple directional proxy on the OB timeframe:
For BUY signals → require a bullish candle on OB timeframe.
For SELL signals → require a bearish candle on OB timeframe.
When enabled, this adds an extra layer of confluence by aligning entries with the short-term directional context.
⚙️ Key Inputs (Summary)
Timeframes
HTF (Peak Reaction & Structure): default 60 (1H)
Peak Reaction
Lookback bars (HTF)
ATR multiplier for zones
Show/Hide Peak Mid line
Structure
Pivot left/right bars (for HH/HL/LH/LL swings)
Toggle structure labels (HTF & LTF)
Confirmation
Max LTF bars after HTF trigger (default 10, fully configurable)
RSI Filter
Use filter (on/off)
RSI length
No-trade range (low/high)
5m OB Filter
Use filter (on/off)
OB timeframe (default 5m)
📡 Alerts & Automation
The script includes alertconditions for both BUY and SELL signals, with JSON-formatted alert messages suitable for routing to external bridges (e.g. bots, MT5/MT4, n8n, etc.).
Each alert includes:
Symbol
Side (BUY / SELL)
Price / Entry
SL & TP placeholders (from hidden plots, ready to be wired to your own logic)
Time
Performance tag
CommentCode (for strategy/type tagging on the receiver side)
You can attach these alerts to a webhook and let your execution engine handle SL/TP and order management.
📌 How to Use
Attach the indicator to a 1-minute chart.
Set HTF timeframe to 60 (or your preferred higher timeframe).
Optionally enable:
RSI regime filter
5m OB direction filter
Watch for:
Price relative to the Peak Mid line
BUY/SELL triangles that respect HTF structure + LTF confirmation + filters.
For automation, create alerts using the built-in conditions and your preferred JSON alert template.
⚠️ Disclaimer
This tool is for educational and informational purposes only.
It is not financial advice and does not guarantee profits. Always test thoroughly in replay / paper trading before using with live funds, and trade at your own risk.

Setup Keltner Banda 3 e 5 - MMS + RSI + Distância Tabela
📊 Indicator Overview: Keltner Bands + RSI + Distance Table
This custom TradingView indicator combines three powerful tools into a single, visually intuitive setup:
Keltner Channels (Bands 3x and 5x ATR)
Relative Strength Index (RSI)
Dynamic Table Displaying RSI and Price Distance from Moving Average (MMS)
🔧 Components and Functions
1. Keltner Channels (3x and 5x ATR)
Based on a Simple Moving Average (MMS) and Average True Range (ATR).
Two sets of bands are plotted:
3x ATR Bands: Used for moderate volatility signals.
5x ATR Bands: Used for high volatility extremes.
Visual fills between bands help identify overextended price zones.
2. RSI (Relative Strength Index)
Measures momentum and potential reversal zones.
Customizable overbought (default 70) and oversold (default 30) levels.
RSI values are color-coded in the table:
Green for RSI ≤ 30 (oversold)
Blue for 30 < RSI ≤ 70 (neutral)
Red for RSI > 70 (overbought)
3. Distance Table (Price vs. MMS)
Displays the real-time distance between the current price and the MMS:
In points (absolute difference)
In percentage (relative to MMS)
Helps traders assess how far price has deviated from its mean.
📈 How to Use
Trend Reversal Signals
Look for price crossing back inside the 3x or 5x Keltner Bands.
Confirm with RSI:
RSI > 70 + price re-entering from above = potential short
RSI < 30 + price re-entering from below = potential long
Volatility Zones
Price outside the 5x band indicates extreme movement.
Use this to anticipate mean reversion or breakout continuation.
Table Insights
Monitor RSI and price distance in real time.
Use color cues to quickly assess momentum and stretch.
⚙️ Customization
Adjustable parameters for:
MMS period
ATR multipliers
RSI period and thresholds
Table position on chart
Fill colors between bands
This indicator is ideal for traders who want a clean, data-rich visual tool to track volatility, momentum, and price deviation in one place.

VIX + Weekly ATR Hybrid RangeVIX + Weekly ATR Hybrid Range VIX + Weekly ATR Hybrid Range VIX + Weekly ATR Hybrid Range


Vegas plus by stanleyThis Pine Script implements a comprehensive trend-following strategy known popularly as the **Vegas Tunnel Method**. It combines multiple Exponential Moving Averages (EMAs) to define trends, pullbacks, and breakouts.
Here is a step-by-step walkthrough of how the code works, broken down by its components and logic.
---
### 1. The Anatomy (The Indicators)
The script uses three distinct groups of Moving Averages to define the market structure.
#### A. The Fast EMAs (The Trigger & Exit)
* **EMA 12 (Signal):** The fastest line. It is used to trigger entries (crossing the tunnel).
* **EMA 21 (Exit):** Used as a trailing stop. If the price crosses this line against your trade, the script signals an exit.
* **EMA 55 (Filter):** A medium-term filter, often used visually to gauge trend health.
#### B. The "Hero" Tunnel (The Action Zone)
* **EMAs 144 & 169 & 200:** These creates the main "Tunnel."
* **Function:** This acts as dynamic Support and Resistance.
* **Bullish:** If the 144 (Top) is above the 200 (Bottom), the tunnel is painted Blue.
* **Bearish:** If the 144 is below the 200, it is painted Red.
#### C. The "Anchor" Tunnel (The Deep Trend)
* **EMAs 576 & 676:** This creates a massive, slow-moving background tunnel.
* **Function:** It tells you the long-term trend. Generally, you only want to take Buy signals if price is above this Anchor, though the script logic focuses primarily on the Hero tunnel for triggers.
---
### 2. State Memory (`var` Variables)
This is a sophisticated part of the script. It uses `var` variables to "remember" where the price was in the past.
* `originPrice`: Remembers if the price was last seen **Above** (1) or **Below** (-1) the tunnel.
* `originEMA`: Remembers if the EMA 12 was last seen **Above** (1) or **Below** (-1) the tunnel.
**Why is this needed?**
To distinguish between a **Breakout** (crossing from Bear to Bull) and a **Pullback** (already Bull, dipped into tunnel, and coming back out).
---
### 3. The Four Entry Triggers
The script looks for four specific scenarios to generate a Buy or Sell signal. You can turn these on/off in the settings.
#### Trigger 1: Price U-Turn (Trend Continuation)
* **Logic:** The Price was *already* above the tunnel (`originPrice == 1`), dipped down, and is now crossing back up (`crossover`).
* **Meaning:** This is a classic "Buy the Dip" signal within an existing trend.
#### Trigger 2: EMA U-Turn (Lagging Confirmation)
* **Logic:** Similar to Trigger 1, but uses the **EMA 12** line instead of the Price candle.
* **Meaning:** This is safer but slower. It waits for the average price to curl back out of the tunnel.
#### Trigger 3: Breakthrough (Momentum Shift)
* **Logic:** The EMA 12 was previously *below* the tunnel (`originEMA == -1`) and has just crossed *above* it (`crossover`).
* **Meaning:** This is a Trend Reversal signal. The market has shifted from Bearish to Bullish.
#### Trigger 4: Wick Rejection (Touch & Go)
* **Logic:**
1. Price is generally above the tunnel.
2. The `Low` of the current candle touches the tunnel.
3. The `Low` of the *previous* candle did NOT touch the tunnel.
4. The candle closes *outside* (above) the tunnel.
* **Meaning:** The price tested the support zone and was immediately rejected (bounced off), leaving a wick.
---
### 4. Trade Management (State Machine)
The script uses a variable called `tradeState` to manage signals so they don't spam your chart.
* `tradeState = 0`: Flat (No position).
* `tradeState = 1`: Long.
* `tradeState = -1`: Short.
**The Rules:**
1. **Entry:** If `validLong` is triggered AND `tradeState` is not already 1 -> Change state to 1 (Long) and plot a **BUY** label.
2. **Holding:** If you are already in State 1, the script ignores new Buy signals.
3. **Exit:** If `tradeState` is 1 AND price closes below EMA 21 -> Change state to 0 (Flat) and plot an **Exit L** label.
---
### 5. Visual Summary
* **Green Label:** Buy Signal (Long Entry).
* **Red Label:** Sell Signal (Short Entry).
* **Grey X:** Exit Signal (Close the position).
* **Blue/Red Tunnel:** The "Hero" tunnel (144/169/200).
* **Grey Background Tunnel:** The "Anchor" tunnel (576/676).
### How to read the signals:
You are looking for the price to interact with the **Hero Tunnel** (the thinner, brighter one).
1. **Trend:** Look at the slope of the Anchor (thick grey) tunnel.
2. **Setup:** Wait for price to come back to the Hero Tunnel.
3. **Trigger:** Wait for a **Green Label**. This means the price dipped into the tunnel and is now blasting out (U-Turn), or has rejected the tunnel (Wick), or has broken through a new trend (Breakthrough).
4. **Exit:** Close the trade when the **Grey X** appears (Price crosses the EMA 21).
