Order Flow / Delta Volume IndicatorOrder Flow / Delta Volume Indicator
The Order Flow / Delta Volume Indicator is designed to give traders a comprehensive view of market activity by combining delta volume analysis, order flow imbalances, and momentum filters. This indicator is not just a mashup of components, but a carefully crafted tool that enhances decision-making by integrating various layers of market analysis into one powerful system.
How the Components Work Together:
1. Delta Volume Bars: The core of this indicator, delta volume shows the difference between buy and sell orders, allowing traders to see real-time shifts in market sentiment. Green bars indicate buy-side pressure, while red bars show sell-side dominance. By visualizing this in bar form, traders can easily spot significant shifts in order flow that could signal trend changes or momentum shifts.
2. Cumulative Delta Line (Rescaled): The cumulative delta is rescaled to plot under the price candles, giving traders a clear, contextualized view of how net buyer or seller dominance is developing over time. This line helps identify potential market reversals when price moves diverge from cumulative delta trends.
3. Order Flow Imbalance Detection: Imbalances in buy and sell volumes are automatically detected using a threshold, ensuring that traders are alerted to significant market moves. These imbalances provide insight into aggressive buying or selling behavior, which is crucial for identifying points of high trading activity or potential breakout/reversal zones.
4. VWAP Filter: Volume Weighted Average Price (VWAP) is included as a filter to confirm trend direction. The VWAP ensures that buy signals are only triggered when price action is above the VWAP (indicating strength), and sell signals are triggered when price is below the VWAP (indicating weakness). This ensures that signals are not just based on volume, but also on where price is relative to a critical benchmark.
5. RSI Filter: The inclusion of the Relative Strength Index (RSI) adds a momentum check to the signals. By using RSI, traders can avoid taking trades during low-momentum periods, ensuring they only act when market conditions favor a stronger move.
6. Signal Cooldown Feature: To avoid clutter and noise from frequent signals, this indicator includes a cooldown period between signals, ensuring that traders don’t receive excessive alerts in a short timeframe. This feature prevents overtrading and helps focus on high-quality signals.
Why This Combination is Useful:
• Comprehensive Market Insight: By combining delta volume analysis with order flow imbalance detection, this indicator provides a deep understanding of market sentiment, showing not only price movement but the underlying volume dynamics driving those moves.
• Signal Accuracy: The VWAP and RSI filters ensure that signals are only generated in strong market conditions, filtering out weak or false signals that often occur in choppy markets.
• Divergence Detection: The cumulative delta line provides traders with a tool for spotting divergences between price action and underlying volume, allowing for earlier detection of potential reversals.
This indicator is more than a simple combination of existing tools—it’s a strategic fusion of volume analysis, order flow, and momentum filters designed to provide traders with a clearer view of market activity and to generate more reliable buy/sell signals.
This description explains how the components work together and highlights the indicator’s usefulness, which should address TradingView’s concerns about originality and purpose.
BANKNIFTY

Options Series - Index Analysis [MasterPiece]
Powerful Insights 🚀:
This script utilizes multiple technical indicators to provide a comprehensive view of stock trends, which increases the reliability of trading signals.
This script also designed to perform index and stock analysis by comparing price movements to moving averages (MA20) and volume-weighted average price (VWAP).
By analyzing a set of top-weighted stocks within an index, the script offers a macro-level view while also delivering stock-specific insights. This dual focus enhances its utility for traders who need to understand both individual stock movements and broader market dynamics.
⭐ Originality: The script presents a unique fusion of multiple indicators with a data-driven approach to analyzing top-weighted stocks in major indices like Nifty and BankNifty. The integration of widely-used technical analysis tools, such as exponential and simple moving averages (EMA, SMA), volume-weighted average price (VWAP), and volume-body size comparisons, offers a holistic framework for traders. By focusing on the top five stocks in the indices, it leverages weightage-based performance analysis, adding a strategic dimension to index trading. This approach not only evaluates individual stock performance but also synthesizes broader market trends.
⭐ Usefulness: This script serves traders who seek a multi-dimensional method for analyzing both index and stock performance. Its key features include:
Bullish and Bearish Signals: The relationship between price, moving averages (MA20), and VWAP identifies directional trends, generating buy/sell signals for both individual stocks and the overall index.
Volume and Candle Body Analysis: By comparing candle body size with volume, the script provides deeper insights into trend strength and market conviction. This allows traders to gauge whether price movements are supported by sufficient trading volume.
Customization: Users have the flexibility to input specific index and stock symbols, making the script adaptable for different markets and instruments beyond just Nifty and BankNifty.
Signal Overlay: The ability to overlay bar color and volume signals directly on the price chart ensures better trend visualization, offering clear and immediate visual cues for potential trading setups.
⭐ Justification for Mashup: The combination of multiple indicators is logical and complementary. Each component serves a distinct purpose that enhances the overall system:
Trend Identification: Moving averages and VWAP provide insights into short and long-term trends, giving traders a reliable baseline for price direction.
Conviction: The inclusion of volume and candle body size comparisons gives additional weight to price action, allowing traders to confirm whether a trend is backed by meaningful market activity.
⭐ Color Customization for Enhanced Visualization:
The script defines custom colors for various conditions and candles, improving clarity for bullish and bearish trends.
Green for Bullish: Dark green for regular bullish candles, and fluorescent green for stronger bullish signals.
Red for Bearish: Dark red for regular bearish candles, and fluorescent red for stronger bearish signals.
Neutral Conditions: Fluorescent yellow is used for neutral conditions.
⭐ Index and Top Stocks Analysis:
This section analyzes top-weighted stocks for indices ( NSE:NIFTY and NSE:BANKNIFTY ), with NSE:BANKNIFTY being used as the default.
Top Stocks for NSE:NIFTY : HDFCBANK, ICICIBANK, RELIANCE, INFY, ITC.
Top Stocks for NSE:BANKNIFTY : HDFCBANK, ICICIBANK, KOTAKBANK, AXISBANK, SBIN.
Customizable Input: Users can modify the index and stock symbols via input.symbol.
⭐ Signal Generation Based on MA20 and VWAP:
The conditions for bullish or bearish signals are based on the relationship between the stock's close price, MA20, and VWAP.
Bullish Signal: Close price greater than both MA20 and VWAP.
Bearish Signal: Close price less than both MA20 and VWAP.
⭐ Volume Bar Signal for Market Activity:
The script analyzes candle body size and volume to detect significant market movements.
Body Size and Volume Comparison: It checks if the current candle’s body size or volume is greater than the moving average of body size or volume over the past 74 bars.
Green Candle (GC) and Red Candle (RC): Boolean conditions to track whether the close price is higher or lower than the open price.
⭐ Average Signals for Strong Trends:
The script calculates average bullish or bearish signals based on the majority of candles being green or red and significant body size or volume.
Bullish Average Signal: At least 4 out of 6 stocks exhibit bullish conditions (green candles, large bodies, or high volume).
Bearish Average Signal: Similar logic for bearish signals with red candles.
⭐ Overlay of Volume Bar Signals:
The plotshape function overlays the bullish and bearish volume bar signals on the chart, using color and shape to indicate trend changes.
🚀 Conclusion:
This Pine Script code provides a robust framework for index analysis based on top 5 weighted stocks, using two primary indicators—MA20 (20-period Moving Average) and VWAP (Volume Weighted Average Price).
Market Bias Identification: The script identifies bullish and bearish conditions for each stock based on whether the close price is above or below MA20 and VWAP.
Volume and Body Size Comparison: It checks if the current candle’s body size or volume exceeds the average to determine significant market moves.
Visualization with Color & Signals: It overlays color signals for bullish (fluorescent green) and bearish (fluorescent red) markets and provides triangle markers for strong volume-based signals.
Top Stock Analysis: The script provides analysis of top five weighted stocks in the selected index, enhancing precision for broader index analysis.

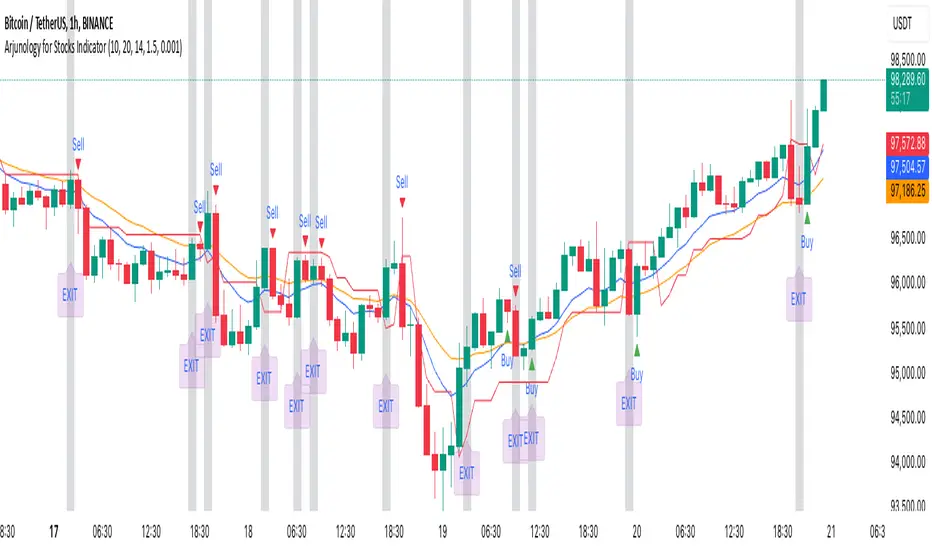
Arjunology for Stocks IndicatorArjunology for Stocks Indicator is a unique trend-following and exit management system that combines the power of Exponential Moving Averages (EMA) and Average True Range (ATR) to capture market trends and manage trade exits dynamically. It is designed to help traders identify potential buy and sell points based on market trends while incorporating volatility adjustments to avoid false signals and provide more reliable trade entries and exits.
Key Features:
1. Exponential Moving Averages (EMAs):
• Two EMAs (Short EMA and Long EMA) are used to determine trend direction and potential crossover signals.
• Short EMA reacts quickly to price changes, giving an indication of shorter-term trends.
• Long EMA provides a more stable measure of the overall trend direction, helping filter out market noise.
• Bullish Crossovers: When the short EMA crosses above the long EMA, it signals a potential uptrend (buy condition).
• Bearish Crossovers: When the short EMA crosses below the long EMA, it signals a potential downtrend (sell condition).
2. Average True Range (ATR):
• ATR is used to assess market volatility and avoid false signals during low volatility periods.
• A trailing stop loss mechanism based on ATR ensures that the indicator adapts to the current market environment, with higher volatility allowing for wider stops and lower volatility leading to tighter stops.
• A flat ATR threshold is used to avoid signals during quiet periods, where price movement may be too insignificant to trade effectively.
3. Buy and Sell Visual Cues:
• Green Triangle at the bottom of the candle when a bullish crossover (buy) condition is met.
• Red Triangle at the top of the candle when a bearish crossover (sell) condition is met.
• These visual cues help traders quickly identify trade entry points based on the trend signals.
4. Dynamic Exit Management:
• The indicator provides an Blue candle background to highlight exit points, with an “EXIT” label at the bottom of the candle in blue. This visual exit signal ensures clarity when a trade should be exited based on the trend reversal.
Justification for Combining EMAs and ATR in This Script:
The Exponential Moving Averages (EMAs) and Average True Range (ATR) serve complementary purposes in this script, enhancing each other’s functionality to provide a more complete trading system:
1. Trend Identification with EMAs:
• The combination of short and long EMAs is a widely trusted method for determining the trend direction. The crossovers between these EMAs provide clear entry signals for buy or sell trades. However, relying solely on EMAs can lead to false signals during periods of low volatility or market consolidation.
2. ATR for Volatility and Stop Loss:
• To prevent false signals during low-volatility conditions, the script uses ATR as a filter. This ensures that trades are only taken when the market has enough momentum, reducing the risk of being caught in “choppy” conditions where price action may be flat and untradeable.
• Additionally, the ATR-based trailing stop provides dynamic trade management, adjusting stop-loss levels according to the current volatility. This makes the system adaptive and prevents tight stops in volatile conditions or unnecessarily wide stops in calm markets.
3. Why They Work Together:
• The EMAs handle the trend direction, which is the foundation of the trading system, while the ATR adjusts the trade management to account for changing volatility. This means that the trader is always entering trades that are likely to follow a strong trend, while avoiding stagnant markets and using volatility-adaptive exit points.
• Without ATR, EMAs might generate signals during low-volatility periods that are unreliable. On the other hand, ATR alone wouldn’t provide a clear direction for trend-following. Together, these indicators create a balanced approach where trades are not only timely but also carefully managed.
How to Use:
• Buy Entry: Enter when the green triangle appears, indicating a bullish EMA crossover.
• Sell Entry: Enter short when the red triangle appears, indicating a bearish EMA crossover.
• Exit: Follow the orange background and blue “EXIT” label as a visual cue to exit the trade.
The combination of these tools allows traders to identify meaningful trend reversals while also managing risk dynamically, making the Arjunology for Stocks Indicator both versatile and effective for various market conditions.
Relative volume zone + Smart Order Flow Dynamic S/ROverview:
The Relative Volume Zone + Smart Order Flow with Dynamic S/R indicator is designed to help traders identify key trading opportunities by combining multiple technical components. This script integrates relative volume analysis, order flow detection, VWAP, RSI filtering, and dynamic support and resistance levels to offer a comprehensive view of the market conditions. It is particularly effective on shorter timeframes (M5, M15), making it suitable for scalping and day trading strategies.
Key Components:
1. Relative Volume Zones:
• The script calculates the relative volume by comparing the current volume with the average volume over a defined lookback period (volLookback). When the relative volume exceeds a specified multiplier (volMultiplier), it indicates a high volume zone, signaling potential accumulation or distribution areas.
• Purpose: Identifies high-volume trading zones that may act as significant support or resistance, indicating possible entry or exit points.
2. Smart Order Flow Analysis:
• The indicator uses Volume Delta (the difference between buying and selling volume) and a Cumulative Delta to detect order imbalances in the market.
• Order Imbalance is identified using a moving average of the Volume Delta (orderImbalance), which helps highlight hidden buying or selling pressure.
• Purpose: Reveals market sentiment by showing whether buyers or sellers dominate the market, aiding in the identification of trend reversals or continuations.
3. VWAP (Volume Weighted Average Price):
• VWAP is calculated over a default daily length (vwapLength) to show the average price a security has traded at throughout the day, based on both volume and price.
• Purpose: Provides insight into the fair value of the asset, indicating whether the market is in an accumulation or distribution phase.
4. RSI (Relative Strength Index) Filter:
• RSI is used to filter buy and sell signals, preventing trades in overbought or oversold conditions. It is calculated using a specified period (rsiPeriod).
• Purpose: Reduces false signals and improves trade accuracy by only allowing trades when RSI conditions align with volume and order flow signals.
5. Dynamic Support and Resistance Levels:
• The script dynamically plots support and resistance levels based on recent swing highs and lows (swingLookback).
• Purpose: Identifies potential reversal zones where price action may change direction, allowing for more precise entry and exit points.
How It Works:
• Buy Signal:
A buy signal is generated when:
• The price enters a high-volume zone.
• The price crosses above a 5-period moving average.
• The cumulative delta shows more buying pressure (cumulativeDelta > SMA of cumulativeDelta).
• The RSI is below 70 (not in overbought conditions).
• Sell Signal:
A sell signal is generated when:
• The price enters a high-volume zone.
• The price crosses below a 5-period moving average.
• The cumulative delta shows more selling pressure (cumulativeDelta < SMA of cumulativeDelta).
• The RSI is above 30 (not in oversold conditions).
• Dynamic Support and Resistance Lines:
Drawn based on recent swing highs and lows, these lines provide context for potential price reversals or breakouts.
• VWAP and Order Imbalance Lines:
Plotted to show the average traded price and highlight order flow shifts, helping to validate buy/sell signals.
How to Use:
1. Apply the Indicator:
Add the script to your chart and adjust the settings to match your trading style and preferred timeframe (optimized for M5/M15).
2. Interpret the Signals:
Use the buy and sell signals in conjunction with dynamic support/resistance, VWAP, and order imbalance lines to identify high-probability trade setups.
3. Monitor Alerts:
Set alerts for significant order flow events to receive notifications when there is a positive or negative order imbalance, indicating potential market shifts.
What Makes It Unique:
This script is unique because it combines multiple market analysis tools — relative volume zones, smart order flow, VWAP, RSI filtering, and dynamic support/resistance — to provide a well-rounded, multi-dimensional view of the market. This integration allows traders to make more informed decisions by validating signals across various indicators, enhancing overall trading accuracy and effectiveness.

ATR+Order Block IndicatorThe ATR+Order Block Indicator is a unique and comprehensive tool designed to combine volatility-based analysis with key price action levels to provide traders with reliable entry and exit points. This indicator merges the Average True Range (ATR) for dynamic trailing stop calculation with order block detection to identify significant support and resistance zones on the chart. This combination offers traders a powerful blend of trend-following and price level analysis for improved trading decisions.
How the Components Work Together:
1. ATR-Based Trailing Stop:
• The Average True Range (ATR) is a widely used volatility indicator that measures the degree of price movement over a specified period. In this indicator, the ATR is used to create a trailing stop that dynamically adjusts to market conditions.
• How It Works: The ATR value is multiplied by a user-defined multiplier (ATR Multiplier) to set the distance of the trailing stop from the current price. This trailing stop moves with the price:
• If the price moves upwards, the trailing stop adjusts higher, ensuring it only moves in the direction of the trade.
• If the price moves downwards, the trailing stop adjusts lower accordingly.
• Purpose: This trailing stop helps traders manage risk by automatically adjusting to market volatility, ensuring that stops are not too tight in volatile conditions or too wide in quieter markets. It also helps lock in profits while maintaining a position in the market’s direction.
2. Order Block Detection:
• Order blocks are areas on the chart where significant buying (accumulation) or selling (distribution) has occurred. These zones often act as potential support or resistance levels due to the presence of unfilled buy or sell orders by large institutions or traders.
• How It Works: The indicator identifies the highest high (seller order block) and the lowest low (buyer order block) within a user-defined lookback period. These are plotted on the chart:
• Buyer Order Block: Represents a potential support area where buying interest is likely to reappear.
• Seller Order Block: Represents a potential resistance area where selling interest may reemerge.
• Purpose: By identifying these order blocks, traders can anticipate potential price reversals or continuations, aligning their trades with key market levels where significant buying or selling has occurred.
Justification for Combining These Components:
1. Enhanced Signal Accuracy and Context:
• The combination of ATR-based trailing stops with order block detection provides a dual-layered approach to trade decisions:
• ATR Trailing Stop offers trend-following signals based on volatility, helping traders capture market momentum.
• Order Blocks provide context to these signals by highlighting critical price levels where market participants have previously shown strong interest.
• This fusion allows traders to filter signals more effectively, ensuring trades are aligned with both market trends and key support/resistance zones.
2. Dynamic Risk Management:
• Using the ATR to set a dynamic trailing stop ensures that the stop-loss level adapts to the changing volatility of the market. When combined with order block detection, traders gain an additional layer of risk management:
• Stop Loss Placement: Traders can place stops just outside identified order blocks to protect against sudden price reversals while maintaining a tight stop aligned with current market volatility.
3. Reducing Market Noise and Avoiding False Signals:
• The indicator includes a mechanism to avoid repetitive signals, requiring a minimum gap between signals. This reduces noise and helps traders avoid multiple false entries in choppy market conditions.
• Order Blocks provide additional validation: For example, a buy signal generated near a Buyer Order Block carries more weight, as it aligns both with the ATR-based momentum and a key support area.
4. Improving Entry and Exit Strategies:
• Entry Points: The indicator generates buy (long) signals when the price crosses above the ATR trailing stop and sell (short) signals when it crosses below. These signals are enhanced by considering their proximity to order blocks, ensuring trades are initiated at strategic price levels.
• Exit Points: The ATR trailing stop provides a dynamic exit strategy, allowing trades to run while adjusting to market volatility. Traders can also use order blocks as targets or potential reversal points to exit trades.
5. Providing a Comprehensive Trading Tool:
• This indicator is unique in its integration of volatility and price level analysis, offering a well-rounded approach to trading. It combines the best of both worlds: trend-following momentum with the ATR and price action sensitivity through order blocks, making it suitable for different market conditions and trading styles.
How to Use the Indicator:
• Set the Parameters:
• Choose an ATR Period (default is 10) to define the number of bars for ATR calculation.
• Set the ATR Multiplier (default is 1.5) to adjust the sensitivity of the trailing stop.
• Define the Order Block Lookback Period (default is 20) to determine how many bars back the script will search for order blocks. Recommended 50.
• Interpret the Signals:
• BUY Signal: When the price crosses above the ATR trailing stop, indicating upward momentum. Confirm this signal by checking if it is near a Buyer Order Block.
• SELL Signal: When the price crosses below the ATR trailing stop, indicating downward momentum. Look for proximity to a Seller Order Block for added confidence.
• Monitor and Manage Trades:
• Use the ATR trailing stop for dynamic stop-loss placement.
• Watch for price action around the order blocks to make informed decisions about taking profits or cutting losses.
Conclusion:
The ATR+Order Block Indicator combines volatility and price action analysis in a unique way that offers traders a comprehensive tool for making informed trading decisions. By leveraging the strengths of both ATR-based dynamic stops and order block detection, it provides a balanced approach to trend-following and support/resistance trading, enhancing overall trading effectiveness and confidence.

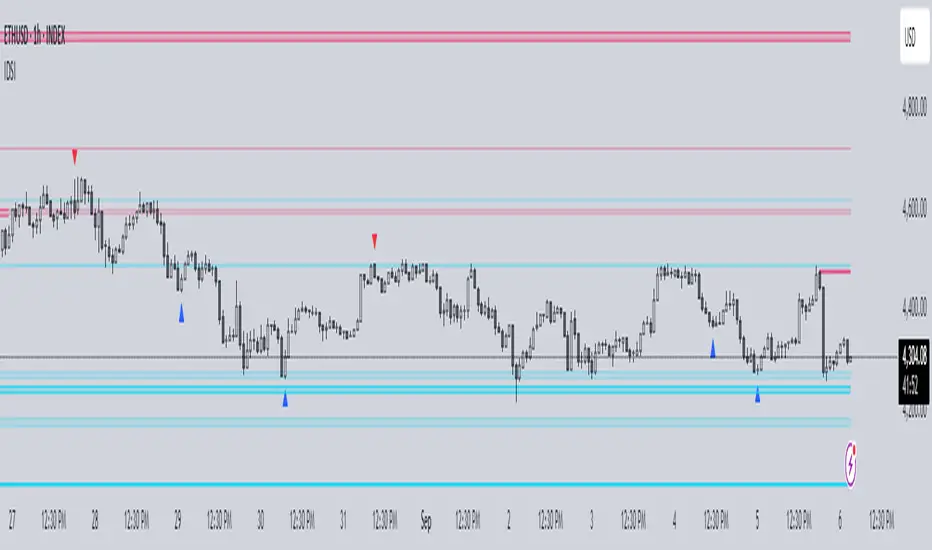
Institutional Demand Supply IndicatorINTRODUCTION
Institutional demand and supply zones are key areas on a price chart where large institutional traders, such as banks and hedge funds, place significant buy or sell orders. These zones often act as strong support or resistance levels due to the substantial volume of trades executed by institutions.
There are various ways to identify these areas of interest on the charts, but the main goal is to study the price movements, especially significant ones. Large financial entities tend to operate in the same price areas repeatedly. Instead of chasing price movements and risking counter moves, it's better to wait for the price to return to these areas, expecting that these entities will buy or sell there again.
INDICATOR SETTINGS:
1. High Probability Zones (HPZ) - High Probability Zones (HPZ) are demand and supply zones identified using advanced calculations to highlight the most relevant and significant areas. These zones have a higher probability of impacting price movements. Better to keep it turned On.
2. Zone Extension? - Extending zones can be useful for identifying areas that have already been retraced as these zones may continue to influence market dynamics despite the retracement.
3. Zone Type - This option lets you select the zone layout type. 4 options are given which are self explanatory.
4. Directional Candle Count - This option keeps a count of number of consecutive bullish / bearish candle that you would like to set as qualifying parameter for demand / supply zone. For Example - If you keep the number 1, the script will draw a demand or supply zone by just checking if 1 candle has met all the criteria's and calculations.
5. Zone Validity Percentage - You can set the percent change for the number of candles mentioned in point 4 above.
6. HPZ - Keep the number between 6 to 10. As you move the number up, less number of zones will be displayed.
7. Zone Count - You can adjust the number of visible demand and supply zones on the chart. Increase this number if you want to display more zones, or decrease it if the chart becomes too cluttered.
D I S P L A Y
1. Background Color Demand / Supply Zone - This is the background color of demand and supply zone.
2. Channel Color Demand / Supply Zone - This is the color of channel.
3. Channel Line Style - Choose between Solid, dotted or dashed.
4. Background Color Transparency - Choose the transparency of background color
5. Channel Line Width - Choose Channel line width between 1 to 4.
6. Channel Line Transparency - Choose Channel Line Transparency and keep it between 1 to 100.
Sometimes, a level may be breached on one timeframe, but that doesn’t mean the indicator is not working. To understand the price action better, switch to a different timeframe to check why that level was breached and why it found support at a different zone on another timeframe. Look at the 2 screenshots below.
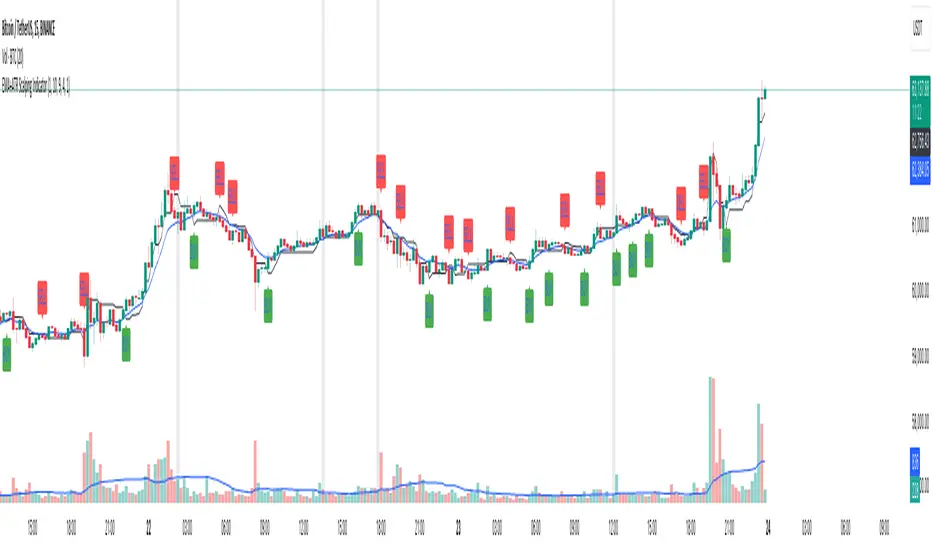
EMA+ATR Scalping Indicator by TradeTechIndicator Description: “EMA+ATR Scalping Indicator by Tradetech”
The “EMA+ATR Scalping Indicator” is a powerful tool designed to help traders identify optimal entry and exit points in the market, focusing on high-probability scalping opportunities. This indicator combines the strength of the Exponential Moving Average (EMA) with the Average True Range (ATR) to generate precise signals, aiming to maximize profits while minimizing risk.
Key Features:
• Sensitivity Key Value: Allows customization of the ATR multiplier, fine-tuning the trailing stop level for different market conditions.
• ATR Calculation: Measures market volatility over a specified period, dynamically adjusting the trailing stop to capture significant price moves while reducing noise.
• EMA for Confirmation: The 20-period EMA is used as a trend filter, ensuring that trades are aligned with the prevailing market direction.
• Trade Cooldown Period: Prevents over-trading by enforcing a minimum number of bars between consecutive trades, reducing the likelihood of whipsaws.
• Flat ATR Threshold: Identifies periods of low volatility (flat ATR), during which trading is avoided to protect against false signals.
Trading Logic:
• Entry Signals: The indicator generates long signals when the price crosses above the ATR trailing stop or breaks out consecutively in an uptrend, with the EMA confirming the bullish trend. Short signals are generated when the price crosses below the ATR trailing stop or consecutively breaks out in a downtrend, with the EMA confirming the bearish trend.
• Exit Signals: The exit points are defined by the ATR trailing stop, which adjusts dynamically with market conditions, ensuring that profits are locked in as the trend evolves.
• No Trading Zone: When the ATR is flat, indicating low volatility, the indicator displays a “No Trading Zone” to prevent taking positions in uncertain market conditions.
Why Combine EMA + ATR?
The combination of EMA and ATR in this indicator is crucial for several reasons:
1. Trend Identification (EMA): The EMA acts as a reliable trend filter, ensuring that trades are taken in the direction of the prevailing trend. By doing so, the indicator avoids taking trades against the momentum, which could result in lower probability setups.
2. Volatility-Based Trailing Stop (ATR): The ATR provides a volatility-adjusted stop-loss level, which is essential in scalping strategies where market conditions can change rapidly. This allows the trailing stop to widen during periods of high volatility and tighten during low volatility, optimizing the trade management process.
3. Enhanced Accuracy: By combining the EMA and ATR, the indicator filters out noise and avoids entering trades during flat market conditions, where the probability of false signals is higher. This synergy between trend and volatility creates a more robust and accurate scalping tool.
4. Dynamic Trade Management: The use of ATR for setting trailing stops ensures that the trade exits are dynamic and adaptable to current market conditions, maximizing the potential for capturing significant moves while minimizing drawdowns.
Overall, the EMA + ATR combination within the “EMA+ATR Scalping Indicator” provides a well-rounded approach to scalping, balancing trend-following with volatility management for more consistent trading results.
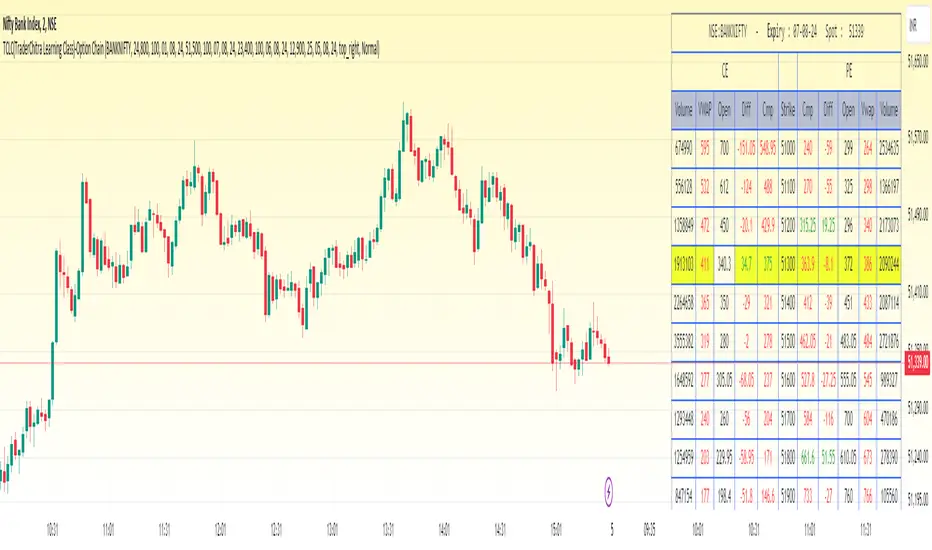
TCLC(TraderChitra Learning Class)-Option ChainThis indicator plots the Option chain data of the following instruments and columns..
It plots 11 rows ,
5 Rows above the input strike price
1 Row for the input strike price
5 Rows below the input strike price
Instruments :
1. NIFTY
2. BANKNIFTY
3. FINNIFTY
4. MIDCPNifty
Columns :
1. StrikePrice
2.CMP
3.Volume
4.VWAP
5.Diff (Open-Close)
Traders need to change the expiry date to check the premium of the corresponding instruments...
There are few key things,
1. Rows in yellow are marked as ATM strike price
2. Cell values in red / green indicates the prices are trading above / below the VWAP
The prices are expected to be bullish when cmp trades above VWAP and we can gauge the trend
The column Volume provides the details in which strike price more traders are actively traded..
The far month contracts can also be changed in the settings and it helps the swing/positional traders
The Strike price can be modified to check the appropriate strikes
Inside Bar Setup [as]Inside Bar Setup Indicator Description
The **Inside Bar Setup ** indicator is a powerful tool for traders to identify and visualize inside bar patterns on their charts. An inside bar pattern occurs when the current candle's high is lower than the previous candle's high, and the current candle's low is higher than the previous candle's low. This pattern can indicate a potential breakout or a continuation of the existing trend.
Key Features:
1. **Highlight Inside Bar Patterns:**
- The indicator highlights inside bar patterns with distinct colors for bullish and bearish bars. Bullish inside bars are colored with the user-defined bull bar color (default lime), and bearish inside bars are colored with the user-defined bear bar color (default maroon).
2. **Marking Mother Candle High and Low:**
- The high and low of the mother candle (the candle preceding the inside bar) are marked with horizontal lines. The high is marked with a green line, and the low is marked with a red line.
- These levels are labeled as "Range High" and "Range Low" respectively, with the labels displayed a few bars to the right for clarity. The labels have a semi-transparent background for better visibility.
3. **Target Levels:**
- The indicator calculates and plots potential target levels (T1 and T2) for both long and short positions based on user-defined multipliers of the mother candle's range.
- For long positions, T1 and T2 are plotted above the mother candle's high.
- For short positions, T1 and T2 are plotted below the mother candle's low.
- These target levels are optional and can be toggled on or off via the input settings.
4. **Customizable Inputs:**
- **Colors:**
- Bull Bar Color: Customize the color for bullish inside bars.
- Bear Bar Color: Customize the color for bearish inside bars.
- **Long Targets:**
- Show Long T1: Toggle the display of the first long target.
- Show Long T2: Toggle the display of the second long target.
- Long T1: Multiplier for the first long target above the mother candle's high.
- Long T2: Multiplier for the second long target above the mother candle's high.
- **Short Targets:**
- Show Short T1: Toggle the display of the first short target.
- Show Short T2: Toggle the display of the second short target.
- Short T1: Multiplier for the first short target below the mother candle's low.
- Short T2: Multiplier for the second short target below the mother candle's low.
5. **New Day Detection:**
- The indicator detects the start of a new day and clears the inside bar arrays, ensuring that the pattern detection is always current.
#### Usage:
- Add the indicator to your TradingView chart.
- Customize the inputs to match your trading strategy.
- Watch for highlighted inside bars to identify potential breakout opportunities.
- Use the marked range highs and lows, along with the calculated target levels, to plan your trades.
This indicator is ideal for traders looking to capitalize on inside bar patterns and their potential breakouts. It provides clear visual cues and customizable settings to enhance your trading decisions.
Note:
This indicator is based on famous 15 min inside bar strategy shared by Subashish Pani on his youtube channel Power of stocks. Please watch his videos to use this indicator for best results.

NSE Option Chain
This Indicator show Options Data on signal dashboard , that help trader to analyse the market.
Options data consist of two things , Call and Put.
Every Strike has its Call and Put price.
So if user Opens any chart which is traded in options , dashboard will show total 16 Call and 16 Put strikes
8 Above from ATM and 8 Below from ATM.
On left hand side of dashboard there is Call data and on right side there is Put data.
Call side datas are , Call LTP which is latest price of that call strike , Call Chg which is change in points from previous day close and third is Call % which is % change from previous day close.
Same is on put side.
Color code is done based on positive or negative of data. If change or % is negative then color is red else green.
ATM strike data is plotted in bold
Inputs :
Spot Symbol Input for Option dashboard
Expiry date of that option contract
Strike interval between 2 strikes
Reference ATM strike ( user should keep this input as current ATM strike )
How to Use :
If dashboard shows call side is negative and put side is positive then that means market Bearish , because falling market leads to falling price of call and increase in price of Put.
Similarly if put is negative and call is positive then market is bullish.
This dashboard give trend conformation , trader should take other conformation also before taking trade.

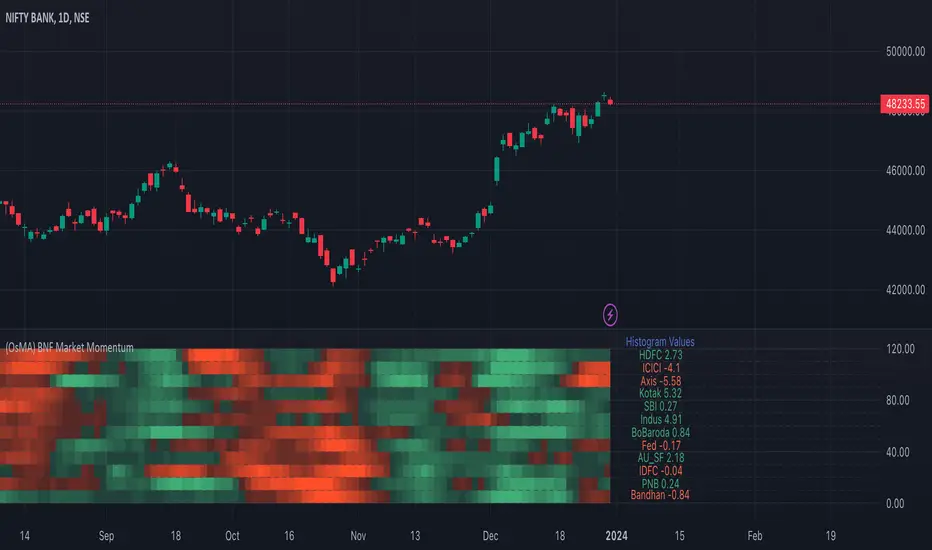
Bank Nifty Market Breadth (OsMA)This indicator is the market breadth for Bank Nifty (NSE:BANKNIFTY) index calculated on the histogram values of MACD indicator. Each row in this indicator is a representation of the histogram values of the individual stock that make up Bank Nifty. Components are listed in order of its weightage to Bank nifty index (Highest -> Lowest).
When you see Bank Nifty is on an uptrend on daily timeframe for the past 10 days, you can see what underlying stocks support that uptrend. The brighter the plot colour, the higher the momentum and vice versa. Looking at the individual rows that make up Bank Nifty, you can have an understanding if there is still enough momentum in the underlying stocks to go higher or are there many red plots showing up indicating a possible pullback or trend reversal.
The plot colours are shown as a percentage of the current histogram value taken from MACD from the highest histogram value of the previous 200 bars shown on the current timeframe. Look back value of 200 bars was chosen as it provided a better representation of the current value from its peak over the recent past(previous 200 bars), on all timeframes. Histogram value do grow/fall along with the underlying stock price, so choosing the chart's all-time high/low value as peak was not ideal. Labels on the right show the current histogram value.
Base Code taken from @fengyu05's S&P 500 Market Breadth indicator.
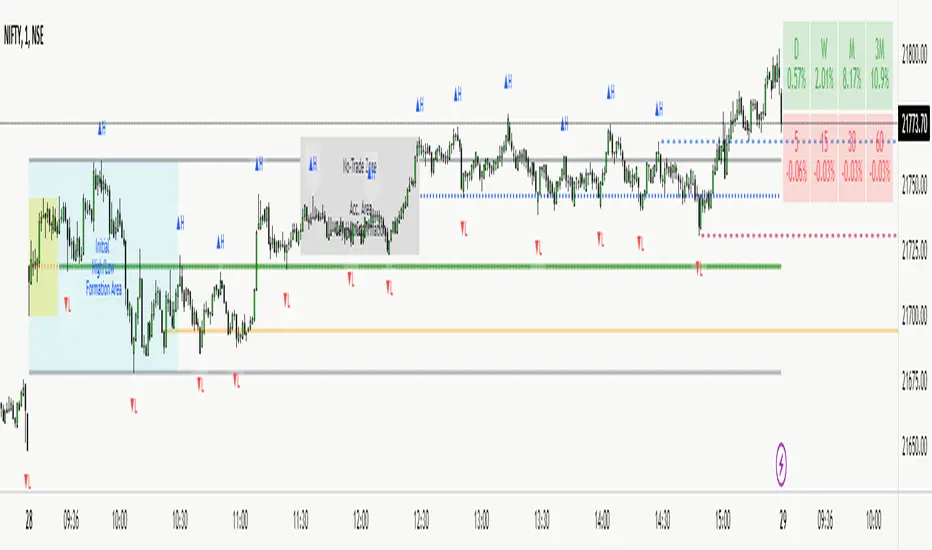
NITS - NIFTY INTRADAY TRADING SYSTEMNSE:NIFTY
Hello Traders..!
This is another indicator / system to make use for NIFTY & BANK NIFTY Intra day trading.
This is my Gift to the traders for this New Year 2024. Use this to your Edge and make some profits. All explained below.
NIFTY INTRA-DAY TRADING SYSTEM
Explanation of Arrays:
-------------------------------
## FIRST 15 MIN SESSION BOX ##
From 09:15 to 09:30 where the initial orders will get collected and Auction takes place.
DO NOT engage into any trade in this session. Let the Box develop.
## INITIAL HIGH / LOW FORMATION SESSION ##
This session is from 09:15 to 10:30.
We can observe the Initial High or Low being formed for the day, that is VALID TILL 11:30.
## NO-TRADE ZONE / ACC. AREA / DAY’S H OR L CONFIRMATION SESSION ##
From 11:30 to 12:30
90% of time this is the session where the whole Day’s High or Low will get confirmed. Sometimes the market may violate this Session!
DO NOT engage into any fresh trade in this area.
Once the box is developed, you can see the Mid price line will be formed which is valid for the afternoon Trading session till 15:30.
## SIGNAL LINE, MIDDLE PRICE LINE, SESSION HIGH LOW LINES ##
Middle Price Line – the dotted line (Red colour) is Mid Price Line for the Initial session box. This acts as an important price level for the whole day.
Signal Line – the Solid line that will form after 10:30. Consider this price line as very important price line to which the price reacts with a good momentum, either break through or rejection and valid for the whole trading day.
Session High Low price line – high and low prices of the Initial session box which acts as a good Support / Resistance / Target / Stop loss. Even previous session’s price lines can also be used for the current day too.
## TREND BOX ##
Multi-Time frame trend box will show the real-time trend on different time frames. This box will be very helpful in trade decision. Please note that at least THREE HIGHER TIME FRAME TRENDS must be in the same direction to support your trade criteria for the better confirmation.
## VOLUME IMBALANCE ##
These orange coloured boxes are very tiny imbalances between prices that were formed during price movements. Algorithm will try to fill these imbalances on its way of filling orders. These price imbalances can be used for our edge while taking trades.
SOME TIPS:
---------------------------
1) Avoid Break out trades
2) Always trade the pull backs
3) Keep your Stops above / below the KEY LEVELS
4) Always follow the Higher Time frame trend while taking a trade.
If you trade in 1m TF consider 5m trend
If you trade in 5m TF consider 1H or 15m trend
5) Consider the higher TF closure of prices only, to validate the break out.
6) Trade what you see, market can do anything it wants.
7) Do not worry about losses. It happens and that is the business.
8) End your trading week in green no matter how big or small the profit is. Consistency is the key this business.
9) Keep in mind that the Market does two things only, either it will FILL THE GAP or GRAB THE LIQUIDITY. Just plan your trades accordingly. Liquidity levels like Previous Session / Day / Week / highs and lows.
10) The Market is a continuous business. It does not end for the specific day. It will not end its Buy or Sell model unless it completes its cycle, hence TRADE WHAT YOU SEE and not WHAT YOU THINK!
11) Unless the key swing high / low is broken and closed, DO NOT consider that move as a reversal. Consider that as a Liquidity grab. And it will continue in its previous trend.
HOW TO TAKE TRADE USING NITS: (one of the Techniques)
--------------------------------------------------------------------------------
As explained above, Do not engage in trade for the first 15 minutes.
Once the 15m box forms then look for divergence between NIFTY and BANK NIFTY.
Both Indices are supposed to trade in the same direction but at key levels and times, these instruments will make DIVERGENCE with its Highs and Lows.
Ex: one Index will make LOW AND LOWER LOW and at the same time other will make LOW AND HIGHER LOW. This deflection can be used for taking Buy Trades.
Ex:
If the Divergence forms at the Bottom then the market will move upwards.
If the Divergence forms at the Top then the market makes down move.
To confirm this divergence, the price will move away from that deflected Lows or Highs.
-----------------------------------
POINTS TO OBSERVE
------------------------------------
Mostly the first 15 min range that forms will either be very large candles or normal candles with rejection wicks or Shaved bar (open and H/L same)
Whenever you observe a very large wide range bars within the 15min range, consider the Day’s high and Low is already formed. And the market will be hovering inside that range only. Very useful for taking 50 points scalping here and there by using the signal line and middle line or Acc box mid line. In this scenario you have three important info of the day, OPEN HIGH & LOW established already, The market will only look for its close.
Ex:
If the market trades with normal candles, then consider your trades in two parts.
From 09:30 to 11:30 and from 12:30 to 15:30 as 11:30 to 12:30 will confirm the current day’s High / Low hence do not take a fresh position within that time.
1) Initial session trade – If the price does not break and close the 15 min range high/low, consider it is going to reverse and continue its trend till 10:30
Ex:
2) Mid session Trade – mostly the market accumulates positions and collects orders between 11:30 to 12:30 for the afternoon session. Once the session box is developed, the middle price line will form. Wait for the market breakout and close off this session’s high or low in Higher TF. The market will continue in the direction of breakout from this session and continue till 15:30. Hence wait for pull back till its mid price / high or low price lines of this Acc box and take trade in the initial breakout direction keeping stop above or below the session’s high or low.
Ex:
## Fixed Range Volume Profile as a Tool ##
-----------------
Note:
-----------------
Kindly do not ask for any codes or script details. The one technique what I explained (Divergence method) is more than enough for making a consistent earnings. Please study and back test / forward test for yourself for atleast 2 weeks time. Every traders aspect and mindset is different in seeing the market movements. Please design your own methodology and CONSIDER this as a BUSINESS..!
JUST.....
Believe the System
Be patient
Be Disciplined &
Be a Successful Earner..!!
LET YOUR ENDS MEET
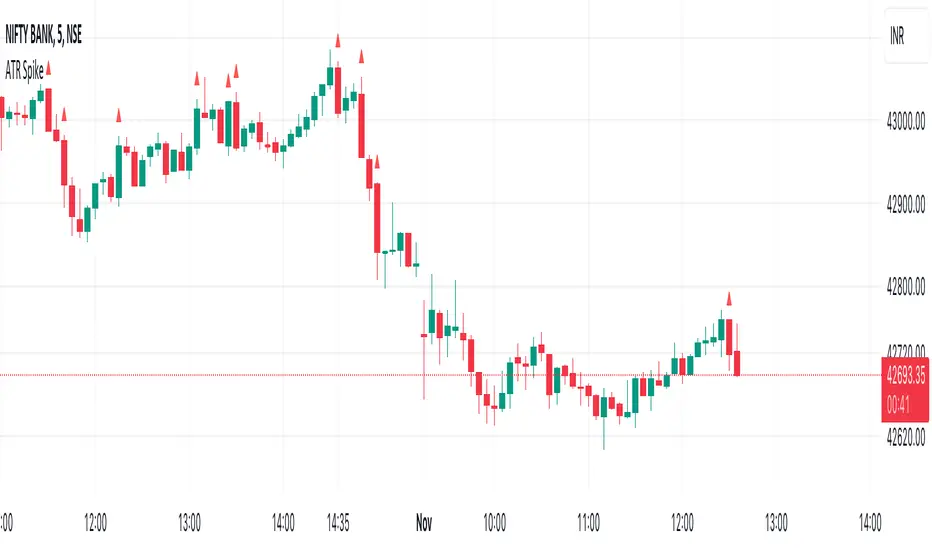
(Hope I explained well)
ATR SpikeALWAYS TRADE THE DIRECTION OF THE TREND
This indicator is useful for 5-minute Bank Nifty intraday trading.
It compares the Open-Close value for a 5-minute bar with the current ATR value.
When a bar has higher than the ATR value then it means that the current bar has a higher Open-Close than the ATR.
This means that after a period of dull action, some action has taken place.
And more action will follow in the direction of the immediate trend.
It signals the start of momentum which I look for as a intraday trader.
Feel free to experiment and change values as it suits you.
I use it on Bank Nifty only on 5 minute timeframe with 14 period ATR.
TEWY - Magic Momentum IndicatorMy goal is to equip every trader and investor with the essential tools necessary to confidently navigate the complexities of the financial markets, enabling them to consistently identify opportunities and maintain a position of strength on the winning side of their trades. This indicator stands as a potent tool, offering the capability to effectively assess longer-term momentum trends.
Allow me to provide some context regarding the genesis of this indicator. By keenly observing the pattern of momentum loss preceding each trend reversal, coupled with the notable decrease in the rate of price change, I've formulated this indicator. This design is rooted in the understanding that these dynamics hold key insights into the market's shifting trends.
So, I've developed this indicator with the purpose of granting you the ability to select and construct optional combinations of up to two comparable symbols. Through this, you gain a comprehensive and insightful perspective on the ever-evolving dynamics of the market.
This indicator acts like an oscillator and momentum line serves as a key determinant. When the line is positioned above 0, it signifies a positive momentum; conversely, if it rests below 0, it indicates a sideways to negative trend. This mechanism offers a clear and intuitive means of gauging prevailing market conditions.
Should you have any inquiries or require further clarification regarding this indicator, please do not hesitate to reach out to me via direct message. I am here to provide you with the necessary guidance and support to ensure your experience with this tool is both seamless and enriching. Your understanding and satisfaction remain my utmost priority.
By TEWY - Trade Easy With Yogesh
I am Yogesh

TEWY - Magic Strength Indicator V2My goal is to equip every trader and investor with the essential tools necessary to confidently navigate the complexities of the financial markets, enabling them to consistently identify opportunities and maintain a position of strength on the winning side of their trades. This indicator stands as an immensely powerful tool, delivering a comprehensive and robust approach to market analysis and decision-making.
Allow me to provide some context regarding the genesis of this indicator. The global financial landscape encompasses a multitude of markets, ranging from the money market to the stock market, cryptocurrencies, commodities, and beyond. Often, these markets display proportional or inverse correlations, unveiling the intricate interplay between them. At the heart of this concept lies a meticulous comparison between a selected ticker and other analogous markets. This analytical approach serves as a pathway to unearthing invaluable insights and intricate patterns across interconnected sectors.
So, I created this indicator, to empower you with the capability to select and construct combinations of up to seven comparable markets and offer a comprehensive perspective on market dynamics.
Let me to elucidate the intricacies of this indicator and delve into its versatile configurations. By understanding its components and tailoring its settings, traders can harness its full potential to make informed and strategic trading decisions.
Related to indicator configuration sections
Section 1. 'PRIMARY AND SECONDARY INDEX' and Section 2. 'GLOBAL REFERENCE INDEX'
To utilize this indicator, begin by configuring at least one comparison indicator in the "Primary Index" field. Additional options include the secondary index (which can function as a sector index) and five global indices. Furthermore, you have the flexibility to adjust their timeframes, allowing for comparisons across various time horizons.
Section 3. ADVANCED FEATURS
Consider a scenario where you've pulled up a chart for "NSE:BANKNIFTY" and desire to assess the relative strength of "NSE:NIFTY" in comparison to global indices. To accomplish this, explore the Advanced Feature section and toggle the "Use Different Base Ticker" option to "Yes." Subsequently, input "NSE:NIFTY" as the symbol/ticker in the designated box. This ingenious feature empowers you to evaluate the strength of "NSE:NIFTY" the backdrop of the "NSE:BANKNIFTY" chart. The result? A remarkably potent analytical capability at your fingertips! The possibilities it offers are indeed remarkable!
Section 4. LINE AND BARCOLOR RELATED
I have dedicated considerable effort to scrutinize historical patterns within the strength indicator of various symbols. Through meticulous analysis, I've identified pivotal conditions that often herald shifts in market or symbol trends. Leveraging this insight, I've devised a system to determine optimal strength line colors and bar colors. This strategic approach adds a layer of precision to the indicator, enhancing its effectiveness in recognizing and visualizing trend changes.
Recognizing the prevailing tendency of global markets to exhibit more upward momentum than downward movement, I've taken into account this inherent "Long Bias." With this understanding in mind, I've incorporated a unique feature that aims to prompt an early transition from red to green bar colors when there's a potential indication of a trend reversal from a downtrend. By proactively signaling the shift in color dynamics, this feature aligns with the overall upward-leaning nature of the markets, enabling traders/investors to respond swiftly to potential changes in trend direction.
By employing the 'Use Simple Method of Calculation,' the determination of strength line color is executed through a straightforward crossover technique. This approach proves particularly effective in scenarios where inverse correlations exist between the symbols or tickers being compared. Additionally, an 'Inverse Scale' option is available, wherein a simple multiplication by -1 is applied to all values. This ingenious feature offers a convenient perspective on symbols or tickers that exhibit inverse correlations, further enhancing the indicator's adaptability to a wide array of market dynamics.
**** It's important to note that the 'Change Bar Color' option is intentionally set to the default selection of 'No.' By design, only when you opt to set it to 'Yes' do custom bar colors come into play on the chart. This thoughtful design choice acknowledges the potential need to preserve bar colors when seeking to discern inverse correlations between symbols. Should you require a modification in bar colors, kindly select 'Yes' to initiate this change and access the custom color functionality.
Section 5. LABELS
Moreover, to facilitate ease of use and organization, I've included a practical feature for instances where you deploy this indicator multiple times on a single chart. Within this context, should you wish to assign quick tags to each instance, a dedicated free-text box is at your disposal. This allows you to conveniently label and categorize different instances of the indicator, ensuring a streamlined and efficient approach to managing your chart analyses.
I encourage you all to embark on a rewarding journey in your trading and investing endeavors. With this indicator as your ally, equipped with its potent analytical capabilities, may your path be marked by well-informed decisions and prosperous outcomes. Wishing you every success in your trading and investment journey!
Should you have any inquiries or require further clarification regarding this indicator, please do not hesitate to reach out to me via direct message. I am here to provide you with the necessary guidance and support to ensure your experience with this tool is both seamless and enriching. Your understanding and satisfaction remain my utmost priority.
By TEWY - Trade Easy With Yogesh
I am Yogesh

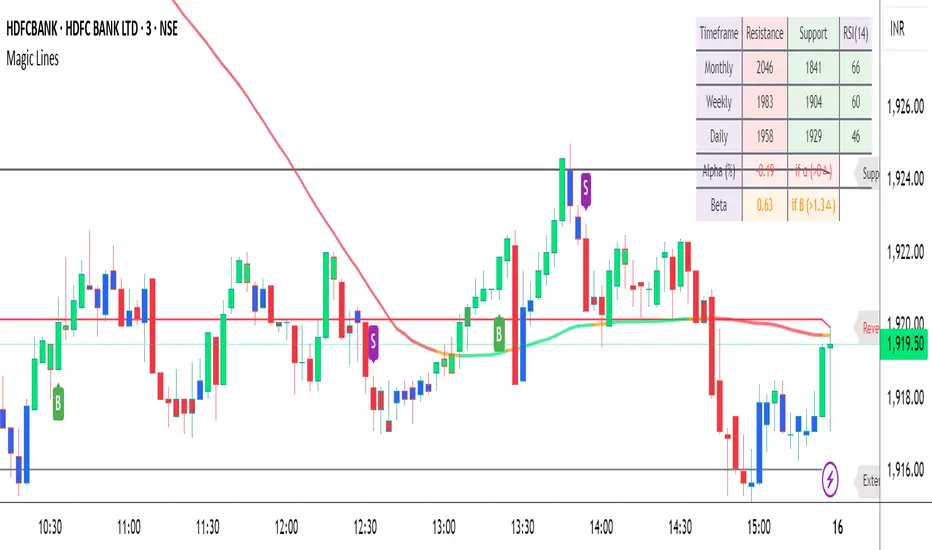
Magic LevelsPS MODS : This indicator calculate the levels based on IndiaVIX, volumes on FnO, cofficient and factor to reach on the level. Hope this can help you to understand the functionality of this Indicator
This indicator is used for draw levels or "Magic Levels/Lines" for Nifty, Bank Nifty and FnO futures, based on volatility (indiavix) calculations. This powerful tool is designed to provide insights into market volatility and assist traders and investors in making informed decisions in the Indian stock market.
As of now the indicator draws levels only on Bank Nifty and Nifty. Soon we'll publish the next update supporting all FnO Futures and stocks.
The India VIX, often referred to as the "Fear Index," is a popular measure of market volatility and investor sentiment. It quantifies the market's expectations of near-term volatility by calculating the implied volatility of NIFTY options. The VIX Levels Indicator utilizes these calculations to draw key levels on price charts, enhancing traders' understanding of potential market movements.
The indicator's main function is to identify critical support and resistance levels derived from IndiaVIX data. We considered to volatility of all the FnO instruments and calculated the mean value keeping the day into consideration while performing the calculations. These levels serve as significant reference points that can help traders gauge potential price reversals, breakouts, and trends. By integrating the Magic Levels Indicator into their analysis, traders can gain a comprehensive view of market dynamics and improve their timing for entering or exiting positions.
Traders can customize the VIX Levels Indicator to suit their preferences, adjusting parameters such as time period where the default is 1 day. This flexibility allows traders to adapt the indicator to different trading strategies and timeframes. Whether a trader focuses on intraday scalping or swing trading, the Magic Levels Indicator can be a valuable addition to their technical analysis toolkit.
DJ Soori Trading StrategyThe strategy combines three indicators: Exponential Moving Average (EMA), Weighted Moving Average (WMA), and Average Directional Index (ADX).
The EMA and WMA are used to track the average price over different time periods.
The ADX measures the strength of a trend in the market.
The strategy generates buy signals when the EMA is higher than the WMA and the ADX is above a certain threshold. It suggests a potential uptrend.
It generates sell signals when the EMA is lower than the WMA and the ADX is above the threshold. It suggests a potential downtrend.
The strategy also considers whether the ADX is rising or falling to indicate the strength of the trend.
The EMA, WMA, and ADX values are plotted on the chart.
Buy and sell signals are shown as labels on the chart, indicating "Buy (Strong)" or "Buy (Weak)" for buy signals, and "Sell (Strong)" or "Sell (Weak)" for sell signals.

Bank nifty puller and Dragger Hello Guys
using the below script you can check the nifty bank puller and draggers at live
how to use it?
it's straightforward
in the table, we will see the points contribution by each bank to Bank nifty
graph shows the overall strength of the buyers and sellers
using graphs also you can trade
but If you want to use a graph please note these important points
1:when the evergreen line cut the red line from below to top (cross-over) it says that buyers are strong but sometimes cross-over may fail and fall again
2: same things happen with the red line also
3: sometimes the graph shows that's a big difference between the red line and the green line that the market opened gap up gap down ( its difficult to define ) will update soon
4:when the market consolidates red and green lines will be very near to each other
5: when the green line is upper side the buyers are strong when the red line is upside sellers are strong (but sometimes it may mislead please be careful )
using the table you can check the overall view of all important banks
according to the time frame, data will be shown
this image shows the break out at 12.45 pm
2nd image shows the consolidation face of the market
this image shows that directly after opening the market sellers became stronger
this is how you can use the indicator
you can use graph or you can use table to get the over all view of the Bank nifty

BANKNIFTY position screenerThe script takes present day's price range of the stocks (stocks of the Index being tracked included in this screener) into account, to hint strength or weakness in the underlying Index (for example: BANKNIFTY here). The day's price range of a stock is gauged on a scale of 0-100, where 0 is Day's price low and 100 is day's price high.
If a stock is in 90-100 price range section the cell with title "90" illuminates hinting the stock is trading near day's high.
Likewise, if a stock is in 0-10 price range section the cell with title "10" illuminates hinting that the stock is trading near day's low.
The price range of 10-25 is represented in the cell titled "25"
The price range of 75-90 is represented in the cell titled "75"
Only one cell from the day's range illuminates at a time for a stock, signaling the present position of that stock in the Day's range at that instant.
The script works best above 10 second time frame.
Idea: If majority of the heavy weight stocks of the Index being tracked are trading near Day's high the underlying Index must be going strong at that very instant and Vice versa.
Disclaimer: Only for studying Index movement ideas intraday, trading is not advised.

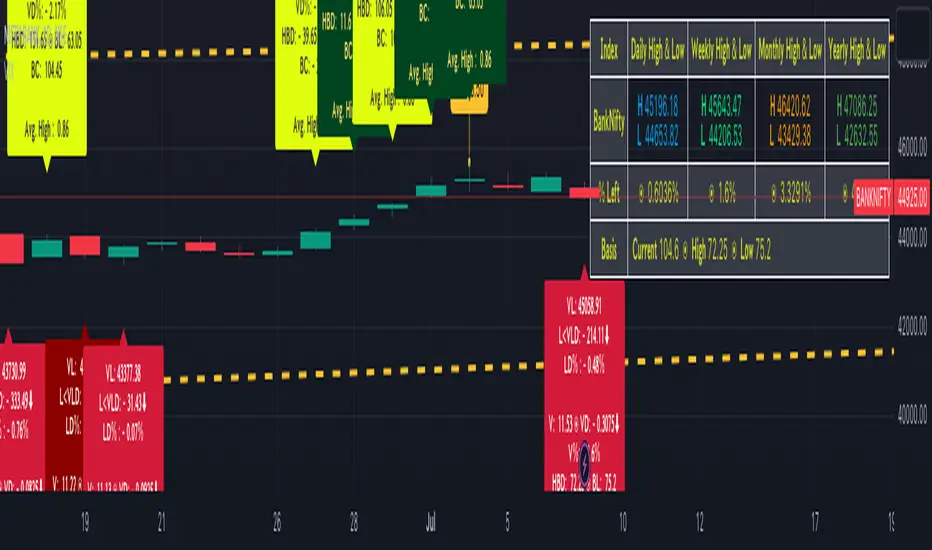
BankNifty targets using VIX Version 2Original Idea Credit: Verified Market Waves
Hi,
After watching different videos online on how to get targets of BankNifty & Nifty decided to write this small script using VIX.
Nothing great but I really like the concept of getting high and low targets for the day or weekly or monthly or yearly.
What does the script do
1. We get closing of India Vix & BankNifty and Nifty
2. We get square root of Daily (365 days) | Weekly (52) | Monthly (12) & Yearly (1)
3. We divide India Vix closing with different square root to get a decimal value.
4. We use the derived value from step 3 which is used as % to calculate high and low values on BankNifty close price.
Small explanation via below screen shot to understand how to use it.
As always it comes with source code so you can modify as per your requirement.
Hope it helps 👍
AI-Bank-Nifty Tech AnalysisThis code is a TradingView indicator that analyzes the Bank Nifty index of the Indian stock market. It uses various inputs to customize the indicator's appearance and analysis, such as enabling analysis based on the chart's timeframe, detecting bullish and bearish engulfing candles, and setting the table position and style.
The code imports an external script called BankNifty_CSM, which likely contains functions that calculate technical indicators such as the RSI, MACD, VWAP, and more. The code then defines several table cell colors and other styling parameters.
Next, the code defines a table to display the technical analysis of eight bank stocks in the Bank Nifty index. It then defines a function called get_BankComponent_Details that takes a stock symbol as input, requests the stock's OHLCV data, and calculates several technical indicators using the imported CSM_BankNifty functions.
The code also defines two functions called get_EngulfingBullish_Detection and get_EngulfingBearish_Detection to detect bullish and bearish engulfing candles.
Finally, the code calculates the technical analysis for each bank stock using the get_BankComponent_Details function and displays the results in the table. If the engulfing input is enabled, the code also checks for bullish and bearish engulfing candles and displays buy/sell signals accordingly.
The FRAMA stands for "Fractal Adaptive Moving Average," which is a type of moving average that adjusts its smoothing factor based on the fractal dimension of the price data. The fractal dimension reflects self-similarity at different scales. The FRAMA uses this property to adapt to the scale of price movements, capturing short-term and long-term trends while minimizing lag. The FRAMA was developed by John F. Ehlers and is commonly used by traders and analysts in technical analysis to identify trends and generate buy and sell signals. I tried to create this indicator in Pine.
In this context, "RS" stands for "Relative Strength," which is a technical indicator that compares the performance of a particular stock or market sector against a benchmark index.
The "Alligator" is a technical analysis tool that consists of three smoothed moving averages. Introduced by Bill Williams in his book "Trading Chaos," the three lines are called the Jaw, Teeth, and Lips of the Alligator. The Alligator indicator helps traders identify the trend direction and its strength, as well as potential entry and exit points. When the three lines are intertwined or close to each other, it indicates a range-bound market, while a divergence between them indicates a trending market. The position of the price in relation to the Alligator lines can also provide signals, such as a buy signal when the price crosses above the Alligator lines and a sell signal when the price crosses below them.
In addition to these, we have several other commonly used technical indicators, such as MACD, RSI, MFI (Money Flow Index), VWAP, EMA, and Supertrend. I used all the built-in functions for these indicators from TradingView. Thanks to the developer of this TradingView Indicator.
I also created a BankNifty Components Table and checked it on the dashboard.

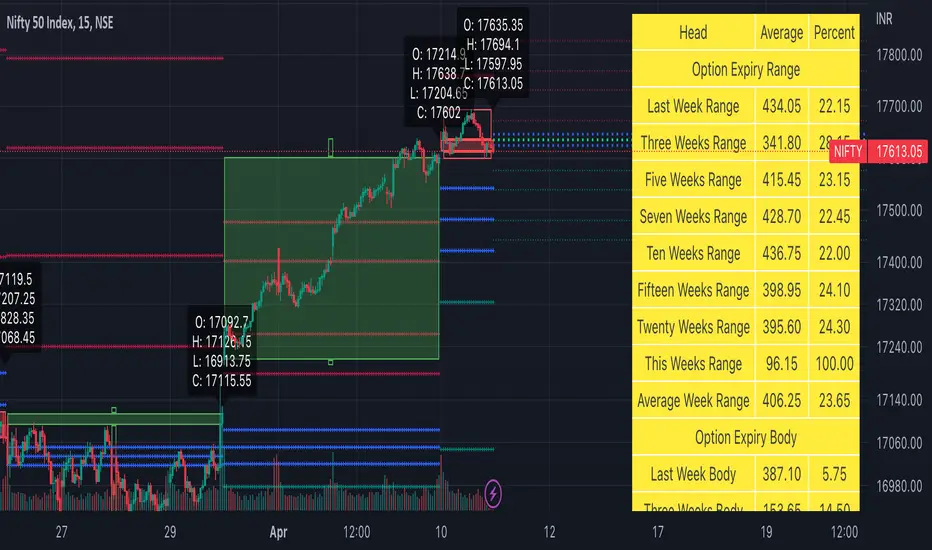
Weekly Options Expiry Candle V.2In India Weekly options expire on Thursday and that creates a different price action candle than the week timeframe.
My previous script Weekly Options Expiry Candle has some limitations. This script overcame those limitations and added some features.
You can use this in any intraday time frame candle.
It will show:
All expiry candle in box format
Expiry OHLC label
Pivot (Floor or Fibonacci) based on expiry OHLC data
Developing Expiry candle and Pivot
A table showing expiry range(high-low) and Expiry body abs(open-close) stats.
You can turn on or off any feature.
Please let me know if you found this script useful or have any questions or suggestions.
NSE:BANKNIFTY
NSE:NIFTY