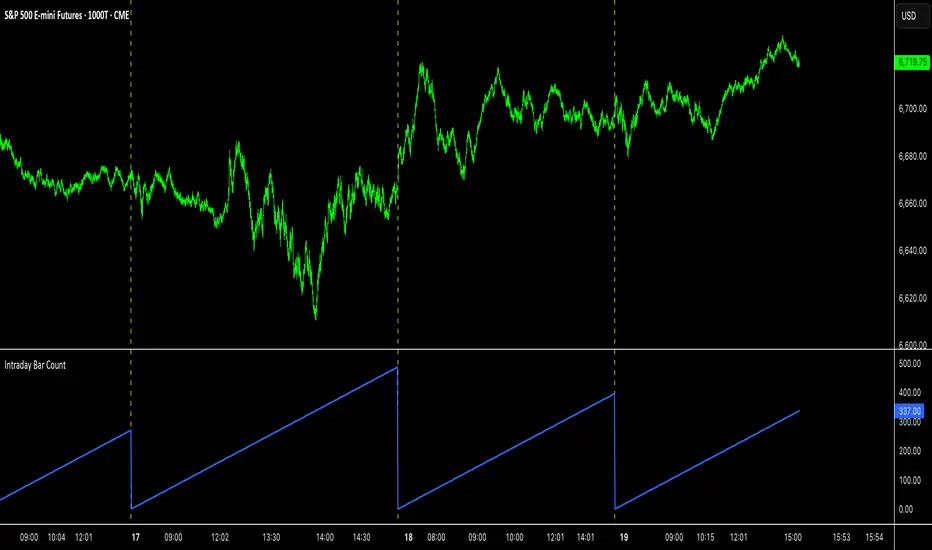
SuperTrend Bar Counter - DolphinTradeBot
OVERVIEW
This indicator calculates the lengths of upward and downward trends based on the specified SuperTrend settings and timeframe. It then takes the average length of the entered number of swings and compares the current trend durations with these averages. The main goal is to anticipate potential reversals in advance.
HOW IS IT WORK ?
The indicator actually contains two different but conceptually similar metrics.
The first part; shows how long the Supertrend stays in an upward or downward trend in real time. Additionally, it analyzes how close the current value is to the average of the Supertrend bar count for the given input.
The second part; aims to provide a different perspective on general trend analysis. It calculates the average duration of upward and downward trends in bars based on the SuperTrend indicator settings within a specified period and timeframe. If, contrary to expectations, downward trends last longer than upward trends, the background is colored green, indicating a prediction that the trend will continue upward.
Explanation of the second part logic: As you know, moving averages or similar approaches that follow the price are often correct when looking back retrospectively, but they cannot serve as leading indicators in real-time trading.That's why, when performing trend analysis, I wanted to introduce a completely different perspective based on price movement, yet still grounded in price action itself.
This phenomenon is partly due to the nature of the SuperTrend itself. After strong price movements, SuperTrend tends to reverse direction much more quickly during pullbacks. Following a strong upward move, a downward trend is detected much earlier and tends to last longer. The indicator provides an alternative perspective by analyzing which directional movement occurs more rapidly and uses this insight for trend prediction.
HOW TO USE ?
It can be used to identify potential price reversals or to assess whether the price is generally cheap or expensive.
In the settings section, you can adjust the SuperTrend parameters and timeframes for the values displayed in the table.
In the second part, you can configure the values used for general trend analysis.
NOTE
Things to be aware of: As the chart's timeframe decreases, pulling data from higher timeframes becomes more difficult. For example, when the chart is set to a 5-minute timeframe, it may fail to retrieve swing periods from the daily timeframe. Similarly, on a 4-hour chart, when calculating the average swing, there might be enough data for only 5 periods instead of 20.
Please keep in mind that this indicator was created solely to provide an idea. It should only be considered as a perspective or a supporting tool that influences your decision by no more than 5% at most.
Barcounter
The Bar Counter Trend Reversal Strategy [TradeDots]Overview
The Bar Counter Trend Reversal Strategy is designed to identify potential counter-trend reversal points in the market after a series of consecutive rising or falling bars.
By analyzing price movements in conjunction with optional volume confirmation and channel bands (Bollinger Bands or Keltner Channels), this strategy aims to detect overbought or oversold conditions where a trend reversal may occur.
🔹How it Works
Consecutive Price Movements
Rising Bars: The strategy detects when there are a specified number of consecutive rising bars (No. of Rises).
Falling Bars: Similarly, it identifies a specified number of consecutive falling bars (No. of Falls).
Volume Confirmation (Optional)
When enabled, the strategy checks for increasing volume during the consecutive price movements, adding an extra layer of confirmation to the potential reversal signal.
Channel Confirmation (Optional)
Channel Type: Choose between Bollinger Bands ("BB") or Keltner Channels ("KC").
Channel Interaction: The strategy checks if the price interacts with the upper or lower channel lines: For short signals, it looks for price moving above the upper channel line. For long signals, it looks for price moving below the lower channel line.
Customization:
No. of Rises/Falls: Set the number of consecutive bars required to trigger a signal.
Volume Confirmation: Enable or disable volume as a confirmation factor.
Channel Confirmation: Enable or disable channel bands as a confirmation factor.
Channel Settings: Adjust the length and multiplier for the Bollinger Bands or Keltner Channels.
Visual Indicators:
Entry Signals: Triangles plotted on the chart indicate potential entry points:
Green upward triangle for long entries.
Red downward triangle for short entries.
Channel Bands: The upper and lower bands are plotted for visual reference.
Strategy Parameters:
Initial Capital: $10,000.
Position Sizing: 80% of equity per trade.
Commission: 0.01% per trade to simulate realistic trading costs.
🔹Usage
Set up the number of Rises/Falls and choose whether if you want to use channel indicators and volume as the confirmation.
Monitor the chart for triangles indicating potential entry points.
Consider the context of the overall market trend and other technical factors.
Backtesting and Optimization:
Use TradingView's Strategy Tester to evaluate performance.
Adjust parameters to optimize results for different market conditions.
🔹 Considerations and Recommendations
Risk Management:
The strategy does not include built-in stop-loss or take-profit levels. It's recommended to implement your own risk management techniques.
Market Conditions:
Performance may vary in different market environments. Testing and adjustments are advised when applying the strategy to new instruments or timeframes.
No Guarantee of Future Results:
Past performance is not indicative of future results. Always perform due diligence and consider the risks involved in trading.