RSI [Hash Capital Research]RSI is a visually enhanced momentum indicator built on the classic Relative Strength Index.
This version expands RSI into a more flexible analytical tool through smoothing options, adaptive zone-based coloring, optional signal line overlays, and divergence detection.
It is designed as a context-building indicator, not a standalone entry system.
What This Indicator Does
This script calculates a smoothed RSI using user-defined parameters and then provides multiple optional enhancements:
1. Adaptive RSI Visualization
The core RSI is plotted with:
Zone-based color changes (neutral, oversold, overbought)
Optional glow effects to emphasize extreme conditions
User-defined color intensity and midline visibility
The goal is to provide clearer visual segmentation of trend strength and momentum behavior.
2. Custom Smoothing & Signal Line Options
The indicator allows:
Multi-layer smoothing for RSI stability
An optional signal line using the trader’s preferred moving-average method (SMA, EMA, SMMA/RMA, WMA, VWMA)
This helps operators examine whether momentum is accelerating or stabilizing relative to its mean.
3. Overbought/Oversold Tools
User-defined thresholds determine:
Highlighted zones
Optional markers for extreme reversals (based on RSI + momentum + velocity criteria)
Midline (50) cross highlights for trend-bias transitions
These features help contextualize where the RSI sits relative to broader momentum regimes.
4. Divergence Detection (Optional)
When enabled, the script scans for regular bullish and bearish divergences using pivot-based structure.
It compares:
Price making lower lows vs RSI making higher lows (bullish)
Price making higher highs vs RSI making lower highs (bearish)
Detected divergences are plotted on the RSI panel with visual labels.
This detection uses pivot lookbacks and range limits defined by the user.
5. Alerts
The indicator provides optional alerts for:
Extreme reversals
Overbought/oversold momentum shifts
Midline (50) crossovers
Bullish / bearish divergences
Alerts are intended for monitoring, not for automated execution.
How to Use It
This RSI modification is intended to support broader analysis workflows, including:
Identifying regime shifts using midline crosses
Monitoring momentum structure across trend phases
Highlighting oversold or overbought clustering
Adding a visual signal line to interpret momentum smoothing
Spotting divergence between price and RSI
As with all indicators, this tool should be used as one component of a complete analysis framework.
What Makes This Version Distinct
This script maintains the core behavior of RSI but introduces:
A multi-layer smoothing system
Adaptive colors calibrated to oversold/neutral/overbought zones
Optional glow visualizations
A modular signal-line engine with multiple MA types
Configurable divergence detection with visual labels
Multiple marker placement modes for extreme conditions
These features expand RSI’s readability while keeping its underlying logic transparent and consistent with common operator workflows.
Important Notes
This is an indicator, not a strategy. It does not execute trades or calculate performance metrics.
The visual enhancements are designed to improve clarity, not to generate automated “buy” or “sell” systems.
Divergence detection is optional because divergence is inherently contextual and may not apply equally across all markets or timeframes.
Based

EDUVEST UTBOT ADJ - Adaptive ATR Trailing StopEDUVEST UTBOT ADJ - Adaptive ATR Trailing Stop with Session-Based Sensitivity
━━━━━━━━━━━━━━━━━━━━━━━━━━━━━━━━━━━━━━━━━━━━━━━━
█ ORIGINALITY
This indicator is an enhanced version of the classic UT Bot concept, featuring automatic session-based ATR sensitivity adjustment. Unlike the original UT Bot which uses a fixed sensitivity value, this version dynamically adapts to different trading sessions (Tokyo, London, New York) and automatically detects asset characteristics to optimize signal generation.
━━━━━━━━━━━━━━━━━━━━━━━━━━━━━━━━━━━━━━━━━━━━━━━━
█ WHAT IT DOES
- Generates BUY and SELL signals based on ATR trailing stop crossovers with a moving average
- Automatically adjusts sensitivity based on current trading session (Tokyo/London/NY)
- Auto-detects asset type and applies optimized parameters for each instrument
- Displays real-time session information and volatility status
- Provides alert functionality with customizable cooldown periods
━━━━━━━━━━━━━━━━━━━━━━━━━━━━━━━━━━━━━━━━━━━━━━━━
█ HOW IT WORKS
【Core Logic: ATR Trailing Stop】
The indicator calculates an ATR-based trailing stop using the formula:
Trailing Stop = Price ± (Sensitivity × ATR)
When price is above the trailing stop and rising, the stop trails below price.
When price is below the trailing stop and falling, the stop trails above price.
【Signal Generation】
- BUY Signal: Price crosses above the trailing stop AND Moving Average crosses above the trailing stop
- SELL Signal: Price crosses below the trailing stop AND Moving Average crosses below the trailing stop
【Session-Based Sensitivity Adjustment】
The indicator adjusts ATR sensitivity based on trading session (JST timezone):
- Tokyo (08:00-15:00): Lower sensitivity (reduced by adjustment value) - typically quieter markets
- London (15:00-23:00): Base sensitivity - moderate volatility
- New York (23:00-08:00): Higher sensitivity (increased by adjustment value) - higher volatility
【Dynamic ATR Adjustment】
When enabled, the indicator compares current ATR to its smoothed average:
- ATR Ratio = Current ATR / SMA(ATR, smoothing period)
- Volatility Multiplier = 1.0 + (Sensitivity × (2.0 - ATR Ratio))
This reduces sensitivity during high volatility (fewer false signals) and increases sensitivity during low volatility (faster response).
【Auto Asset Detection】
The indicator automatically detects the traded instrument and applies optimized parameters:
- Stable pairs (USDJPY, EURUSD, USDCHF): Base sensitivity 1.5-1.8
- Moderate pairs (AUDUSD, USDCAD, EURJPY): Base sensitivity 2.0-2.3
- Volatile pairs (GBPUSD): Base sensitivity 2.8
- Commodities (GOLD/XAUUSD): Base sensitivity 3.5
- Indices (NASDAQ/NAS100): Base sensitivity 4.0
━━━━━━━━━━━━━━━━━━━━━━━━━━━━━━━━━━━━━━━━━━━━━━━━
█ HOW TO USE
【Recommended Settings】
- Timeframe: 15 minutes or higher (15M, 1H, 4H recommended)
- Best performance on: Forex majors, Gold, NASDAQ
- Enable "Auto Asset Detection" for optimized parameters
【Entry Rules】
- BUY: Enter long when green BUY label appears
- SELL: Enter short when pink SELL label appears
【Session Panel】
The top-right panel displays:
- Current trading session (Tokyo/London/NY)
- Volatility status (High Chance/Medium Chance/Caution)
- Mode (AUTO/MANUAL)
【Alert Setup】
1. Enable "Viewer Alert Display" in settings
2. Set cooldown period (default: 15 minutes) to avoid signal spam
3. Create alert with "Any alert() function call" condition
【Important Notes】
- This indicator does not repaint - signals are confirmed at bar close
- Lower timeframes (1M, 5M) may generate excessive signals
- Always use proper risk management and confirm with other analysis
━━━━━━━━━━━━━━━━━━━━━━━━━━━━━━━━━━━━━━━━━━━━━━━━
█ SETTINGS OVERVIEW
🎯 Alert Settings
- Viewer Alert Display: Enable/disable alert labels
- Cooldown Function: Prevent rapid consecutive signals
- Cooldown Time: Minutes between alerts (5-60)
🔧 Dynamic ATR Settings
- Enable Dynamic ATR: Auto-adjust based on volatility
- ATR Period: Calculation period (default: 14)
- ATR Smoothing: Smoothing period for ratio calculation
- Volatility Sensitivity: How much to adjust (0.1-1.0)
🕐 Session ATR Adjustment
- Enable Time Adjustment: Session-based sensitivity
- Show Session Info: Display session panel
📊 Asset Settings
- Auto Asset Detection: Automatically optimize for instrument
- Manual settings available when auto-detection is disabled
━━━━━━━━━━━━━━━━━━━━━━━━━━━━━━━━━━━━━━━━━━━━━━━━
█ CREDITS
Based on the original UT Bot concept by QuantNomad.
Enhanced with session-based adaptation and auto-asset detection by EduVest.
License: Mozilla Public License 2.0

Seasonal Strategies V1Seasonal Strategies V1 is a rule-based futures seasonality framework built around predefined calendar windows per asset.
The strategy automatically detects the current symbol and activates long or short trading phases strictly based on historically observed seasonal tendencies. All entries and exits are fully time-based — no indicators, no predictions, no discretionary input.
Key Features
Asset-specific seasonal windows (MMDD-based)
Automatic long and short activation
Fully time-based entries and exits
One position at a time (no pyramiding)
Clean chart visualization using subtle background shading
No indicators, no filters, no curve fitting
Philosophy:
This strategy is designed as a structural trading tool, not a forecasting model.
It focuses on when a market historically shows seasonal tendencies — not why or how far price might move.
Seasonal Strategies V1 intentionally keeps the chart clean and minimal, making it suitable as a baseline framework for research, portfolio-style seasonal approaches, or further extensions in later versions.
Intended Use:
Futures and commodity markets
Seasonality research and testing
Systematic, calendar-driven strategies
Educational and analytical purposes
Disclaimer
This script is provided for educational and research purposes only.
Past seasonal tendencies do not guarantee future performance.
Risk management, position sizing, and portfolio decisions are the responsibility of the user.

Volume Profile Auto POC📌 Overview
Volume Profile Auto POC is a trend-following strategy that uses the automatically calculated Point of Control (POC) from the volume profile, combined with ATR zones, to capture reversals and breakouts.
By basing decisions on volume concentration, it dynamically visualizes the price levels most watched by market participants.
⚠️ This strategy is provided for educational and research purposes only.
Past performance does not guarantee future results.
🎯 Strategy Objectives
Automatically detect the volume concentration area (POC) to improve entry accuracy
Optimize risk management through ATR-based volatility adjustment
Provide early and consistent signals when trends emerge
✨ Key Features
Automatic POC Detection : Updates the volume profile over a defined lookback window in real time
ATR Zone Integration : Defines a POC ± 0.5 ATR zone to clarify potential reversals/breakouts
Visual Support : Plots the POC line and zones on the chart for intuitive decision-making
📊 Trading Rules
Long Entry:
Price breaks above the POC + 0.5 ATR zone
Volume is above average to support the breakout
Short Entry:
Price breaks below the POC - 0.5 ATR zone
Volume is above average to support the downside move
Exit (or Reverse Position):
Price returns to the POC area
Or touches the ATR band
⚙️ Trading Parameters & Considerations
Indicator Name: Volume Profile Auto POC
Parameters:
Lookback Bars: 50
Bins for Volume Profile: 24
ATR Length: 14
ATR Multiplier: 2.0
🖼 Visual Support
POC line plotted in red
POC ± 0.5 ATR zone displayed as a semi-transparent box
ATR bands plotted in blue for confirmation
🔧 Strategy Improvements & Uniqueness
This strategy is inspired by traditional Volume Profile + ATR analysis,
while adding the improvement of a sliding-window mechanism for automatic POC updates.
Compared with conventional trend-following approaches,
its strength lies in combining both price and volume perspectives for decision-making.
✅ Summary
Volume Profile Auto POC automatically extracts key market levels (POC) and combines them with ATR-based zones,
providing a responsive trend-following method.
It balances clarity with practicality, aiming for both usability and reproducibility.
⚠️ This strategy is based on historical data and does not guarantee future profits.
Always use proper risk management when applying it.

Time-based LiquidityThis indicator automatically marks important time-based liquidity levels on your chart, helping you stay aware of where major price reactions may occur and the market is forced to show its hand.
Key Features:
Previous Month’s, Week’s, and Day’s Highs and Lows: Displays PMH/PML, PWH/PWL, and PDH/PDL — key reference points where liquidity often accumulates.
Intraday Session Highs and Lows: Divides the trading day into quarters (00:00–06:00, 06:00–12:00, etc. following Day’s Quarterly Theory) and tracks session highs and lows dynamically across these periods.
Current Session 90-Minute Quarters: Splits the active session into 90-minute intervals to highlight short-term liquidity structures and potential reaction zones.
Level Alerts: Tracks when each liquidity level is reached and enables customizable alerts so you don’t miss important price movements.
Use Case:
This tool provides an organized, time-based framework for identifying where liquidity is likely to concentrate across different timeframes and intraday cycles. Use these levels for forming bias, planning entries, exits, or anticipating price reactions at key points in the market structure.
Customization Options:
Enable/disable liquidity levels to display (Daily, Weekly, Monthly, Sessions, Session Quarters)
Customize the appearance of each level (color, style, line width)
Enable or disable tracking and alerts for level interactions

[CLX][#02] Registry (type-based)This script only provides a basic __setter and __getter registration function with a type-based limitation.
We don't want to blow the code with additional conditions. The suggestion was to get the basic functionality.
Benefits:
- Get/set/update global-like variables between functions
- No init needed. You can call a entry before you set it.
Get-Functions:
- f_reg_getInt(_key)
- f_reg_getFloat(_key)
- f_reg_getBool(_key)
- f_reg_getString(_key)
- f_reg_getColor(_key)
- f_reg_getLabel(_key)
- f_reg_getLine(_key)
Set-Functions:
- f_reg_setInt(_key, _value)
- f_reg_setFloat(_key, _value)
- f_reg_setBool(_key, _value)
- f_reg_setString(_key, _value)
- f_reg_setColor(_key, _value)
- f_reg_setLabel(_key, _value)
- f_reg_setLine(_key, _value)
Feel free to contribute for an extended version. :)
We hope you enjoy it! 🎉
CRYPTOLINX - jango_blockchained 😊👍
Disclaimer:
Trading success is all about following your trading strategy and the indicators should fit within your trading strategy, and not to be traded upon solely.
The script is for informational and educational purposes only. Use of the script does not constitute professional and/or financial advice. You alone have the sole responsibility of evaluating the script output and risks associated with the use of the script. In exchange for using the script, you agree not to hold dgtrd TradingView user liable for any possible claim for damages arising from any decision you make based on use of the script.

Auto Fib Time Zones and Trend-Based Fib Time by DGTFibonacci time zones, based on the Fibonacci number sequence, are vertical lines that represent potential areas where a swing high, low, or reversal could occur.
Trend-Based Fib Time shows probable price corrections in an existing trend. A useful tool to use in addition to Elliot Wave counting, Fib Time helps to identify how far the wave is likely to travel
Please note, Time zones aren't concerned with price, only time
Disclaimer :
Trading success is all about following your trading strategy and the indicators should fit within your trading strategy, and not to be traded upon solely
The script is for informational and educational purposes only. Use of the script does not constitute professional and/or financial advice. You alone have the sole responsibility of evaluating the script output and risks associated with the use of the script. In exchange for using the script, you agree not to hold dgtrd TradingView user liable for any possible claim for damages arising from any decision you make based on use of the script


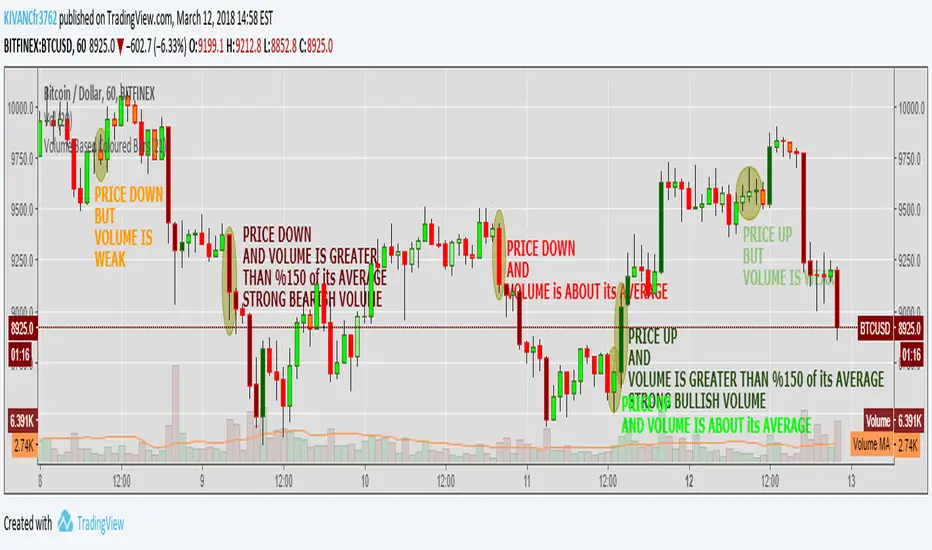
Volume Based Coloured BarsVolume Based Coloured Bars:
Most of the time traders are confused about if the price movements were supported by VOLUME .
This indicator colors the bars into volume weighted signals...
When prices go down bars are red and contraversely when up, bars are green. Additionally we have two more colors for each
situation:
PRICE BARS ARE:
DARK RED when prices go down and VOLUME is bigger than 150% of its (default 21 day) average, that indicates us price action is supported by a strong BEARISH VOLUME
RED when prices go down and VOLUME is BETWEEN 50% AND 150% of its (default 21 day) average, at this situation we can think that volume is neither strong nor weak
ORANGE when prices go down and VOLUME is just less than 50% of its (default 21 day) average, so the volume is weak and doesn't support the price action much
DARK GREEN when prices go UP and VOLUME bigger than 150% of its (default 21 day) average, that indicates us price action is supported by a strong BULLISH VOLUME
GREEN when prices go UP and VOLUME is BETWEEN 50% AND 150% of its (default 21 day) average, at this situation we can think that volume is neither strong nor weak
LIGHT GREEN when prices go UP and VOLUME is just less than 50% of its (default 21 day) average, so the volume is weak and doesn't support the price action much
21 day Simple Moving Average used as default value which can be changed in the settings menu,
21 day is considered as a month for STOCK Markets, it would be more accurate to set the value to 30 for CRYPTO CURRENCIES