Benford's Law Actual [Tagstrading]Benford’s Law Chart — First Digit Analysis of Percentage Price Drops
This script visualizes the distribution of the leading digit in the percentage change of price drops, and compares it to the theoretical distribution expected by Benford’s Law.
It helps traders, analysts, and quants to detect anomalies, unnatural behavior, or price manipulation in any asset or timeframe.
How to Use
Add to any chart or symbol (stocks, crypto, FX, etc.) and select the timeframe you wish to analyze.
Set the “Number of Bars to Analyze” input (default: 500) to control the length of the historical window.
The chart will display, for the latest window:
A blue line: the actual leading-digit distribution for percentage price changes between bars.
A red line: the expected distribution per Benford’s Law.
Labels below and above: digit markers and the expected (theoretical) percentages.
Summary panel on the right: frequency counts and actual vs. theoretical % for each digit.
Interpretation:
If your actual (blue) curve or digit counts are significantly different from the red Benford’s Law curve, it could indicate unnatural price action, fraud, bot activity, or structural anomalies.
Why is this useful for TradingView?
Financial forensics: Benford’s Law is a classic tool for detecting data manipulation and fraud in accounting. On charts, it can reveal if price movements are statistically “natural.”
Transparency and confidence: Helps communities audit markets, brokers, or exchanges for irregularities.
Adaptable: Works on any market, any timeframe.
What makes this script unique?
Focuses on % price changes, not raw prices.
This provides a fair comparison across assets, symbols, and timeframes.
Measures only the direction and magnitude of drops/rises — more suitable for detecting manipulation in active markets.
Clear and customizable visualization:
The Benford line, actual data, and summary are all visible and readable in one glance.
Optimized for speed and clarity (runs efficiently on all major charts).
How is it different from stg44’s Benford’s Law script?
This script analyzes the leading digit of percentage price changes (i.e., how much the price drops or rises in %),
while the original by stg44 analyzes the leading digit of price itself.
Results are less sensitive to price scale and more comparable across volatile and non-volatile assets.
The summary panel clearly shows ( ) for actual and for Benford theoretical values.
Full code is commented and open for the community.
Credits and Inspiration
This script was inspired by “Benford’s Law” by stg44:
Thanks to the TradingView community for sharing powerful visual ideas.
—
By tags trading
Benford

BenfordsLawLibrary "BenfordsLaw"
Methods to deal with Benford's law which states that a distribution of first and higher order digits
of numerical strings has a characteristic pattern.
"Benford's law is an observation about the leading digits of the numbers found in real-world data sets.
Intuitively, one might expect that the leading digits of these numbers would be uniformly distributed so that
each of the digits from 1 to 9 is equally likely to appear. In fact, it is often the case that 1 occurs more
frequently than 2, 2 more frequently than 3, and so on. This observation is a simplified version of Benford's law.
More precisely, the law gives a prediction of the frequency of leading digits using base-10 logarithms that
predicts specific frequencies which decrease as the digits increase from 1 to 9." ~(2)
---
reference:
- 1: en.wikipedia.org
- 2: brilliant.org
- 4: github.com
cumsum_difference(a, b)
Calculate the cumulative sum difference of two arrays of same size.
Parameters:
a (float ) : `array` List of values.
b (float ) : `array` List of values.
Returns: List with CumSum Difference between arrays.
fractional_int(number)
Transform a floating number including its fractional part to integer form ex:. `1.2345 -> 12345`.
Parameters:
number (float) : `float` The number to transform.
Returns: Transformed number.
split_to_digits(number, reverse)
Transforms a integer number into a list of its digits.
Parameters:
number (int) : `int` Number to transform.
reverse (bool) : `bool` `default=true`, Reverse the order of the digits, if true, last will be first.
Returns: Transformed number digits list.
digit_in(number, digit)
Digit at index.
Parameters:
number (int) : `int` Number to parse.
digit (int) : `int` `default=0`, Index of digit.
Returns: Digit found at the index.
digits_from(data, dindex)
Process a list of `int` values and get the list of digits.
Parameters:
data (int ) : `array` List of numbers.
dindex (int) : `int` `default=0`, Index of digit.
Returns: List of digits at the index.
digit_counters(digits)
Score digits.
Parameters:
digits (int ) : `array` List of digits.
Returns: List of counters per digit (1-9).
digit_distribution(counters)
Calculates the frequency distribution based on counters provided.
Parameters:
counters (int ) : `array` List of counters, must have size(9).
Returns: Distribution of the frequency of the digits.
digit_p(digit)
Expected probability for digit according to Benford.
Parameters:
digit (int) : `int` Digit number reference in range `1 -> 9`.
Returns: Probability of digit according to Benford's law.
benfords_distribution()
Calculated Expected distribution per digit according to Benford's Law.
Returns: List with the expected distribution.
benfords_distribution_aprox()
Aproximate Expected distribution per digit according to Benford's Law.
Returns: List with the expected distribution.
test_benfords(digits, calculate_benfords)
Tests Benford's Law on provided list of digits.
Parameters:
digits (int ) : `array` List of digits.
calculate_benfords (bool)
Returns: Tuple with:
- Counters: Score of each digit.
- Sample distribution: Frequency for each digit.
- Expected distribution: Expected frequency according to Benford's.
- Cumulative Sum of difference:
to_table(digits, _text_color, _border_color, _frame_color)
Parameters:
digits (int )
_text_color (color)
_border_color (color)
_frame_color (color)

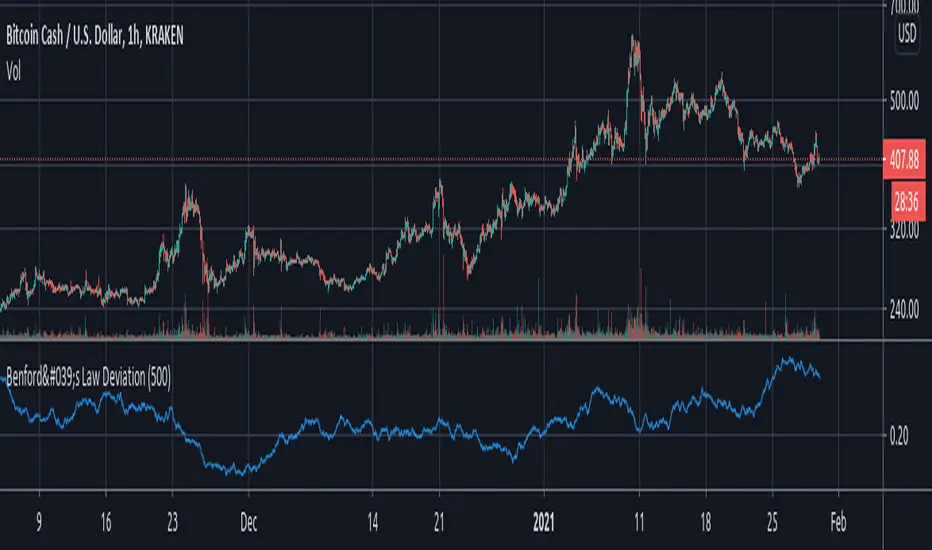
Benford's Law DeviationThis Study uses Benford's Law , which states that unmanipulated numerical real-life data sets should contain a certain distribution of leading digits. This Mathematical Law may be useful to identify whether there is market-manipulation going on and to which degree. The higher the value the script outputs, the higher the deviation from the expected leading-digit distribution - indicating a possibly higher probability of market manipulation going on. The script fetches the leading digits of the volume and percentage price change and calculates their distribution to compute the deviation from the expected distribution according to Benford's Law.