R2-Adaptive RegressionOVERVIEW
This is an implementation of alexgrover's R2-Adaptive Regression optimized for the latest version of TradingView.
Full details on the indicator are on alexgrover's page here:
Bias

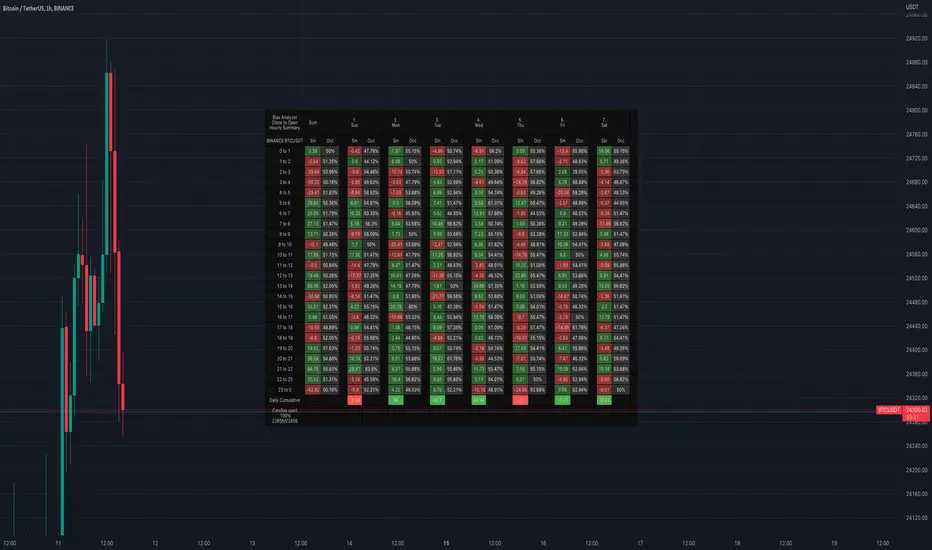
Bias AnalyzerName: Bias Analyzer
Category: Market Analyzer
Timeframe: 1H and 1D, depending on the Analysis type.
Technical Analysis: Usually when we think about a Trading System we start from an idea. This idea comes normally from observation and the study of the market.
Have we ever observed a market - for example Bitcoin - and thought that it increases at the start of a USA session? Great, this is a well-known category of Trading System and the purpose of the Bias Analyzer is to study these phenomena.
There are different types of Trading System that we can classify considering the market in-efficiency that we use to our advantage. In this case we make the Bias. Literally "inclination" or "presupposition" or precisely "tendency" of the price to go up or down in a temporal way.
The characteristics of the Bias depend on how much the Bias is persistent on the market since the analysed period. therefore we can consider:
Hourly Bias : analysing the hourly behaviours during the week. Trades normally last from a few hours to a few days.
Seasonal Bias : analysing the behaviour of the weeks in the monthly or annual context, evaluating the seasons.
Suggested usage: The possibilities of the tool are infinite, these are some scenarios of use:
Development of Intraday Trading Systems based on Hourly Bias with possible filters for specific days of the week.
Development of a Multi-day Trading System based on daily Bias with monthly analysis.
To identify the best day to execute our investment through Dollar Cost Average with a bit of healthy buy the dip
Main features:
Hourly Summary organized in Week
The cells contain the sum of the various price deltas for the single hour. The transparency indicates the frequency in which the candles close positive or negative. This information is available both in a synthetic way, as in the first column "Sum", and for each day of the week.
Hourly Details organized in different entry/exit
Shows the cumulative data of the various deltas, considering the purchase and the sale at certain times. In the rows are represented the buying hours and in the columns the selling hours.
Daily Summary organized in Months
The cells contain the summation of the various price deltas for the single day.
Hourly Details organized in different entry/exit
Allows to visualise the detailed analysis table, choosing to do it for all the months or for a specific month and shows the cumulative data of the various deltas, considering the purchase and the sale in certain days.
Configuration: You can configure the tool easily and completely.
Analysis
Calculate from Close to Open : this is the core of the whole analysis where the "Price Delta" to be calculated is defined. At this moment there is the possibility to calculate the distance between opening and closing.
Calculate in Percent or Cash : this allows to calculate the Price Delta in Percent or in Cash.
Analysis on 1H Timeframe
Show Hourly Summary on : allows to visualise the summary analysis table of the week. The cells contain the sum of the various price deltas for the single hour. The transparency indicates the frequency in which the candles close positive or negative. This information is available both in a synthetic way, as in the first column "Sum", and for each day of the week. At the bottom left there is also data which allows us to understand how many candles are being analysed. At the bottom of each day it is possible to visualise the cumulative data of the day. The position of the table is customizable.
Show Hourly Details of on : allows to visualise the detailed analysis table, choosing to do it for all days or for a specific day, and shows the cumulative data of the various deltas, considering the purchase and the sale at certain times. In the rows are represented the buying hours and in the columns the selling hours. For example, going to the table "All Days" we can see in the cell of row 13 and in column 22 the cumulative data of a possible buy on 13 and a sell at the end of 22. To facilitate the research of the values there is a configurable transparency system.
Analysis on 1D Timeframe
Show Daily Summary on : allows to visualise the summary analysis table of the month. The cells contain the summation of the various price deltas for the single day: The first row is the summation of all days of the month for all months in the analysis period, while the other rows represent the analysis for the various days of the individual months.
Show Daily Details of on : allows to visualise the detailed analysis table, choosing to do it for all the months or for a specific month and shows the cumulative data of the various deltas, considering the purchase and the sale in certain days. In the rows are represented the buying days and in the columns the selling days. For example, going to the table "All Months" we can see in the cell at row 1 and at column 3 the cumulative of a possible purchase on the 1st and the sale on the 3rd. To facilitate the research of the values, there is a configurable transparency system.
Table Layout
Size : allows to define the size of the text in the table.
Precision : it is possible to define the decimal precision of the calculations presented in the tables.
Transparency Factor : allows the application of a multiplication factor when the table calculates the transparency of detail tables.
Colours : allows to specify the colours of Profit, Loss and Neutral, besides to adapt a style coherent with the Dark Mode or Light Mode of Trading View
Volatility Filter
It is possible to directly apply a filter to the time series on which the delta is calculated. The volatility filter uses the ATR - an indicator that allows you to calculate the volatility in a given period. Briefly: the higher the ATR value, the higher the volatility. Therefore the filter works by comparing the volatility on two periods and indicates compression or expansion.
Backtest Dates
In order to facilitate the identification of in-sample and out-of-sample data, as well as the degradation of a given behaviour, it is possible to specify a period in which to do the analysis.
Breakout Probability (Expo)█ Overview
Breakout Probability is a valuable indicator that calculates the probability of a new high or low and displays it as a level with its percentage. The probability of a new high and low is backtested, and the results are shown in a table— a simple way to understand the next candle's likelihood of a new high or low. In addition, the indicator displays an additional four levels above and under the candle with the probability of hitting these levels.
The indicator helps traders to understand the likelihood of the next candle's direction, which can be used to set your trading bias.
█ Calculations
The algorithm calculates all the green and red candles separately depending on whether the previous candle was red or green and assigns scores if one or more lines were reached. The algorithm then calculates how many candles reached those levels in history and displays it as a percentage value on each line.
█ Example
In this example, the previous candlestick was green; we can see that a new high has been hit 72.82% of the time and the low only 28.29%. In this case, a new high was made.
█ Settings
Percentage Step
The space between the levels can be adjusted with a percentage step. 1% means that each level is located 1% above/under the previous one.
Disable 0.00% values
If a level got a 0% likelihood of being hit, the level is not displayed as default. Enable the option if you want to see all levels regardless of their values.
Number of Lines
Set the number of levels you want to display.
Show Statistic Panel
Enable this option if you want to display the backtest statistics for that a new high or low is made. (Only if the first levels have been reached or not)
█ Any Alert function call
An alert is sent on candle open, and you can select what should be included in the alert. You can enable the following options:
Ticker ID
Bias
Probability percentage
The first level high and low price
█ How to use
This indicator is a perfect tool for anyone that wants to understand the probability of a breakout and the likelihood that set levels are hit.
The indicator can be used for setting a stop loss based on where the price is most likely not to reach.
The indicator can help traders to set their bias based on probability. For example, look at the daily or a higher timeframe to get your trading bias, then go to a lower timeframe and look for setups in that direction.
-----------------
Disclaimer
The information contained in my Scripts/Indicators/Ideas/Algos/Systems does not constitute financial advice or a solicitation to buy or sell any securities of any type. I will not accept liability for any loss or damage, including without limitation any loss of profit, which may arise directly or indirectly from the use of or reliance on such information.
All investments involve risk, and the past performance of a security, industry, sector, market, financial product, trading strategy, backtest, or individual's trading does not guarantee future results or returns. Investors are fully responsible for any investment decisions they make. Such decisions should be based solely on an evaluation of their financial circumstances, investment objectives, risk tolerance, and liquidity needs.
My Scripts/Indicators/Ideas/Algos/Systems are only for educational purposes!

Market Bias (CEREBR)Hello Everyone. I hope you are all doing great. It's been a long time since I posted my first script here, and I got a lot of response from that.
So, I thought I should share this script also to everyone, and anyone that may find it useful. Personally, I use it to tell the general market conditions.
Here's how I works : The script tries to determine the overall direction of the market, using smoothed Heiken Ashi candles. The coloring system (using bright and dark colors) is an attempt to detect strong market and weak market conditions. There's also an oscillator within the script, but for now it isn't plotted. Credits to @jackvmk, I used part of his open-script code in this indicator.\
I have considered using the slope of the indicator plot as a filter for ranging market conditions. The plot goes relatively flat in 'flat' markets. However, I have not done anything about that yet. Maybe some other time.
I hope you find this useful. If you find a way to use this, please share it with the community in the comment section.
NOTE: THIS IS BY NO MEANS FINANCIAL ADVICE. You'll have to make your studies and come up with a way to apply this indicator to your trading style and strategy.
By the way, I would be going with the name 'CEREBR' for any subsequent scripts I release from now on.
Happy Trading, guys.

Bias Pivot PointA simple indicator that uses Pivot Points as a filter and to generate a Directional Bias .
How to use this indicator?
1. Directional Bias
Bullish => Closing Price > Pivot Point
Bearish => Closing Price < Pivot Point
2. Support / Resistance
Each Pivot Points can be used as Support or Resistance
3. Take Profit Targets
Each Pivot Points can be used as targets for taking profit

Hourly Bias on BTC in Bullish USA Session “Green Eagle”Name: Hourly Bias on BTC in Bullish USA Session
Category: Hourly Bias
Operating mode: Spot, only long
Trades duration: Intraday, 11 bars
Timeframe: 1H
Suggested usage: When the market is compressed, USA session has a bullish bias.
Entry: enter Long at 15:00 on specific days of the week. There is a volatility filter based on ATR which identifies compression.
Exit: exit at a pre-defined time at 01:00
Usage:
⁃ It can be useful to use alerts or webhooks to automate this strategy.
⁃ This is a core system that can be improved in different ways (e.g. Stop-loss, take-profit, position sizing) or studying more the behaviour in the specific days of the week or short when is red.
Configuration:
- N/A
Backtesting
⁃ Exchange: BINANCE
⁃ Pair: BTCUSDT
⁃ Timeframe: 1H
⁃ Fee 0.075%
⁃ Slippage 2
- Start : 2019-01-06
We decided to release this free BTC strategy.
How you or we can improve? Source code is open so share your ideas!

[LanZhu] - Bias With DivergenceDescription
Bias is also known as deviation rate which is a technical index derived from the moving average principle. Its function is to measure the deviation degree between the stock price and the moving average line in the process of fluctuation.
Usage
Generally ,
Moving averages of period 6,12,24 and 72 are used in the calculation. Of course, it is adjustable and result in different sensitivity of the deviation rate.
When the stock price is above the moving average, it is positive.
When the stock price is below the moving average, it is negative.
When the stock price is consistent with the moving average, it is zero.
Example,
1. During weak market, we may take when 6-day deviation rate cross both 5 and -5 level to indicate possible overbought and oversold respectively. Reversal or rebound might happen.
2. During strong market, we may take when 6-day deviation rate cross both 8 and -8 level to indicate possible overbought and oversold respectively. Reversal or rebound might happen.
3. When all the bias lines are moving upward and across 0 line, a strong bullish trend might formed and Vice Versa for strong bearish trend
4. Divergence also added to find possible bull or bear reversal on the default bias period which is configurable.

Volume BiasHere’s an indicator that calculates the difference between the average distance we need to look back to find the up and down volume equal to the total volume of the last n bars. The further we need to look back to find the up or down volume, the more bearish or bullish its value is.
A not-yet published indicator from the PS-V5 blog!

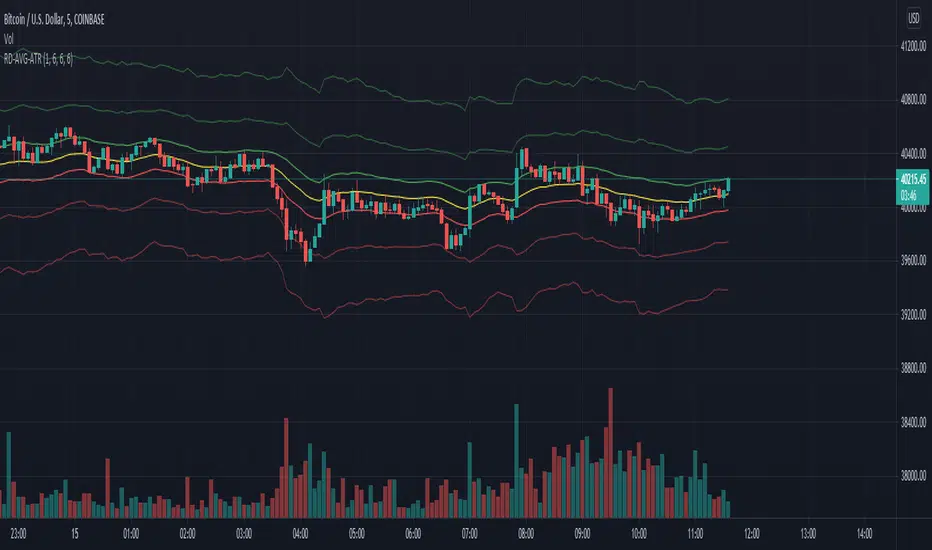
RexDog Average with ATRBam-- look what Rex did. A RexDog Average with ATR bands-- he's going insane. Simple but powerful.
This indicator includes the RexDog average but provides you with the ability to plot (and customize) both above and below ATR calculated bands.
With this indicator you can display all 3 or any combination of the bands: the RexDog Avg, Adding ATR Upper or the Subtracting ATR Below.
To remove a plot or customize color and line size go to the style options.
Before we get detailed with this version you can customize the default average factor of the RexDog Avg (default is 6). More tips on this below.
How This Works
Just as with the RexDog Average we take the 6 ATR data points (200, 100, 50, 24, 9, 5). We then create an average by dividing by 6. But wait there's more...
With this indicator you can customize independently the above and below bands via a float value for precision. 6 is the default (you can customize by increments at 0.25 or input value you like 1-20).
Now this works opposite how you might think but you'll get it once you start changing the numbers. For instance, editing the above band lowering the ATR factor will raise the band.
RexDog Avg Factor
With this release you are able to change the default average factor (6) to anything you want. You'll find though going too high or low from the default won't get the best results. The default increment change is 0.1 but you can enter any float value you like between 1-20.
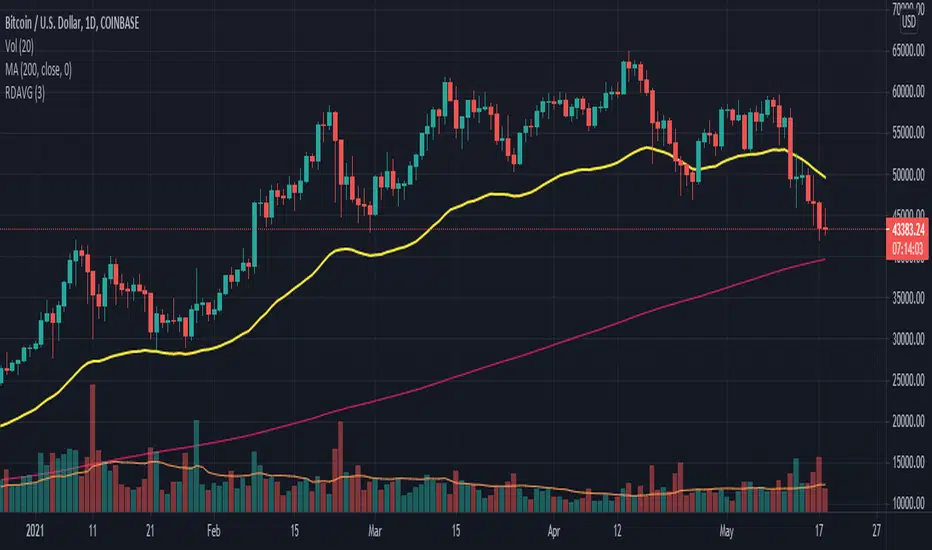
The Original RexDog Average Overview
Yes, simple—the RexDog Average is a bias moving average indicator. The purpose is to provide the overall momentum bias you should have when trading an instrument. It works across all markets and all timeframes.
Usage:
Price above the RexDog AVG = long momentum bias
Price below the RexDog AVG = short momentum bias
With the ATR addition most likely your usage will be similar to Bollinger Bands. While not the same as in deviations much of the same principles might apply, especially with customization.
*Note: we have banned the word “trend” in the RexDog Trading Method.
Additional Usage Advice:
If price rips through the average your momentum bias should probably change. 80% of the time when price moves through the RexDog Average it will come back and test the area around average within 1-2 bars. 20% of the time it does not. The momentum is so strong in that direction so look for a 50-70% tests of the bar that impulse through the RexDog Average.
If you are using the RexDog Trading Method by default if the price is above the average and you are short you are in a fade trade. The momentum trade would be long. Of course reverse if price is below.
On multiple time frames. Of course, one timeframe can be long bias and a lower timeframe can be short bias. Which one do you use? Both—if your in a short trade using lower timeframe and with the bias of the average your in a momentum trade—but on the higher timeframe your aware you are essential fading the overall momentum.
Background:
Rex and I searched high and low for one simple thing. A moving average (or combination of some) that we could use to form our momentum bias that worked for all timeframes and all markets we trade.
We tried and tested them all. Even went down the path of ribbons and various other types of hybrid EMA /MA derivatives. Nothing had a high enough accuracy or mathematically was reliable that we could say with a high probability that it was on the right side of the momentum.
We almost stopped and landed on using the true and tested 200 MA—but we found through extensive tests that using the 200MA or EMA you’re often late to the party. Look you don’t need to be the first one in the trade but having a heads up sure helps.
To quote one of the best financial movies of the modern era—Margin Call:
“There are three ways to make a living in this business: be first, be smarter, or cheat… it sure is a hell of a lot easier to be first”. The RexDog Average used properly enables you to be first or damn near close.
Under the Hood:
This is so simple most reading this will discount it. You might even scoff and berate Rex for wasting your time. But you would be wrong. The RexDog Average has been tested across all markets—FOREX, Crypto, Equities, Futures (even tick charts), and even the Penguin population in Antarctica.
The RexDog Average is an average of 6 simple moving averages: 200, 100, 50, 24, 9, 5.
Yes, that’s it.
RexDog AverageYes, simple—the RexDog Average is a bias moving average indicator. The purpose is to provide the overall momentum bias you should have when trading an instrument. It works across all markets and all timeframes.
Usage:
Price above the RexDog AVG = long momentum bias
Price below the RexDog AVG = short momentum bias
*Note: we have banned the word “trend” in the RexDog Trading Method.
Additional Usage Advice:
If price rips through the average your momentum bias should probably change. 80% of the time when price moves through the RexDog Average it will come back and test the area around average within 1-2 bars. 20% of the time it does not. The momentum is so strong in that direction so look for a 50-70% tests of the bar that impulse through the RexDog Average.
If you are using the RexDog Trading Method by default if the price is above the average and you are short you are in a fade trade. The momentum trade would be long. Of course reverse if price is below.
On multiple time frames. Of course, one timeframe can be long bias and a lower timeframe can be short bias. Which one do you use? Both—if your in a short trade using lower timeframe and with the bias of the average your in a momentum trade—but on the higher timeframe your aware you are essential fading the overall momentum.
Background:
Rex and I searched high and low for one simple thing. A moving average (or combination of some) that we could use to form our momentum bias that worked for all timeframes and all markets we trade.
We tried and tested them all. Even went down the path of ribbons and various other types of hybrid EMA/MA derivatives. Nothing had a high enough accuracy or mathematically was reliable that we could say with a high probability that it was on the right side of the momentum.
We almost stopped and landed on using the true and tested 200 MA—but we found through extensive tests that using the 200MA or EMA you’re often late to the party. Look you don’t need to be the first one in the trade but having a heads up sure helps.
To quote one of the best financial movies of the modern era—Margin Call:
“There are three ways to make a living in this business: be first, be smarter, or cheat… it sure is a hell of a lot easier to be first”. The RexDog Average used properly enables you to be first or damn near close.
Under the Hood:
This is so simple most reading this will discount it. You might even scoff and berate Rex for wasting your time. But you would be wrong. The RexDog Average has been tested across all markets—FOREX, Crypto, Equities, Futures (even tick charts), and even the Penguin population in Antarctica.
The RexDog Average is an average of 6 simple moving averages: 200, 100, 50, 24, 9, 5.
Yes, that’s it.
The RexDog Average Plus will be released soon with additional parameters and most likely upper and lower bounds. In addition, we are working on a hybrid RexDog Exponential Average.
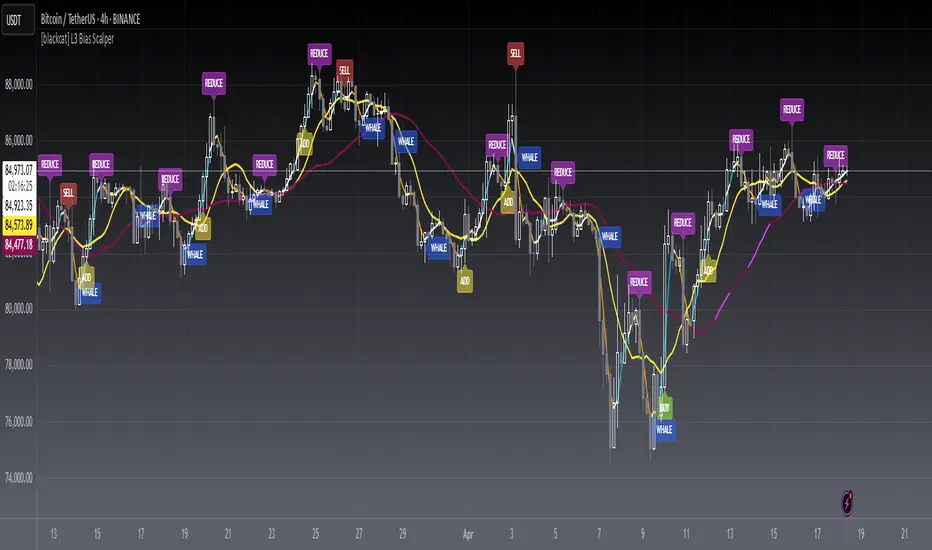
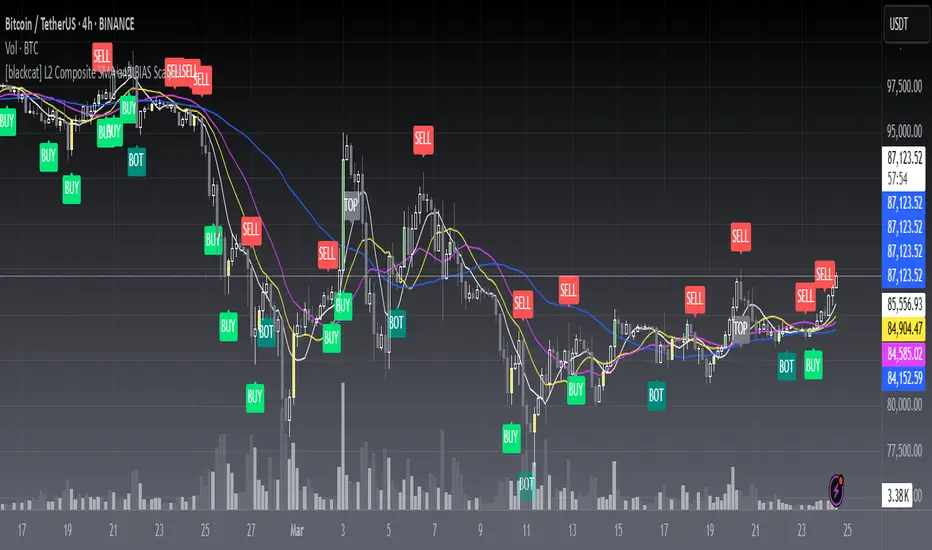
[blackcat] L3 Bias ScalperLevel: 3
Background
Bias alone is a powerful tool for trading. I use SMA3, SMA10, SMA20, SMA30 to cover short and middle term of the trend for scalping. Multiple biases can be introduced for long and short entries.
Function
Use SMAs and biases for scalping with whale move alert (banker fund flow detection)
Key Signal
buy --> entry signal for long
strongbuy --> entry signal for long
add --> buy more or re-entry signal for long
reduce --> partial exit for long
exit --> complete exit for long
sell --> short entry signal
whalemove --> banker fund move detection
Pros and Cons
This script provides entry signal together with whale detection by bias algorithms, you can use whale move to predict next move of trend in large time frame. However, trading signal should be further filtered out for more precise entry signal.
Remarks
At beginning, I want to make it simple and it looks very complex at the end...
Readme
In real life, I am a prolific inventor. I have successfully applied for more than 60 international and regional patents in the past 12 years. But in the past two years or so, I have tried to transfer my creativity to the development of trading strategies. Tradingview is the ideal platform for me. I am selecting and contributing some of the hundreds of scripts to publish in Tradingview community. Welcome everyone to interact with me to discuss these interesting pine scripts.
The scripts posted are categorized into 5 levels according to my efforts or manhours put into these works.
Level 1 : interesting script snippets or distinctive improvement from classic indicators or strategy. Level 1 scripts can usually appear in more complex indicators as a function module or element.
Level 2 : composite indicator/strategy. By selecting or combining several independent or dependent functions or sub indicators in proper way, the composite script exhibits a resonance phenomenon which can filter out noise or fake trading signal to enhance trading confidence level.
Level 3 : comprehensive indicator/strategy. They are simple trading systems based on my strategies. They are commonly containing several or all of entry signal, close signal, stop loss, take profit, re-entry, risk management, and position sizing techniques. Even some interesting fundamental and mass psychological aspects are incorporated.
Level 4 : script snippets or functions that do not disclose source code. Interesting element that can reveal market laws and work as raw material for indicators and strategies. If you find Level 1~2 scripts are helpful, Level 4 is a private version that took me far more efforts to develop.
Level 5 : indicator/strategy that do not disclose source code. private version of Level 3 script with my accumulated script processing skills or a large number of custom functions. I had a private function library built in past two years. Level 5 scripts use many of them to achieve private trading strategy.
[blackcat] L2 Composite SMA and BIAS ScalperLevel: 2
Background
A simple moving average (SMA) calculates the average of a selected price range, usually closing prices, based on the number of periods in that range. A simple moving average is a technical indicator that can be used to determine whether an asset price is holding a bull, a bear, or is reversing.
The bias shows the moving average rate of deviation. Also known as the rate of deviation, or y-value for short, is an indicator that reflects the degree of deviation between the price and the SMA over a given period by calculating the percentage difference between the market index or the closing price and a moving average to allow for receive that the price reverses or recovers due to a deviation from the moving average trend with strong fluctuations and the price moves within the normal fluctuation range Build credibility to continue the original potential.
Function
L2 Composite SMA and BIAS Scalper is mainly based on a cluster of simple moving averages and their bias values to produce long and short entry points. Three different strategy to generate long and short entries are demostrated together. That is why this is called "Composite".
Key Signal
botsig --> indicating bottom zone
topsig --> indicating top zone
buysigI --> long entry type I
buysigII --> long entry type II
buysigIII --> long entry type III
selsigI --> short entry type I
selsigII --> short entry type II
selsigIII --> short entry type III
Pros and Cons
Pros:
1. common sma(), rsi() and bias() are utizlied to generate exact long and short entries
2. alerts for bottom and top zones
Cons:
1. SMA parameters may need optimization for specific trading pairs
2. No stop loss or take profit scheme is introduced.
Remarks
This is promising but need efforts to refine it.
Readme
In real life, I am a prolific inventor. I have successfully applied for more than 60 international and regional patents in the past 12 years. But in the past two years or so, I have tried to transfer my creativity to the development of trading strategies. Tradingview is the ideal platform for me. I am selecting and contributing some of the hundreds of scripts to publish in Tradingview community. Welcome everyone to interact with me to discuss these interesting pine scripts.
The scripts posted are categorized into 5 levels according to my efforts or manhours put into these works.
Level 1 : interesting script snippets or distinctive improvement from classic indicators or strategy. Level 1 scripts can usually appear in more complex indicators as a function module or element.
Level 2 : composite indicator/strategy. By selecting or combining several independent or dependent functions or sub indicators in proper way, the composite script exhibits a resonance phenomenon which can filter out noise or fake trading signal to enhance trading confidence level.
Level 3 : comprehensive indicator/strategy. They are simple trading systems based on my strategies. They are commonly containing several or all of entry signal, close signal, stop loss, take profit, re-entry, risk management, and position sizing techniques. Even some interesting fundamental and mass psychological aspects are incorporated.
Level 4 : script snippets or functions that do not disclose source code. Interesting element that can reveal market laws and work as raw material for indicators and strategies. If you find Level 1~2 scripts are helpful, Level 4 is a private version that took me far more efforts to develop.
Level 5 : indicator/strategy that do not disclose source code. private version of Level 3 script with my accumulated script processing skills or a large number of custom functions. I had a private function library built in past two years. Level 5 scripts use many of them to achieve private trading strategy.
Trends & RangesTrends & Ranges uses EMA ATR bands as a SuperTrend indicator.
How to use:
This indicator can be used to give you a direction bias, with the added function to create ranges which often lead to reversals or flat trading periods. Trade the break-out or wait for pull backs in the direction of the trend.
I'm not great at explaining stuff and will probably make things only more complicated, so I won't bother for now,
but if you have a question on how the script works I will gladly give it a try.
The option "Flexible Trends" will disable the min/max function (trailing or non trailing).
Flexible Trends enabled:
Flexible Trends disabled:
Settings are not optimized for any asset or time frame, you will have to do that for yourself. Feel free to share them in the comments.
Thanks for showing interest, enjoy and good luck! :)

Separated Moving Average [2] - evoThis is an updated version on one of my previous scripts. Small explanation in the description.
This new script gives you a direction bias based on closing above and below the lines, with an option to filter fake signals by waiting for one more candle close.
Also added more moving averages compared to the first script (built ins + donchian)
Hope you like it!
(If you're a coder with a slightly larger brain than me, please tell me in the comments if I fixed the repainting problem correctly, I'm not 100% sure..)

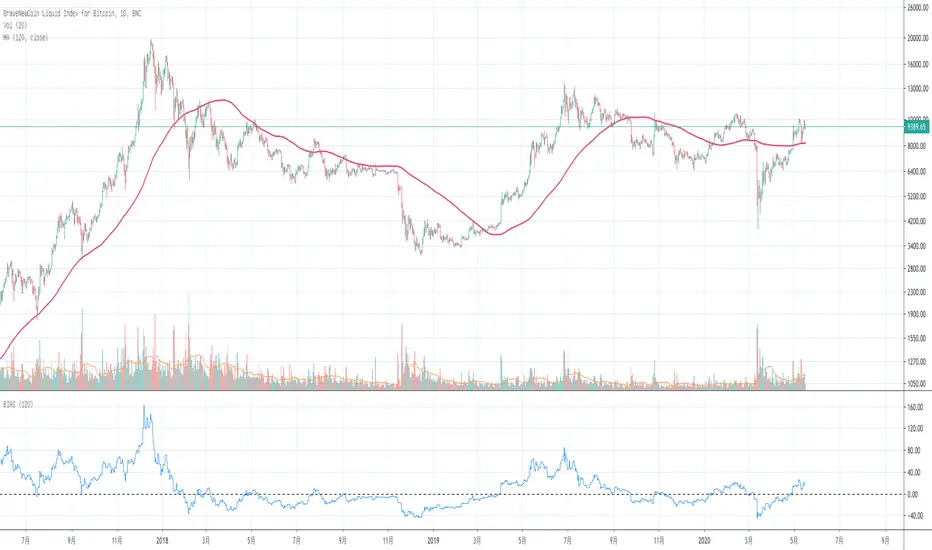
Basic BIASBasic BIAS
Deviation rate (bias), also known as deviation rate, or y-value for short, is an indicator to reflect the deviation degree between the price and MA in a certain period of time by calculating the percentage difference between the market index or closing price and a moving average, so as to obtain the possibility that the price will reverse or rebound due to deviation from moving average trend in case of severe fluctuation, and that the price will move within the normal fluctuation range Form the credibility of continuing the original potential.
The deviation rate is a percentage of the deviation degree (gap rate) between the price and ma.
The departure rate curve (bias) is a curve that connects the values of each bias into a line and obtains a wave extension curve with the value of 0 as the horizontal axis.
[LunaOwl] Moving average Bias Ratio作品: 均線乖離率 (Moving average Bias Ratio)
The concept of Moving average Bias Ratio is according to the difference between the long/short-term MA changes, determine the direction of buy or sell. Long if the short-term MAs is above the long-term MAs; Conversely, if the short-term MAs is below the long-term MAs, it is not held.
均線乖離率的概念,是根據長短期均線變化之間的乖離來確定多空方向。如果短期高於長期,則買進;相反的~如果短期低於長期,則空手。
Using the deviation rate alone will have the disadvantage of unclear signals, which can only explain the increased chance of market reversal. It needs to cooperate with the rule of thumb and other analytical tools.
單獨使用乖離率會有信號不明確的缺點,只能解釋市場發生反轉的機會增加,需要配合經驗法則和其他分析工具。
--------------------------*
Formula - 公式
Avg. BIAS = ( MA(short) - MA(long) ) ÷ MA(long) × 100 %
均線乖離率 =(短期平均-長期平均) ÷ 長期平均 × 100 %
--------------------------*
The greater the distance between the two moving averages, the greater the Bias Ratio.

Zahorchak MeasureCreator: Michael G. Zahorchak.
References:
The Art of Low Risk Investing by Michael G. Zahorchak, 1977. Unfortunately, it's all but impossible to find a copy these days.
The Complete Guide to Market Breadth Indicators by Gregory L. Morris, 2006. A fantastic resource for those interested in Technical Analysis or creating their own trend based system.
Two articles by Greg Morris on the Zahorchak Measure. I can't link to them under the House Rules, but they are easily searchable.
The Zahorchak Measure (ZM) is designed to give you a market bias (either uptrend or downtrend) which you can use to determine a trade bias for ETF's or stocks.
ZM works by taking multiple moving averages of the NYSE Composite, a moving average of the NYSE advance decline line, and examining the relationship between those elements. Broadly, the market is considered to be in a uptrend when ZM is above zero, and a downtrend when below. However, there are many ways to interpret the indicator.
The version created by Greg Morris is more akin to a binary indicator in that ZM jumps from number to number. This version is smoothed to create an oscillator as it reduces whipsaws (at the expense of lag). You can set the EMA Length to 1 to go back to the original.
Some notes:
Michael Zahorchak called it the "Zahorchak Method", whereas Greg Morris uses the term "Measure". I'm not totally clear on the change, but Mr. Morris made some changes (covered below), so that may explain the altered name.
The original indicator used moving averages of 5, 15, and 40 weeks. I have converted these to daily numbers as that's the time frame I most commonly trade. You can convert the numbers back by dividing by 5.
The original indicator used the Dow Industrials for the moving averages, however Greg Morris switched to the NYSE Composite due to the advance decline line being based on the NYSE.
Greg Morris removed the 5 period moving average of the NYSE Composite, as it created increased volatility at market tops and bottoms. I tested ZM with the 5 period MA added back in, and I believe removing it creates a superior indicator.
I've added both Multi Time Frame functionality, and the ability to alter moving average lengths. Play around and see what you can come up with.
ZM oscillates between -10 and +10. There are some interesting levels creating between these two numbers (apart from the obvious zero level) - see what you can come up with.
All credit goes to Michael Zahorchak and Greg Morris for the indicator creation. I have simply reproduced their work for the TradingView community as this great indicator wasn't available.
Any queries let me know in the comments or PM me.
DD.

Bias And Sentiment Strength (BASS) Indicator by mattzabBias And Sentiment Strength (BASS) Indicator is designed to be a quick visualization as to the market strength.
Pair with Alligator, MACD, or Moving Average lines on your chart for good results.
How to use this indicator:
Blue above 0 is positive sentiment, red below 0 is negative sentiment.
If you have blue above and red below, be cautious! The Bass is telling you that we have a battle between the Bulls and the Bears!
The purple bars are your volume bias. Volume bias can be positive or negative, despite the direction of the overall trend. Positive Volume Bias along with Bullish Blue Sentiment is a great sign! Go Long! If you have Bullish Sentiment and have a negative Volume Bias, be cautious! Price may not be moving with much conviction, and may be subject to reversal!
This is basically several different histograms overlaying one another, and they are blue above 0 and red below 0.
MACD Histogram - Standard MACD Histogram here.
RSI Histogram - This is a standard RSI. It has been adjusted to "oscillate" above and below zero, which would be the 50 line on a normal RSI chart.
Slow Stochastic Histogram - This is a slow stochastic with a 21 Period K, 14 Period D, and 14 Smoothing K. The "oscillator" histogram is formed by subtracting K from D.
Awesome Oscillator - This is a standard Awesome Oscillator
Alligator Oscillator - This is formed by adding (lips + teeth) + (teeth - jaw)
Volume Bias - The Volume Bias is displayed as purple bars, and is calculated by a highly sophisticated and complex algorithmic function called subtraction. It's just the 30 Period Volume-Weighted Moving Average Minus the 30 Simple Moving Average.
Enjoy!

Fancy Moving Average [BigBitsIO]This script is for a single moving average with as many features as I can possibly fit into a single moving average. If you can think of more, or have questions regarding this script, please message me or contact me via social media.
Features:
- A single moving average (MA).
- Standard MA inputs.
- MA type.
- MA period.
- MA price.
- MA resolution (time frame).
- Visibility toggle.
- Fancy MA inputs.
- Toggle to show only candles included in the MA calculation ("Highlight inclusion") or display entire MA history.
- Toggle to show a ghost trail when Highlight inclusion is toggled on. Displays a shaded version of past MA history before the inclusion period (as seen on snapshot).
- Toggle to show forecast values for the MA.
- Other inputs related to forecasting:
- Forecast bias. (Neutral forecasts MA if the current price remains the same.)
- Forecast period.
- Forecast magnitude.
*** DISCLAIMER: For educational and entertainment purposes only. Nothing in this content should be interpreted as financial advice or a recommendation to buy or sell any sort of security or investment including all types of crypto. DYOR, TYOB. ***

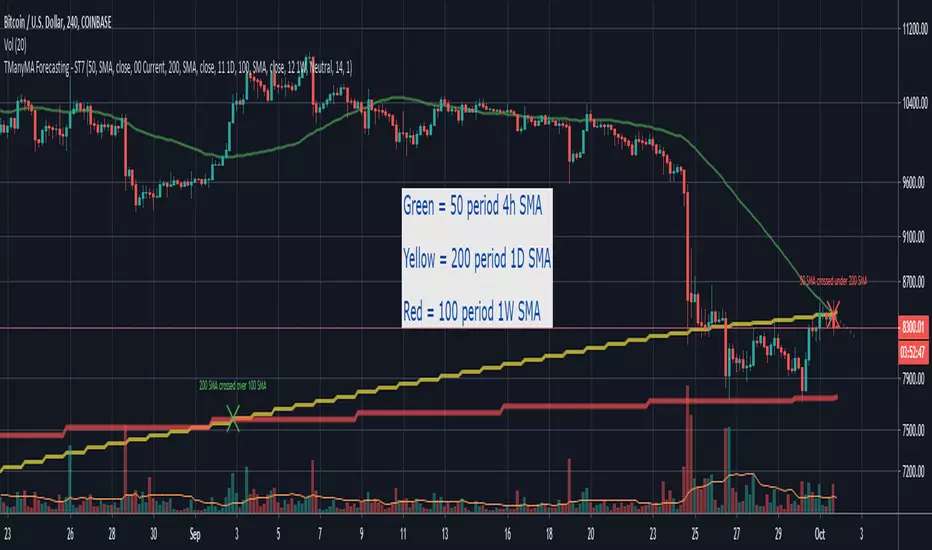
Scripting Tutorial 7 - Triple Many Moving Averages ResolutionsThis script is for a triple moving average indicator where the user can select from different types of moving averages, price sources, lookback periods and resolutions.
Features:
- 3 Moving Averages with variable MA types, periods, price sources, resolutions and the ability to disable each individually
- Crossovers are plotted on the chart with detailed information regarding the crossover (Ex: 50 SMA crossed over 200 SMA )
- Forecasting available for all three MAs. MA values are forecasted 5 values out and plotted as if a continuation to the MA.
- Forecast bias also applies to all forecasting. Bias means we can forecast based on an anticipated bullish, bearish or neutral direction in the market.
- To understand bias, please read the source code, or if you can't read the code just send me a message on here or Twitter. Twitter should be linked to my profile.
This script is meant as an educational script with well-formatted styling, and references for specific functions.
Scripting Tutorial 6 - Triple Many Moving Averages ForecastingThis script is for a triple moving average indicator where the user can select from different types of moving averages, price sources and lookback periods.
Features:
- 3 Moving Averages with variable MA types, periods, price sources and ability to disable each individually
- Crossovers are plotted on the chart with detailed information regarding the crossover (Ex: 50 SMA crossed over 200 SMA )
- Forecasting available for all three MAs. MA values are forecasted 5 values out and plotted as if a continuation to the MA.
- Forecast bias also applies to all forecasting. Bias means we can forecast based on an anticipated bullish, bearish or neutral direction in the market.
- To understand bias, please read the source code, or if you can't read the code just send me a message on here or Twitter. Twitter should be linked on my profile.
This script is meant as an educational script with well-formatted styling, and references for specific functions.

Institutional BiasShows what we at TRI call the institutional bias, i.e. a bull bias when 9 ema is above 18 ema and a bear bias when the 9 ema is below the 18 ema.
Plots the 9 and 18 ema, and fills the background green when the institutional bias is bullish and red when it is bearish.
