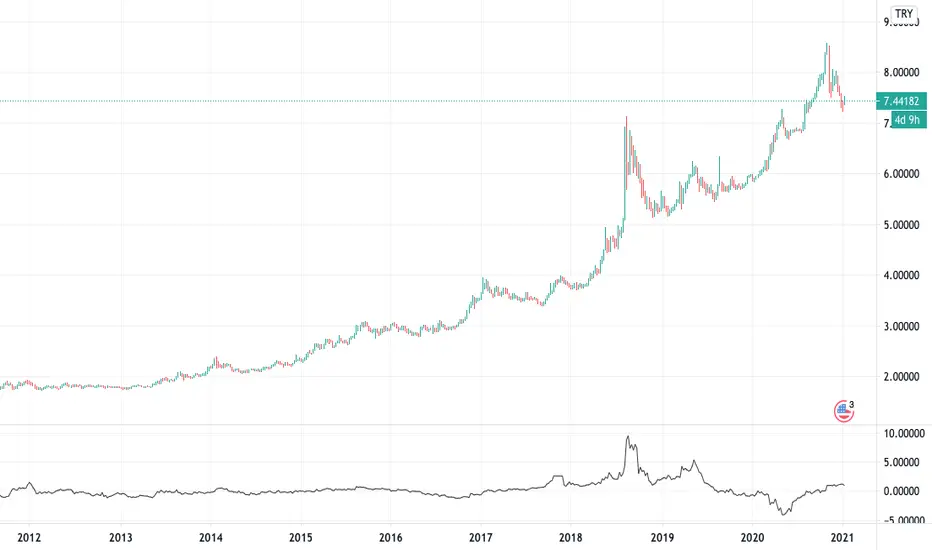
ALTINS1 Darphane Altin Sertifikasi Fair Value Tracker [ALPAY.B]This indicator displays the fair value of the Darphane Gold Certificate (ALTINS1) traded on Borsa Istanbul.
It calculates the theoretical price based on 0.01 grams of Spot Gold (XAU/USD) converted to Turkish Lira (USD/TRY). This tool is essential for investors to monitor whether the certificate is trading at a significant premium or discount compared to its intrinsic gold value.
Key Features:
Real-time Fair Value calculation.
Live Premium/Discount percentage tracking.
Visual background warnings for overvalued conditions.
BIST

VIOP Scalping - OriginalVIOP Scalping – Original is a rule-based scalping strategy ported from an original C# logic set. It aims to trade only when trend direction, momentum, and trend strength align, then manages the position using fixed take-profit/stop-loss percentages with an optional trailing mechanism to protect gains during favorable moves.
This strategy is provided for educational and backtesting purposes only. It is not financial advice and does not guarantee profitability. Always test thoroughly before any live usage.
Core Concept
Follow the dominant WMA trend, confirm momentum with EMA separation, filter conditions with RSI + ADX, then exit using fixed TP/SL with trailing behavior after a defined profit threshold.
How the Strategy Works
Trend Direction is defined by WMA: above WMA = long bias, below WMA = short bias.
Momentum is measured via Fast EMA vs Slow EMA and the EMA difference.
Trend Strength is confirmed using ADX (must exceed a threshold).
RSI filters trades to avoid entering when momentum is likely overextended or weak.
A no-trade session blocks entries during a predefined time window (default 09:30–10:05).
Exit logic uses fixed percent TP/SL, with an optional trailing mechanism that activates after a profit threshold.
Inputs and Settings
Trend and Indicator Settings
Main Trend WMA: Determines directional bias (price above = long, price below = short).
Fast EMA / Slow EMA: Used to measure momentum and directional separation.
RSI Period: Filters entries based on RSI range constraints.
ADX Period: Measures trend strength (must exceed threshold to allow entries).
Threshold Settings
EMA Difference Threshold: Minimum EMA separation required to validate momentum.
ADX Threshold: Minimum ADX required to confirm trend strength.
RSI Long Ceiling: RSI must remain below this value for long entries.
RSI Short Floor: RSI must remain above this value for short entries.
Risk Management Settings
Take Profit %: Default TP distance in percent.
Strong Trend Take Profit %: Higher TP used when a “strong trend” condition is detected.
Stop Loss %: Fixed SL distance in percent.
Trailing Activation %: Profit threshold at which trailing starts.
Trailing Distance %: Trailing offset distance used once trailing is active.
Time Filter
No-Trade Hours: Default session is 09:30–10:05. During this window, the strategy does not open new trades.
Entry Logic
No-Trade Time Filter
If the current bar falls inside the no-trade session, entries are blocked.
Long Entry Conditions
Price is above the WMA trend line.
EMA difference is positive and greater than the EMA Difference Threshold.
EMA momentum is increasing (current EMA diff > previous EMA diff).
RSI is within the defined range (RSI > 48 and RSI < RSI Long Ceiling).
Close is higher than the previous close.
ADX is above the ADX Threshold.
Short Entry Conditions
Price is below the WMA trend line.
EMA difference is negative and lower than -EMA Difference Threshold.
Bearish momentum is increasing (current EMA diff < previous EMA diff).
RSI is within the defined range (RSI < 52 and RSI > RSI Short Floor).
Close is lower than the previous close.
ADX is above the ADX Threshold.
Strong Trend Logic (Dynamic TP Selection)
If price is far from the WMA (absolute distance > 20 points) AND EMA separation is strong (absolute EMA diff > 1.5 points), the strategy treats the environment as a strong trend.
In strong trend mode, the strategy uses “Strong Trend Take Profit %” instead of the default “Take Profit %”.
Exit Management (TP/SL + Trailing)
The strategy uses fixed percentage-based TP and SL levels.
Trailing logic is enabled via strategy.exit and activates only after price moves in profit by the defined Trailing Activation %.
Once activated, trailing follows price using the defined Trailing Distance % offset.
This is designed to secure partial gains during extended moves while still allowing room for continuation.
What You See on the Chart
WMA Trend Line (Main Trend Filter).
Fast EMA and Slow EMA (Momentum Confirmation).
Strategy entry/exit markers generated by TradingView.
Recommended Use
Scalping systems that rely on trend-following and momentum confirmation.
Markets where ADX filtering helps avoid choppy conditions.
Traders who want a simple, parameter-driven TP/SL system with trailing after confirmation.
Important Notes
The no-trade session depends on your chart/session settings. Ensure your symbol/session configuration matches your intended market hours.
Percent-based exits scale with price; results will vary across instruments and volatility regimes.
Always validate behavior using bar replay, forward testing, and realistic commission/slippage assumptions.

VIOP Scalping - ATR SNIPERVIOP Scalping – ATR SNIPER is a momentum-based scalping strategy designed to capture short, high-probability moves while keeping risk strictly defined using ATR-based stop-loss and fixed risk/reward targets. The strategy trades only when trend direction, momentum, and strength are aligned.
This script is provided for educational and testing purposes only. It does not guarantee profitability and must be used with proper risk management.
Core Idea
Trade in the direction of the dominant trend, confirm momentum acceleration, and manage risk using ATR-based dynamic stops and targets.
How the Strategy Works
The main trend is defined using a Weighted Moving Average (WMA).
Momentum is measured by the distance and direction between a fast EMA and a slow EMA.
Trend strength is confirmed using ADX.
RSI is used as a filter to avoid weak or overextended market conditions.
Entries are blocked during a predefined no-trade time window to avoid high-noise periods.
Long Entry Conditions
Fast EMA is above Slow EMA and the EMA difference is greater than the minimum threshold.
EMA momentum is increasing compared to the previous bar.
RSI is within the user-defined long range.
Current close is higher than the previous close.
ADX is above the minimum strength threshold.
Price is above the WMA trend line.
The current bar is not inside the no-trade session.
Short Entry Conditions
Fast EMA is below Slow EMA and the EMA difference is below the negative threshold.
Bearish EMA momentum is increasing.
RSI is within the user-defined short range.
Current close is lower than the previous close.
ADX is above the minimum strength threshold.
Price is below the WMA trend line.
The current bar is not inside the no-trade session.
Risk Management – ATR Sniper Logic
Stop-loss distance is calculated as ATR multiplied by the ATR Multiplier.
Take-profit distance is calculated using the defined Risk/Reward ratio.
Stop-loss and take-profit levels are dynamically calculated per trade.
Only one position can be open at any given time.
What You See on the Chart
Weighted Moving Average (WMA) trend line.
Fast EMA and Slow EMA lines.
Dynamic stop-loss line during active trades.
Dynamic take-profit line during active trades.
Recommended Use
Intraday scalping on VİOP instruments.
Momentum-based short-term trading.
Traders who prefer rule-based systems with strict risk control.
Always backtest and forward-test on your own instruments and timeframes before using this strategy in live markets.

Turkey Yield Curve SpreadYield spreads are used to see investors' perception of future risk and predict a recession. The spread is the value obtained by subtracting the near term bond from the distant one. This indicator plots this value historically. I used 3-year and 10-year Turkey treasury bond yields instead of 2-year and 10-year Turkey treasury bond yields due to lack of historical data on Tradingview.
Borsa İstanbul Correlation Analysis&Center of Gravity IndicatorFormula Used :
COG = SUM of closing prices Pn x (n+1) / Sum of closing prices Pn
