hamster-bot HD preset_2presets for users
// DESCRIPTION OF STRATEGY ver. 2
HiDeep Strategy
Author foresterufa
This is a counter-trend strategy that is gradually gaining a position against the trend at the best price.
A prerequisite for completing a position is the price exit from the internal channel on the chart and the appearance of the HiDeep indicator.
The condition for closing the position is touching the opposite side of the internal channel.
A condition for facilitating closure along the middle line of the channel, with high price volatility , is that the price touches the border of the external channel.
Input signals are generated by HiDeep indicators. Closing a position by moving averages.
Bitmex

Noro's ZZ-6 by hamster-botThe original script is available here
New version of ZZ-strategy.
Repaint?
Normal lines are not redrawn. Dotted lines repaint, but do not affect trading (do not affect backtests). You can turn off repaint in the script settings. Repaint (dotted lines) are needed only for clarity. To make it clear from which bar the level is created.
Levels
Lime lines above - level from a local high bar. To open a long position. Using a market stop order.
Red line at the bottom - the level from a local low bar. To open a short position. Using a market stop order.
Trading
You can trade without short positions. Then the red line is the level for a stop-loss order.
Reverse trading can be used. Without stop-loss orders.
Risk size
Order size depends on the risk size parameter and possible loss. If risk size = 2%, it means that the loss will be no more than 2%.
For crypto
Symbols: XBT/USD, BTC /USD, BTC /USDT, ETH/USD, etc - need USD(T)
Timeframes: 1h, 4h, 1d
The script will continue to be developed by the Hamster Bot team

Channel Break [for free bot]I present to you a script for testing the channel breakout strategy for the Bitmex exchange.
Cryptocurrency itself is a trending tool, which is why breakout strategies generate the largest profits, and the channel breakout strategy is one of the most effective trend strategies.
The optimization result shows the result of trading on a volume of 20% of the deposit. But since Bitmex trades in futures contracts, you can use 50%, 100% and even much more, depending on your attitude to risk.
At the time of publication on the Bitmex exchange there are 12 different contracts, i.e. You can diversify your trading well (by pre-optimizing the settings for each contract).
In the script, you can set up many trading options - timeframe, periods for buying and selling, method of exiting a trade, stop loss, take profit, risk management, etc.
Thus, you create a strategy "for yourself".
Представляю Вам скрипт для тестирования стратегии пробоя канала для биржи Битмекс.
Криптовалюта, сама по себе является трендовым инструментом, именно поэтому, пробойные стратегии генерируют самую большую прибыль, а стратегия пробоя канала – является одной из самых эффективных трендовых стратегий.
На результате оптимизации показан результат торговли на объеме в 20% от депозита. Но так как на Битмекс торговля идет фьючерсными контрактами, Вы можете использовать 50%, 100% и даже намного больше, в зависимости от Вашего отношения к риску.
На момент публикации на бирже Битмекс есть 12 разных контрактов, т.е. Вы можете хороши диверсифицировать свою торговлю (предварительно оптимизируя настройки по каждый контракт).
В скрипте Вы можете настроить множество вариантов торговли - таймфрейм, периоды для покупки и продажи, метод выхода из сделки, стоп-лосс, тейк-профит, рискменеджмент и т.п.
Таким образом Вы создаете стратегию "под себя".

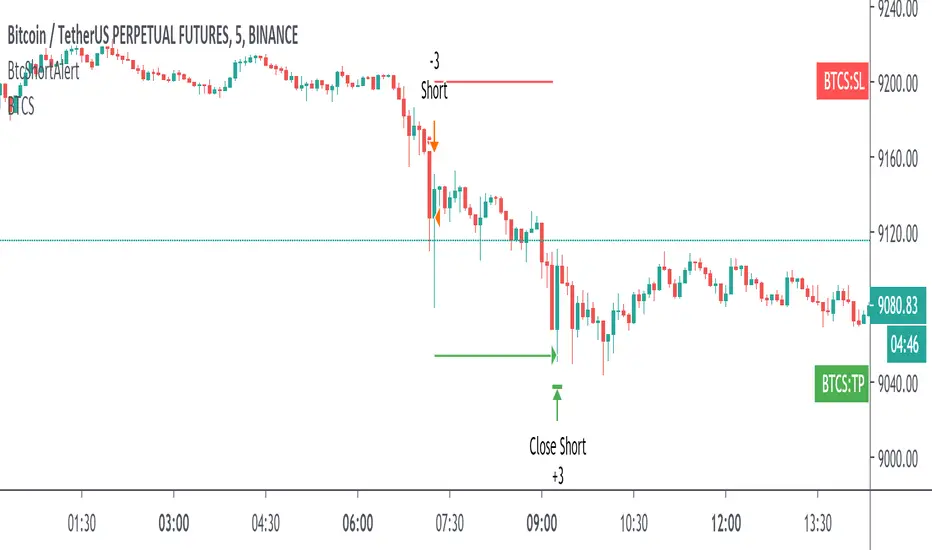
Btc Short StrategyBINANCE:BTCUSDTPERP
Developed for the btc perpetual future contract on Binance Futures .
How to Use:
It's based on a complex strategy for short positions that involves volume analysis, trend analysis, moving averages, supports and resistances and more.
Concretely this indicator opens a short position when there is a bearish trend and a breakout of a support zone and uses fear and volatility to take an edge on the market.
It runs on the 5 min chart for the entry , and it analyses higher timeframes.
It opens and close sell positions and automatically draws SL and TP. The R/R is 1:1.
It's possible to enable alerts of the strategy in order to be notified whenever the indicator opens or closes a position . You can use it in addiction of your strategy or for educational purposes .
(This indicator will be updated when/if there will be a change in the bias of the market)
Access must be given by me to test this. Once access given you can test.
PM me or use the links below to obtain access to this indicator.
Backtesting Results:
Initial Capital= 10000
Order Size= 3 contracts (max loss 2.15% of the capital)
Commission= 0.075% (same of VIP0 of binance)
Slippage=10 ticks
Reviews and Feedback are welcome.
Refer the Release notes for any updates and my posts below and in my idea page for more details.
Report any issues or ideas to me, I'll fix them !
Thank you !
DISCLAIMER:
All trading involves high risk: past performance is not necessarily indicative of future results. Hypothetical or simulated performance results have certain inherent limitations. Unlike an actual performance record, simulated results do not represent actual trading. Also, since the trades have not actually been executed, the results may have under- or over-compensated for the impact , if any, of certain market factors, such as lack of liquidity. Simulated trading programs in general are also subject to the fact that they are designed with the benefit of hindsight. No representation is being made that any account will or is likely to achieve profits or losses similar to those shown.
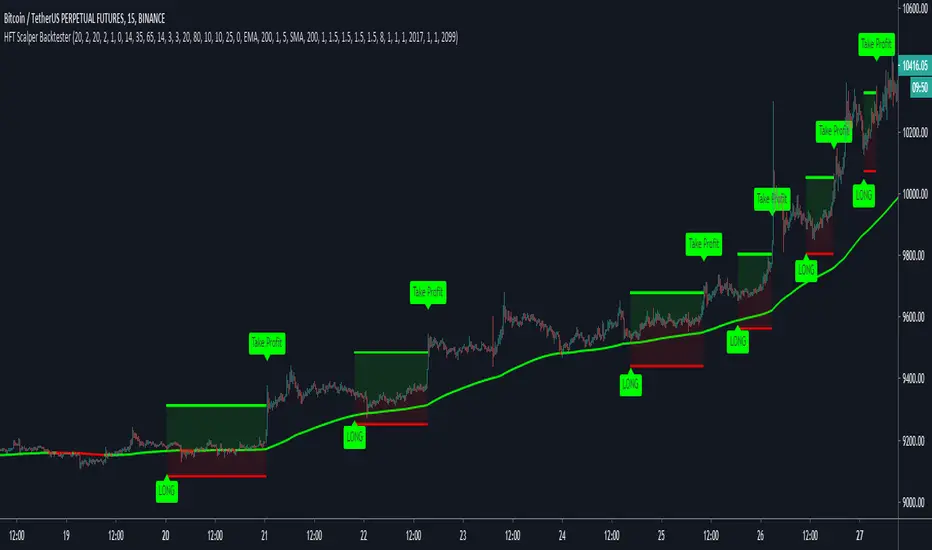
HFT Scalper BacktesterThis strategy is a scalper strategy developed by HFT Research. Scalper is highly customizable and provides endless opportunities to find profitable setups in the market.
Use Bollinger Bands
This piece of the settings will turn and off Bollinger band’s input in the decision making. BB Length will determine the Moving average you are using to take the standard deviation off of which is named as BB Multiplier. Default settings will use 20 moving average and take standard deviation of 2 to create lower and upper bands. Increasing the Multiplier will give you fewer but safer entries.
Use Bollinger Bands %
This setting will allow the user to determine at what Bollinger band width %, he wants to take start looking to take trades. It is known that when prices are stable and moving sideways, Bollinger bands contract and it becomes more reactive to small moves in the market. Using this setting, you can ignore the signals that would be generated while Bollinger bands are contracted. This setting will allow the user to weed out the noise in the market and really allow them to make the most out of Bollinger bands .
Use RSI
You can also turn on and off the RSI as well. Alternatively, there is an option to use RSI on a different time frame than you are currently on. For example, if you are looking at the 5min chart to use Bollinger bands but you would like to look at the RSI value on the 15min chart. You can do so by selecting the custom RSI timeframe as well as adjusting the Oversold and Overbought value.
Use STOCH
For those who want extra protection on their entry can throw STOCH into their decision making. STOCH acts like RSI but it is more prone to small moves. It will help the users to get a better entry if used correctly. Stoch may not be in the buy zone when RSI is at say 35, however, if price dips a little more and STOCH might be in the buy zone when RSI is at say 20. This way it will help you have better entries than just using RSI . In a way, you can use STOCH to scalp RSI .
Use VWAP
VWAP stands for volume weighted average price . It is an extremely useful indicator when trading intra-day. It does reset every trading session which is at 00:00 UTC . Instead of looking at x number of candles and providing an average price, it will take into consideration volume that’s traded at a certain price and weigh it accordingly.
Use ADX
ADX stands for average directional index . It is an indicator that measures volatility in the market. Unfortunately, the worst market condition for this strategy is sideways market. ADX becomes a useful tool since it can detect trend. If the volatility is low and there is no real price movement, ADX will pick that up and will not let you get in trades during a sideways market. It will allow you to enter trades only when the market is trending.
Use MA Filters
Lookback: It is an option to look back x number of candles to validate the price crossing. If the market is choppy and the price keeps crossing up and down the moving average you have chosen, it will generate a lot of “noisy” signals. This option allows you to confirm the cross by selecting how many candles the price needs to stay above or below the moving average. Setting it 0 will turn it off.
MA Filter Type: There is a selection of moving averages that is available on TradingView currently. You can choose from 14 different moving average types to detect the trend as accurate as possible.
Filter Length: You can select the length of your moving average. Most commonly used length being 50,100 and 200.
Filter Type: This is our propriety smoothing method in order to make the moving averages lag less and influence the way they are calculated slightly. Type 1 being the normal calculation and type 2 being the secret sauce .
Reverse MA Filter: This option allows you to use the moving average in reverse. For example, the strategy will go long when the price is above the moving average. However, if you use the reserve MA Filter, you will go short when the price is above the moving average. This method works best in sideways market where price usually retraces back to the moving average. So in an anticipation of price reverting back to the moving average, it is a useful piece of option to use during sideway markets which is the worst market condition for scalper.
Please visit our website for more information
Quickie (Free) BacktesterQuickie is a free tradingview Indicator developed by HFT Research. It works in sideways and trending markets depending the way you set it as well as both on short time frame and long time frame. It comes with backtesting abilities on tradingview.
BITMEX:XBTUSD
Use Bollinger Bands
This piece of the settings will turn and off Bollinger band’s input in the decision making. BB Length will determine the Moving average you are using to take the standard deviation off of which is named as BB Multiplier. Default settings will use 20 moving average and take standard deviation of 2 to create lower and upper bands. Increasing the Multiplier will give you fewer but safer entries
Use RSI
You can also turn on and off the RSI as well. Alternatively, there is an option to use RSI on a different time frame than you are currently on. For example, if you are looking at the 5min chart to use Bollinger bands but you would like to look at the RSI value on the 15min chart. You can do so by selecting the custom RSI timeframe as well as adjusting the Oversold and Overbought value.
Use MA Filter
Lookback: The indicator has an option to look back x number of candles to validate the price crossing. If the market is choppy and the price keeps crossing up and down the moving average you have chosen, it will generate a lot of “noisy” signals. This option allows you to confirm the cross by selecting how many candles the price needs to stay above or below the moving average. Setting it 0 will turn it off.
MA Filter Type: There is a selection of moving averages that is available on TradingView currently. You can choose from 14 different moving average types to detect the trend as accurate as possible.
Filter Length: You can select the length of your moving average. Most commonly used length being 50,100 and 200.
Filter Type: This is our propriety smoothing method in order to make the moving averages lag less and influence the way they are calculated slightly. Type 1 being the normal calculation and type 2 being the secret sauce.
Reverse MA Filter: This option allows you to use the moving average in reverse. For example, the strategy will go long when the price is above the moving average. However, if you use the reserve MA Filter, you will go short when the price is above the moving average. This method works best in sideways market where price usually retraces back to the moving average. So, in an anticipation of price reverting back to the moving average, it is a useful piece of option to use during sideway markets.
For more information please check out our website

VK trend scalper 30mThis strategy is designed to be used on the 30 minute time frame
In this strategy, I actually implemented my own scalping style into building the strategy. Having to replicate my own trading strategy into an algorithm, I can't make it exactly perfect to how I would trade, but what I can do is try and program the parameters that give it the absolute best chance of making a big move with a small drawdown- which replicates part of my trend trading style. Here I am using VWMA , EMA and trend filtering values to find trend change and best entries.
you can also try it on any cryptocurrency/forex/commodity/stocks
*This script is currently experimental you can try it if you want.

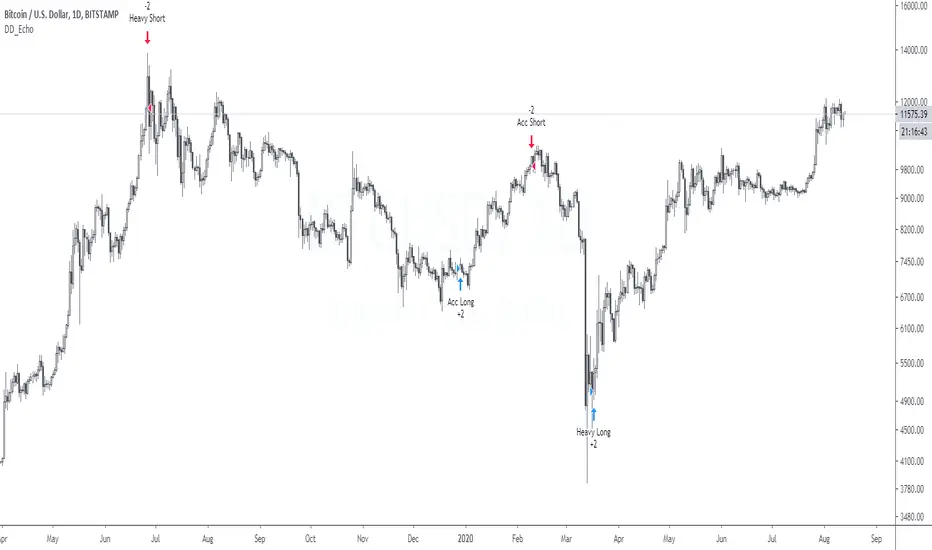
DD_EchoDD_Echo is a buy/sell trading strategy based on sentiment analysis such as fear and greed, Bitmex premium and quantity theory of money.
The performance metrics are as follows:
Net Profit: 412%
Sharpe Ratio: 1.27
Profit Ratio: 2.55
Hit Rate: 100%
If you want to access this, please DM me.
KundaliniThe Kundalini is a technical indicator. Based on algorithm calculations, this indicator extrapolates the previous price for the next bar. Plus addition Multi time frame ATR volatility Reading environment for higher conditions
Here is how Dominator is calculated:
1. The study estimates the price projected for the next bar. The estimated price is based on the algorithm method.
2. The study extrapolates this value to find a projected price change for the next bar.
The resulting extrapolated value is shown as a histogram on a lower subgraph. By default, sections of the histogram where the extrapolated value is increasing are shown in green; sections corresponding to the decreasing value are shown in red.
Note: Value projection is purely mathematical as all calculations are based on algorithm averaging of previous values.
Overlay True
The strategy includes 3 different adjustable levels for the ladder , plus automatic adjustable stop loss and takes profit calculated from your average entry price after each ladder adds.
Adjustable BAcktest Window.
1 long signals
3 ladder long add signals
1 short signals
3 ladder short add signals
1 dynamic stop calculated from your average entry price
1 dynamic take profit calculated from your average entry price
Please Private Msg me if you like more info about the script Full pdf available or if you need access to it
thx for your time and support
hamster-bot HiDeep strategy// DESCRIPTION OF STRATEGY
HiDeep Strategy
Author foresterufa
This is a counter-trending strategy that is gradually gaining a position against the trend at the best price.
A prerequisite for completing a position is the price exit from the internal channel on the chart and the appearance of the HiDeep indicator.
The condition for closing the position is touching the opposite side of the internal channel.
A condition for facilitating closure along the middle line of the channel, with high price volatility , is that the price touches the border of the external channel.
Input signals are generated by HiDeep indicators. Closing a position by moving averages.

Reticulata Enhanced - StrategyThis script is the backtesting for Reticulata Enhanced.
Building on our core script - Reticulata, the enhanced version features several requested extras to give you more flexibility with your trading style.
What is Reticulata Enhanced?
The Reticulata core leverages a blend of MA/RSI strategies mixed with the Bull Bear Bots optimised logic for risk management. This enhanced version takes it a step further with additional risk management features:
Trailing Stop
Fixed Stop
Fixed Stop, but move at TP
Trend confirmation
Usage
Using the indicator is as simple as:
1. Select the strategy, or combination of strategies you want to use
2. If desired, select one or more of the available trend filters
3. Adjust your stop options
4. Review backtest results
Markets
Like the core, the enhanced algo also supports a range of markets and timeframes, including the majors (EURUSD, etc...) in Forex and a variety of Cryptocurrencies including Bitcoin (BTC/XBT etc...).
All of our scripts are designed for manual traders but are ready to use with automated trading bots.

Ichimoku+P&F+Stoch+NoRange+HL+crossupThis is a highly advance trading strategy for high frequency trading on Bitmex, Binance Futures, ByBit and others. I'm using variations of this script to manage $500K institutional account! Forward tested results available for 1.5 years. This script uses combination of Ichimoku cloud on multi-timeframe. Uses Stochastic RSI indicator on multi-timeframe. Uses Point and Figure analysis. Used EMA crossup for longs
Currently looking for Beta Testers.
Instructions:
1. Each coin is unique so needs a lot of time to fine tune the parameters.
2. This parameters tuned only for Longs (inquire for Shorts)
3. This is only tuned for BTC but I have tuned parameters for all coins (inquire for help)
Settings:
1. Chart timeframe: 3
2. P&F timeframe: 1
3. Ichimoku timeframe: 15
5. Stochastic timeframe: 15
Current exchange integration: Bitmex, Binance Futures, Bybit... More will be added soon.

MONEY WORKERThe settings are only for bitfinex exchange btcusd.
Tested against a 5 minute time interval. The settings on it are for a 5 minute time frame.
Different settings may be required for different exchanges, parities and time periods.
Note that different parities and exchanges require new settings.
In non-pro free accounts, the profit results may differ as the time frame is deleted after a certain period of time.
Please note that you have to make different settings for different parities.
If you have questions and suggestions, you can send me a private message.
Note: I cannot recommend using Heikin ashi because this misleads you. It also includes a rule violation by house rules. And MOD PineCoders hides the strategy.

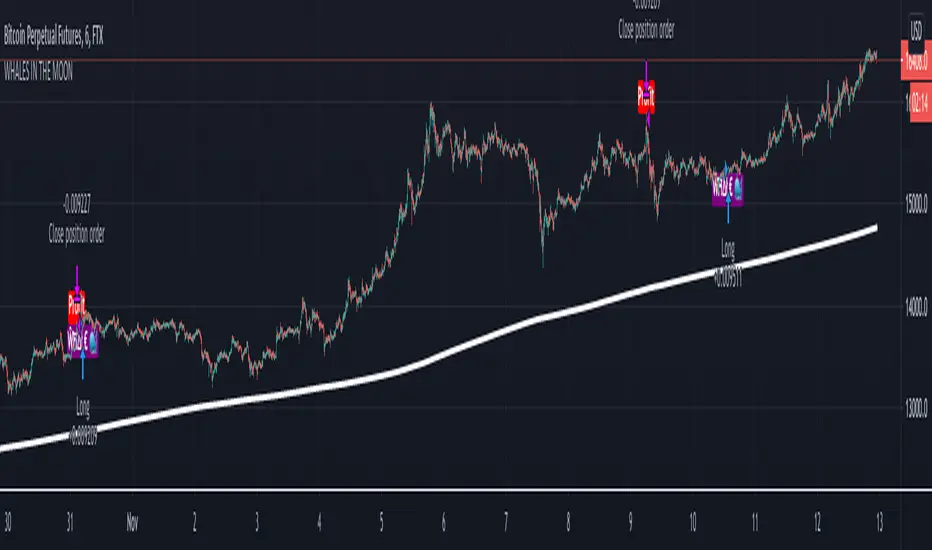
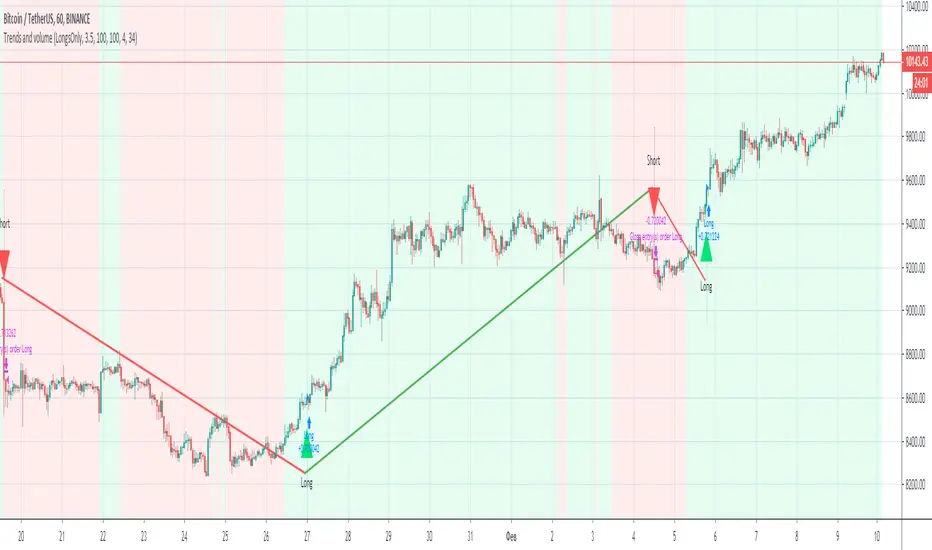
Trends and volume“Trends and volume” is a pair of ZigZag and Volume indicators. If in the ZigZag indicator a trend has changed from descending to ascending, and in the Volume indicator the volume of purchases (accumulation) exceeds the volume of sales (distribution), a signal to open a long position occurs.
Accordingly, the opening of a short position occurs with opposite indicators of trend and volume. The strategy has Volume smoothing settings and a ZigZag filter for selecting optimal settings on other instruments.
With default settings, the strategy allows you to make 2-4 successful trades per month, ideally shows the direction of the trades on the BINANCE:BTCUSDT , timeframe 1 hour.
Together with the “Trends and volume” backtest, you get the “Trends and volume alerts” indicator in which the alert function is built-in, you can set an alert for events: long entry and short entry.
Pay attention when you set alerts in the tradingview in the indicator, the true signal comes at the close of the hourly candle.
I can open demo access to the Trends and volume strategy for 15 days, for this write me.

[B] hamster-bot ZZ Breakout reversal strategyAttention! This is a beta version of the strategy script >> <<
A backtest should only be done if you understand how the options work. Otherwise, do a test in the release version

The 100% - Bitcoin BeatsHello, Hello, Hello,
And welcome back, to Bitcoin Beats.
This is a strategy & Indicator that's essentially supertrend. However, we have used machine learning and AI to determine the best parameters in order to never lose money.
Yes you read that correctly, this Algo has NEVER lost a trade. All trades have come through successfully based on % moves.
A 'Supertrend' indicator is one, which can give you precise buy or sell signal in a trending market. ... The buy and sell signals are generated when the indicator starts plotting either on top of the closing price or below the closing price.
This strategy finds the best exit point without ever having to take a loss. This means you can use Cross leverage if the risk management is good enough and not worry about your account getting REKT as the trade always comes through in the end.
Trade at your own risk.
Thanks you and Goodbye, From Bitcoin Beats.

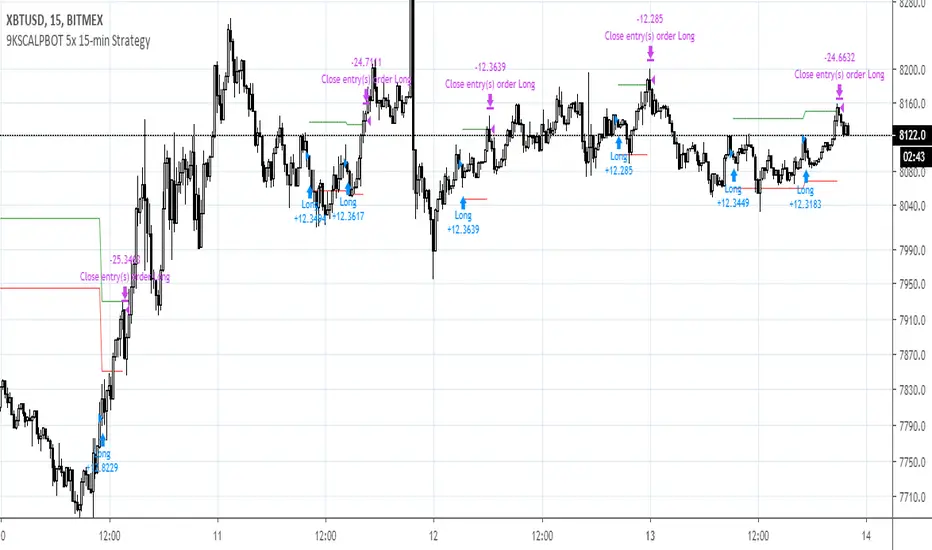
9KSCALPBOT 5x 15-min StrategyThis scalp bot uses low leverage to scalp small but high certainty movements on the 15-minute timeframe. Its amazing proprietary feature addresses the common problem of accumulated losses due to excessive stop-lossing -- this is done by assessing macro trends on higher timeframes when underwater, and then riding the position out until profitable again. You will get an average of about 1 entry and 1 exit per day.
The core logic uses a modified combination of CCI and Schaff Trend oscillators and a proprietary pattern recognition mechanic. Leverage should be kept low (5X or less) as the algorithm could temporarily go significantly underwater as well as pyramid (stack) same direction entries up to five times before closing. Any leverage higher than 5X significantly increases risk of liquidation. This bot has been consistently backtested for 10 months with about 75-85% win rate, 100%+ 3-month profitability, very low ~5% drawdown, all after factoring typical BitMex fees (0.06% after counting affiliate self-referral).
As with any automated strategy, it does not account for black swan events or disruptions in server connectivity (e.g., BitMex overload errors).
SuperFast M3 - STRATEGGYScript developed for automated trading (autoview).
Start of backtest: Jan 01 2020.
Way of acting:
SMA, EMA and HullMA analysis.
Must be used on the 3 minute chart.
Supports leverage up to x50 with certain security.
-------------------- PT-BR -------------------
Script desenvolvido para trading automatizado (autoview).
Início do backtest: Jan 01 2020.
Forma de atuação:
Analise de SMA, EMA e HullMA.
Deve ser usado no gráfico de 3 minutos.
Suporta alvancagem de até x50 com certa segurança.

Hermes v1.0Hello
Today, I'm releasing Hermès my Eth Trading Script.
Hermès is a variation of my BTCUSDT Script Hadès.
It's looking for specific money/price patterns and compares the results with the "retails sentiment" then, the potential signals are filtered out with an advance/exclusive trend detector. ("Apóllôn" module).
Because this script is expected to be used with Bitmex, you should have a solid trading knowledge(money/Risk Management) .
On the last 4 Months:
* High Profits (~242% fees included)
* Extreme Accuracy (~92.86%)
* Very Low drawdown (-6%)
* About 4-5 Trades a month.
This indicator has been developed for BITMEX:ETHUSD /15Mins/Candles only.
As usual with my scripts:
- No repaint.
- Two Weeks of trial. (Minimum 1 Full trade/nothing to lose!)
Don't hesitate to claim your trial to check on its performance.
More information in my signature.(again don't hesitate to send me a message if you have questions)
Have a Good Day!

Sphynx | XBTUSDCryptocurrency markets are not Gaussian in nature, and similar is the case with other financial markets.
But still, most of the volatility indicators(and many other indicators as well) are based upon the Gaussian Model.
This Strategy is a perfect example of how custom Gaussian Models can predict the price action with decent accuracy.
This strategy primarily depends on the implied volatility of the trading Instrument.
It tries to predict reversals in the price action when the price moves abruptly and shows weakness to sustain or continue the sudden changes. Also note, the strategy is only valid for shorter timeframes since, in the bigger timeframes, other more dominating factors control the price action.
The strategy also uses only one user input parameter; this drastically reduces the risks of overfitting and makes the Strategy more apt for other volatile instruments as well.
It also does not use any of the Tradingview indicators/functions that can cause the script to have repainting issues. Tradingview Repainting Docs
It enters in positions when sudden changes are not sustainable in nature.
Backtesting Settings
Initial Capital : 1000 USD
Order Size : 5000 USD (Considering 5x leverage)
Commission : 0%
Backtest Range : 29-11-2019 to 29-12-2019
Happy Holidays!

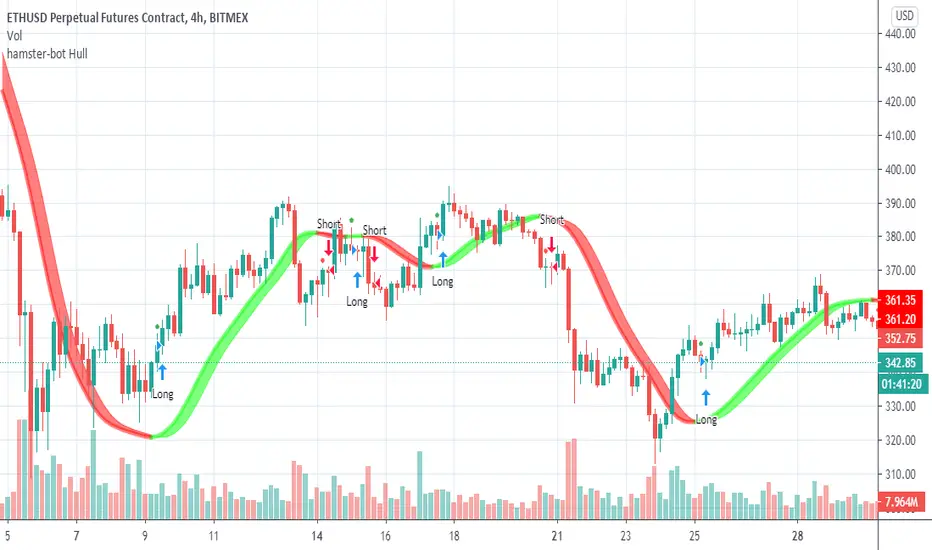
Hull Suite strategy + alerts hamster-botThis is a trading strategy on the Hull Suite indicator. 3 Hull variations: HMA, THMA (3HMA), EHMA. The strategy is always in position according to the trend of the indicator.
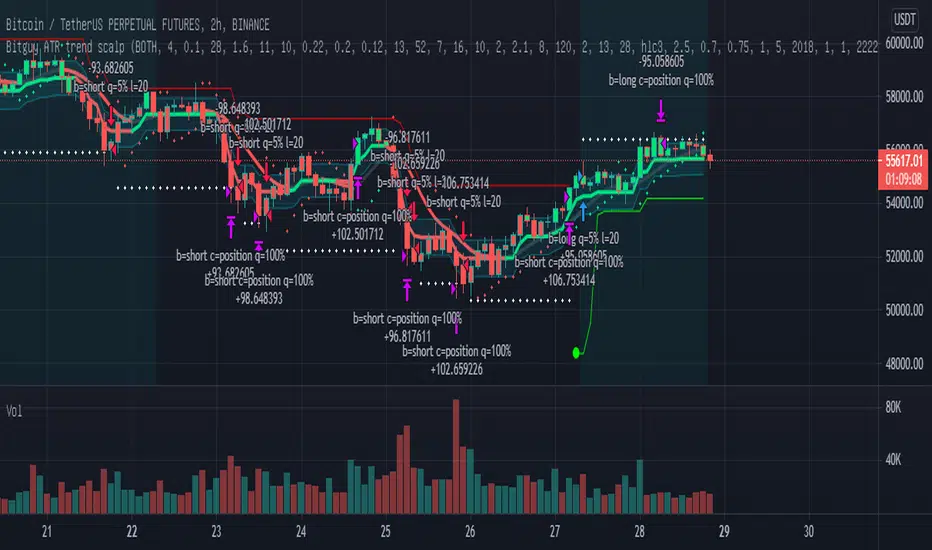
BITMEX Bybit binance HUOBI OKCOIN BTC DMI ATR DPO TREND strategyBITMEX Bybit binance HUOBI OKCOIN BTC DMI ATR DPO TREND strategy
This is a very effective trend strategy.
Strategy principle
HOW TO USE
set long position when a green arrow appears in the chart.
set short position when a red arrow appears in the chart.
For the long position and the short direction, you can set the stop profit & stop loss or trailing profit stop & trailing stop loss respectively.
When a purple arrow appears to close a position, an aggressive trader can go in the opposite direction when it is purple.
Strategy applicability
The default setting is for bitmex perpetual swap contract XBTUSD , bybit BTCUSD perpetual futures contract ,binance btcusdt Spot,Bitfinex BTCUSD Spot,bitflyer BTCJPY Spot,bithumb BTCKRW Spot,bitso BTCMXN Spot, bitstamp BTCUSD Spot,bittrex BTCUSDT Spot,Coinbase BTCUSD spot, deribit BTCPERP perpetual futures contract,gemini BTCUSD Spot,Hitbit BTCUSDT Spot,huobi BTCUSDT Spot KRAKEN XBTUSD spot,OKCOIN OKEX BTCUSD3M BTCUSD BTCUSD2W,Poloniex BTCUSDT Spot etc btc symbol with 30 minutes timeframe.
This indicator has broad applicability and can be applied to multiple different symbols.
This indicator also applies to the ETHUSD symbol etc, just adjust the default configuration.
Using the alert of the indicator, it can work well on the trading robot like Gunbot,autoview, without repaint false signals.
这是非常有效的趋势策略。
如何使用
在图表中出现绿色箭头就做多。
在图表中出现红色箭头就做空。
对于多头头寸和空头方向,您可以分别设置止损和止损或尾随利润止损和尾随止损;当出现紫色箭头时平仓,激进的交易者,可以在紫色时就做反方向。
策略适用性
默认设置是针对bitmex交易所 XBTUSD永久掉期合约,BYBIT交易所 BTCUSD永续期货合约,binance币安交易所 btcusdt现货,Bitfinex交易所 BTCUSD现货,bitflyer交易所 BTCJPY现货,bithumb交易所 BTCKRW现货,bitso交易所 BTCMXN现货,bitstamp交易所 BTCUSD现货,bittrex交易所 BTCUSDT现货,Coinbase交易所 BTCUSD现货,deribit交易所 BTCPERP永续期货合约,gemini双子星交易所 BTCUSD现货,Hitbit交易所 BTCUSDT现货,huobi火币交易所 BTCUSDT现货,KRAKEN交易所 XBTUSD现货,OKCOIN OKEX交易所 BTCUSD3M OK BTC季度合约 BTCUSD BTCUSD2W OK BTC次周合约,Poloniex BTCUSDT现货等2小时区间的btc交易。
Bitmex XBTUSD 30分钟 比特币期货 30 minutes Futures
这个指标具有广泛的适用性,可以适用多个不同交易品种。
该指标还适用于ETHUSD,ETHBTC,ADABTC,TRXBTC,XRPBTC交易品种等,只需调整默认配置即可。
Bitmex ETHUSD 30分钟 以太币期货 30 minutes Futures
使用该指标的警报设置,它可以在自动交易机器人上很好地工作,而无重绘错误的信号。