WinR Bot LONG {rezamehrjoo}Hi, this technical indicator is the best indicator for connecting to interface platforms.
One of the advantages of this indicator is that with just one web hook, you can get a large number of signals and close all trades in profit with Martingle strategy without stop loss.
Bot

WinR Bot SHORT {rezamehrjoo}Hi, this technical indicator is the best indicator for connecting to interface platforms.
One of the advantages of this indicator is that with just one web hook, you can get a large number of signals and close all trades in profit with Martingle strategy without stop loss.

3D GATOR %HLThis indicator tracks the 3 day trading bots and measures the high and the low (%).
Usually a trend can change or continue every 3 days.
When volatility decreases and both values are the same gator is going to open its jaws so it's a good time to open a position long. Avoid shorts during low volatility.
On the other hand when volatility increases, and gator has its jaws wide open is a good time to look for shorts.
That's pretty much it.
This indicator was designed by me and created by Marketwatcher.

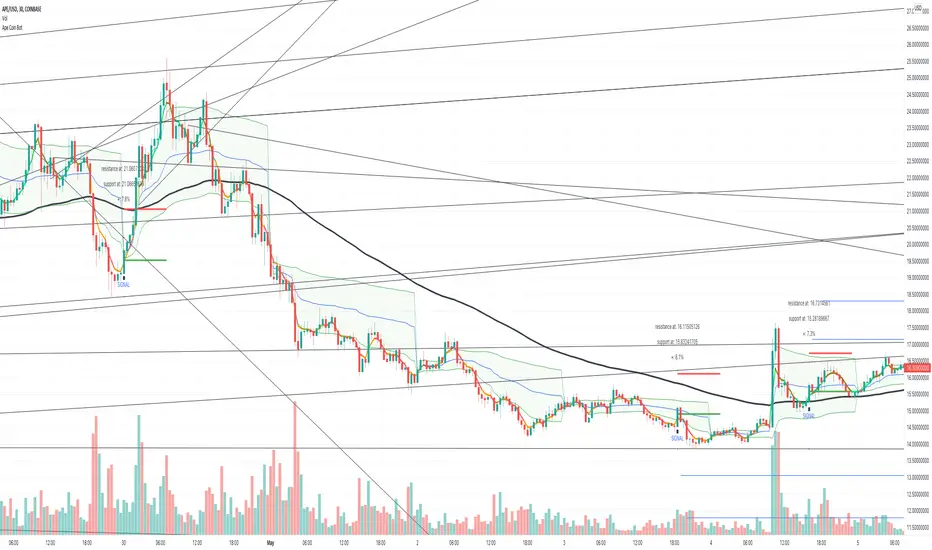
DMT TEMPELTON PECKIntroduction
Bring your A-game to the market in A-Team style with DMT Templeton Peck – you’ll love it when this plan comes together!
Using customized standard deviations between historic price action ranges and volume metrics, DMT Templeton Peck enables traders to never miss a change in trend.
In its default state, the DMT Templeton Peck indicator displays key information, such as:
• Small trend line
• Large trend line
• Position entry prices
• Take profit levels
• Stop levels
• Buy and sell trend signals
In addition to providing core functionality for the indicator’s strategy signals, traders can use this data to enter or exit trades.
When price crosses both trend lines and consolidates there is a high probability that price will continue to move in the same direction. The most profitable results are achieved when trading in the direction of the current large time frame trend.
When small and large trend lines cross a trading signal is generated which can be used to automate trades. Please see the ‘TradingView Alerts’ section of this document for further details.
The Small & Large trend line’s display can be toggled, and their colors modified in the indicator’s style options as shown below.
Basic Strategy
In its simplest form, the strategy is to buy when the price crosses and consolidates above both trend lines and sell when the price crosses and consolidates below both trend lines.
How to Trade
Confident traders may choose to enter a long position at the point
#1 when the price passes above both trend lines and begins to consolidate.
However, the safer trade is to wait for the trend lines to cross at a point
#2 and then look for an entry in the direction of the local trend.
One price action begins to reverse to the downside the strategy reverses. Confident traders may choose to enter point
#3 when the price passes both trend lines and begins to consolidate once again under the previous price action structure that is now acting as resistance.
A sell signal is generated at the point
#4 which produced a small profit; however, a new short position could have been opened when the price retraced to resistance at a point
#5 and experienced a repeated number of strong rejections.
Do not worry if you miss a trade as there is often more than a single opportunity to enter – like at position #5 when price action retests the previous local price structure as resistance.
The indicator can be used on smaller time frames to scalp or find an entry after a larger time frame has signaled, however smaller time frames will also be “choppy” and should only be traded with a paper-tested strategy.
Traders should take profit on positions at resistance & support levels and look to have fully exited the trade by the time the price crosses back over both trend lines and/or loses a previously established price level.
Indicator Tuning
In its default state the indicator is tuned for swing trades using 30 minute & 1 hour time frames, however, you are encouraged to experiment with the indicator options.
Large & Small Length options define how many historic candles are used for the calculation of the relevant trend line.
As a rule of thumb, larger time frames would use smaller values and smaller time frames would use larger values, ie. On a daily chart, a large and small length could be defined as 400 and 100 respectively.
Please be aware that there are limits to the amount of historical data for any intraday level based on your TradingView subscription level:
• Basic – 5000 bars/candles
• Pro & Pro+ - 10000 bars/candles
• Premium – 20000 bars/cables
TradingView Alerts
By utilizing TradingView alerts DMT Templeton Peck's long and short signals can be used to trigger a trading bot.
To trigger a long position, set the TradingView Alert Condition to the DMT Templeton Peck indicator and select the ‘Long’ trigger condition with the ‘Once Per Bar Close’ option for best results.
To trigger a short position, set the TradingView Alert Condition to the DMT Templeton Peck indicator and select the ‘Short’ trigger condition with the ‘Once Per Bar Close’ option for best results.
Take profit options ‘Long_TP_1’ / ‘Short_TP_1’ and Stop options ‘Stop_long’ / ‘Stop_Short’ can also be configured in the same manner to conditionally trigger a trading bot and can be configured in the indicators Input options.

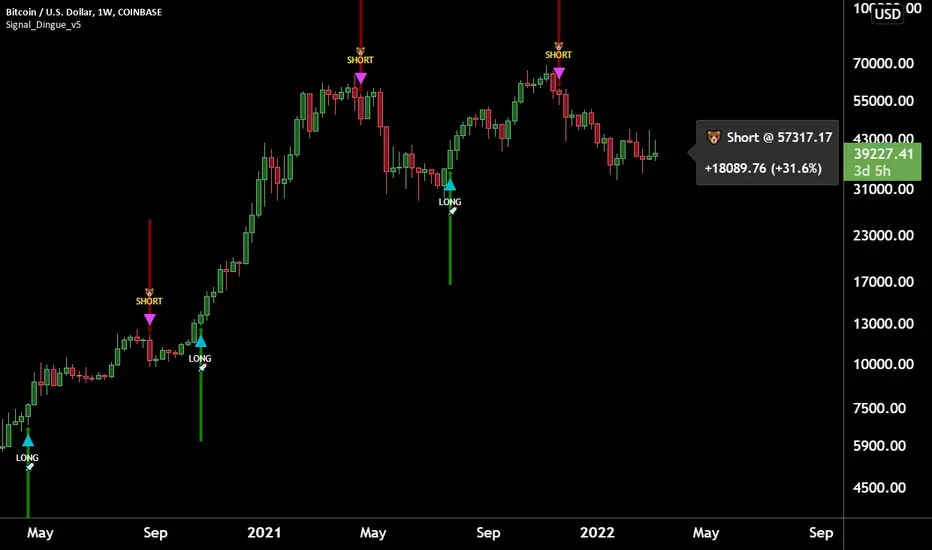
Trading Assistant DiNGUETrading Assistant DiNGUE This indicator is like a trading assistant for your charts.
It helps set your biases and emotions aside and lets you focus on managing trades in an easy visual way.
Get various types of signals to enter your trades (either Long or Short). Then use take profits, stops, or the opposite signal to exit trades.
The signals are created from various indicators and sensibility options you can customize any way you want. Works on every timeframe.
You can customize every setting or used the preset ones. Preset settings adjust automatically based on the timeframe you are using on the chart.
The 12 Indicators are Volume - RSI - Stochastic - MacD - Moving Averages (MA) - Rate of Change (ROC) - ADX DMI Directional Movement Index - On Balance Volume (OBV) - Bollinger Bands - VWAP - ATR - Parabolic SAR.
Every indicator can be turned On or Off.
You can adjust the way it creates signals by selecting either 'rise-fall', 'crosses' or by combining both.
You can select the sensitivity of the signal from Normal - Safe - Safer.
You can adjust lengths or use the preset ones.
There are also additional options for each indicator, you can filter weak levels for ADX, filter for tight bands, have ROC above 0…
You can also plot several of those indicators on the screen. 2x Moving Averages, 2x VWAP, 2x ATR, 2x SAR for even easier visualization of the trend.
You can also plot fractals to facilitate once again on trend visualization. Higher high, lower low, higher low, lower high.
Trade with the Trend and Safe Trades:
If you want to have a higher chance of success, you can trade with the trend. First, select the trend timeframe you would like to use. Let's say the “Weekly” trend. Meaning it will generate a signal on the weekly timeframe and based on the result (Long or Short) it will only take trades in that direction. So the trend is LONG on the Weekly and you get a “Long” signal, it will take it. “Short” signals on the other hand will be treated as “stops” and won’t want to go against the trend by going ‘short’.
Safe Trend works in the same manner, but instead of using the signal on a bigger timeframe, it uses an indicator as to the deciding factor. Let's say you select the 200SMA as the “Safe signal”. The indicator will only go “Long” when above the 200SMA and “Short” under the 200SMA. Otherwise, it will put a stop instead of going against the trend.
Stop Loss:
There are 4 different types of stop-loss that you can use at the same time.
- Indicator Stop
- Fib stop
- Fix % stop
- Trailing stop
You can plot the stops directly on the chart AND OR add them to the panel for an easy visualization once again.
With the ‘indicator stop’, you can select one of the two: MA ATR SAR VWAP as a stop.
Fib stop, it uses fib numbers to calculate a stopping point.
Fix %, you can select your max loss in percent. Could be 2%, 5%
A trailing stop is like a fixed stop but that will trail as the price moves in the right direction.
Take Profit:
There are 4 different types of take profit that you can use simultaneously.
- Fix % Take Profit
- ATR multiple Take Profit
- Fib multiple Take Profit
- Bollinger Band Take Profit
Fix % just let you set a fix take profit target in percent.
ATR multiple lets you select a target based on a multiple of the average true range.
Fib multiple lets you select a target based on a fib multiple
Bolling Band lets you take profit based on the Bollinger band settings you select.
Visual Panel:
The visual panel lets you see exactly how is the last trade progressing. It will give you the entry price, profit, stop, and target. You can turn it on or off, as is for the stop and target.
You can also decide to plot 1 position or more, you can even show all the possible signals, add backgrounds with colors. You can also plot the bigger Trend and Safe Signals explained above.
If you have any questions, suggestions, or comments, feel free to do so!
Pattern Recognition Pullback Strategy profit calculatorThis script has been designed for use in botting Crypto spot / futures.
The intended use is send signals to a 3commas bot setup for the exchange. The bot uses candle measuring percentile nearest rank filters and range
breakouts to decide if the market is trending. When the market is trending it will look for pullbacks below a moving average and buy in the trend direction on a pullback discount. This is the profit calculator part of the script
With this script you will not be able to send tradingview signals, that is because it is a payed premium service and for security reasons I am the only one with access to making signals from this script.
I provided a user manual:
drive.google.com

Pattern Recognition Pullback StrategyThis script has been designed for use in botting Crypto spot / futures.
The intended use is send signals to a 3commas bot setup for the exchange. The bot uses candle measuring percentile nearest rank filters and range
breakouts to decide if the market is trending. When the market is trending it will look for pullbacks below a moving average and buy in the trend direction on a pullback discount.
With this script you will not be able to send tradingview signals, that is because it is a payed service and for security reasons I am the only one with access to making signals from this script. I will be uploading a second script which is the profit calculator. This way you can toy around to find your preferred settings for the bot and see the results it could have made.
I provided a user manual:
drive.google.com

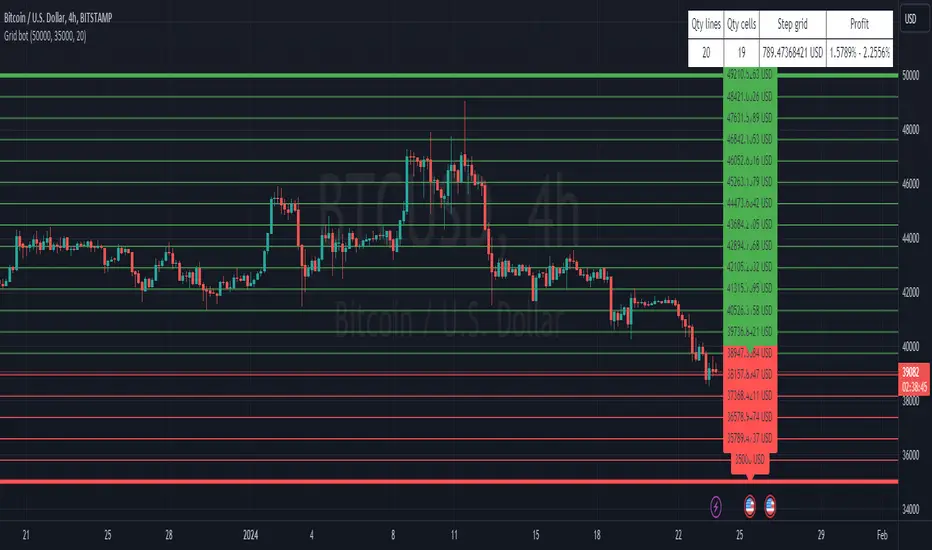
3commas GRID bot VisualisationHello everyone
This is a grid display indicator for a 3-comma grid bot.
Just enter the upper and lower borders of your grid and the number of grid cells in the indicator settings.
It's simple!
The Witcher [30MIN] - AlertsHello,
This is the Witcher Bot
This bot is got best performance at BTCUSDTPERP BINANCE FUTURES
this is bot for leverage 1x,
I tried focusing at highest % profitable trades, bot could be optimalised to even higher profit net.
TP: 1.1
SL: 8.2
Stop-loss unfortunelly have to be high to avoid bear/bull traps
The core of this strategy is trend strenght ( MONEY FLOW INDKES)
Strategy can only open position on strong price movment, to avoid wrong decision
Settings are set for highest profitable trades %
Bot using 10 indicators to trigger basic condtition for long and short :
1) ADX - Is one of the most powerful and accurate trend indicators. ADX measures how strong a trend is, and can give valuable information on whether there is a potential trading opportunity.
2) RSI - value helps strategy to stop trade in right time. When RSI is overbought strategy don't open new longs , also when RSI is oversold strategy don't open new shorts
3) TREND STRENGHT
4) JURIK MOVING AVERAGE - The Jurik Moving Average indicator is one of the surest ways to smoothen price curves within a minimum time lag. The indicator offers currency traders one of the best price filters during strong price moves. In this time, when bitcoin price action is so strong, this indicator is necessary.
5) SAR - The parabolic SAR is a technical indicator used to determine the price direction of an asset, as well as draw attention to when the price direction is changing. SAR supporting bot, to not open new trades when the trends are slowly changing
6) TREND INDICATOR
7) MOMENTUM - Indicator istechnical analysis tool used to determine the strength or weakness of a stock's price. Momentum measures the rate of the rise or fall of stock prices. Common momentum indicators include the relative strength index ( RSI ) and moving average convergence divergence ( MACD ).
8) OBV - On-balance volume (OBV) is a technical trading momentum indicator that uses volume flow to predict changes in stock price.
9) FAST MA - like previous ones this is for better view of trends, and correctly define the trends, also Speed_MA are using for predict the future price action.
10) RANGE FILTER - this indicator is for the better view of trends, define trends, that is important for every bull/bear traps which helps a lot becouse of the very variable trends.
I decided to add momentum indicator to strategy, to make a fast-reacting decision on lower timeframes at extremly price volatility
Also bot got additional EMA scalping option, which increase profit net but, in some situation, that could be risky.
For max security I recommend to turn off this option.
Commision are set at standard binancefutures VIP-0 = 0.04%
After converting strategy into study version, bot is ready for automation.
All the ploting color depends of adx value.
Strategy are not Repainting
For the source code I tried to keep as clean as I could
Enjoy

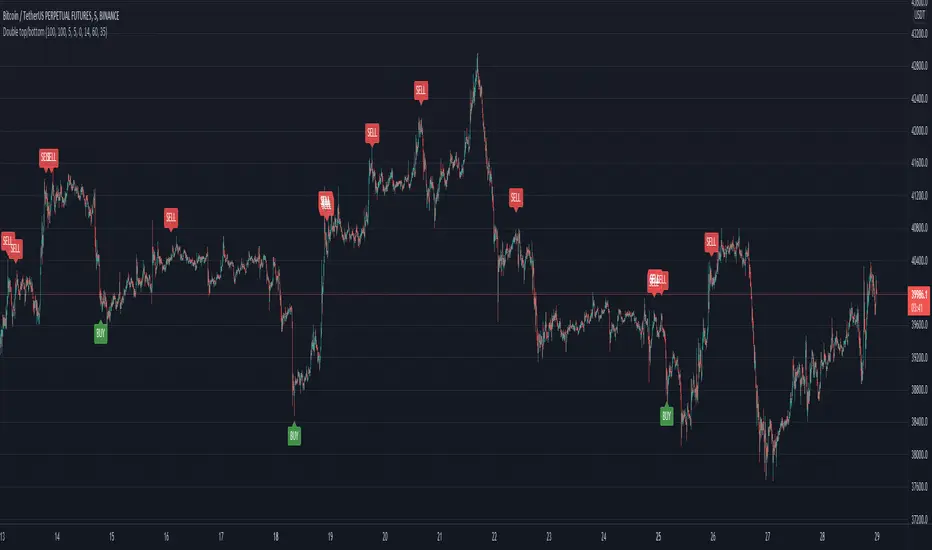
Double top/bottomHello!
This alerts is based on the double bottom pattern - for entering a long position / double top-short
A double bottom pattern is formed when two price bottoms are relatively at the same level and the top acts as resistance. This pattern appears at the end of a downtrend and signals a reversal.
A double top is a bearish reversal pattern that signals the end of an uptrend. It is formed by two price highs forming at the same level and a notch line that acts as local support.
As history and practice show, the double bottom pattern works better. Moreover, in a bull market.
// LOGIC ENTRY:
Period for short and long positions-to search for double bottom as well as double top . the more, the less false.
Change liong and short-channel width for pattern search separately for long and short.
General shift-the overall width of the channel, which changes equally at once for long and short
By default, quiet settings for 1 hour
You can choose the settings you like.
//FILTER SETTING
-RSI
If the checkbox is checked, the filter will be enabled.
The higher the upper bound, the less frequent short entries.
The lower the indicators of the lower border, the less frequent entries to the long
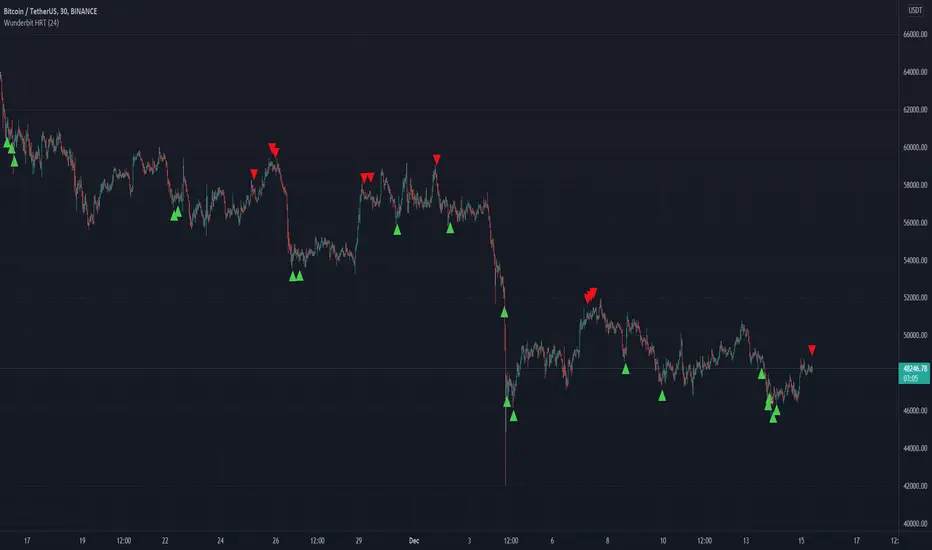
Wunderbit HRT BotWunderbit HRT is a proprietary indicator designed to find pivot points in the cryptocurrency market.
Working timeframes from 30 minutes and above.
The indicator is designed to create automated trading strategies using a webhook.
To create a cryptocurrency robot for this indicator, you need:
1. Create alerts and bind the URL to the webhook.
2. Link the Tradingview indicator to automation services.
For signals, alerts are used: LONG and SHORT
Recommendations for the indicator:
1. Use DSA technology for automation.
2. Be sure to disable the "multiple inputs" function.
3. Use an indicator with oscillators or MACD to confirm the entry point.
BTCUSDTPERP MEGABOT 60min [ALERTS VERSION]BINANCE:BTCUSDTPERP
Hello, this is my alerts version of BTCUSDTPERP MEGABOT 60min
THIS BOT IS ONLY FOR BTCUSDTPERP ON BINANCEFUTURES !!!!!!!!!!!!!!!!!!!!!!!!!!!!!!!!!!!!!!!!!
This configs are only for this pair on this market,
It depends of volume , and others indicator
Bot is making amazing results at configs
TP - 4.5%
SL - 7%
Strategy using 4 indicators :
ADX
RSI
VOLUME
MACD
ADX - makes a solid view to trend without any scam wick :
Long only on green bars
Shorts only on red bars
That's helps my strategy to define a right trend
there is also a orange option for unidentified trends
RSI - value helps strategy to stop trade in right time
When RSI is overbought strategy don't open new longs
also when RSI is oversold strategy don't open new shorts
Volume - volume is the most important indicator for the strategy,
to avoid open trades on flat chart, new trades are open after a strong volume
wicks
MACD - this indicator is for define the trend
So the way this bot is working is simple
when every arguments are confirmed , then strategy open trades
Enjoy !!!

WaveTrend 4h/24mWaveTrend 4h/24m is a trading tool based on two WaveTrend timeframes.
For this script the WaveTrend calculations made by LazyBear were used. WaveTrend is a widely used indicator for finding direction of an asset.
The strategy is developed by Youtuber Jayson Casper. The main strategy on the 4 hour and 24 minute timeframes, this will be the default timeframes. Timeframes can be adjusted in the indicator interface.
With Jaysons' we wait for both timeframes to have last printed a green dot for longs, and both timeframes to have last printed a red dot for shorts. When this occurs a green diamond will be printed for longs, a red diamond for shorts.
Make sure to always use the chart from the smallest timeframe you're using, so by defaults use the 24 minute chart.
Features of the indicator:
- WaveTrend Timeframe 1 (Blue/Lightblue wave).
- WaveTrend Timeframe 2 (Blue/Purple line with filled background between the lines).
- VWAP (Yellow wave which is turned off by default)
- Green/Red Diamonds
What to look for?
This script is all about the Green and Red Diamonds.
A Green diamond will be printed when on both the 4 hour and 24 minute timeframe the last printed dot was a green dot.
A Red diamond will be printed when on both the 4 hour and 24 minute timeframe the last printed dot was a red dot.
What are the Green and Red Diamonds based on?
When both VWAP timeframes are ABOVE 0, a green diamond will be printed. This is equivalent to the last dot on both WaveTrend timeframes being a green dot.
When both VWAP timeframes are BELOW 0, a red diamond will be printed. This is equivalent to the last dot on both WaveTrend timeframes being a red dot.
Happy Trading!

RSI Rising Crypto Trending AlertAlert version of the strategy with the same name
This is crypto and stock market trending strategy designed for long timeframes such as 4h+
From my tests it looks like it works better to trade crypto against crypto than trading against fiat.
Indicators used:
RSI for rising/falling of the trend
BB sidemarket
ROC sidemarket
Rules for entry
For long: RSI values are rising, and bb and roc tells us we are not in a sidemarket
For long: RSI values are falling, and bb and roc tells us we are not in a sidemarket
Rules for exit
We exit when we receive an opposite direction.
Cuation: Because this strategy uses no risk management, I recommend you takje care with it.
If you have any questions, let me know !

ProProfits LongStrategy made ready for automated trading based on Wavetrend/VWAP/RSI.
Whenever a 18 minute timeframe wave reaches below -60 is followed by a 3 minute timeframe VWAP cross up, a long signal will be given.
Once an RSI cross on the 10 minute timeframe above 60 is followed by a red dot on the momentum waves on the 1 minute timeframe, a Take Profit signal will be given.
The timeframes are adjustable in the settings interface, so this automated strategy can be used with any timeframe combination for the Wavetrend/VWAP/RSI.
Always make sure to view the chart from the lowest timeframe you're using.

Bjorgum AutoTrailOne Time Trade Risk Management
Incorporating the new interactive feature, this script is meant as a one time trailing stop for the active trader to manage positional risk of an ongoing trade. As a crypto trader or Fx trader, many may find themselves in a position late into the evening, or perhaps daily life is calling while a trade progresses in their favor. Adding a trailing stop to a position thats trending can help to keep you in the trade and lock in gains if things turn around when you are unable to react.
To use the trail, the user would add the script to the chart. Once added, a set of crosshairs will appear allowing the user to choose a point to begin. Often choosing to start a trail from a swing high/ low can be an ideal option. This tends to provide some protection for a stop by placing it under support for a long trade or above resistance for a short trade.
Price based trail
The trail will automatically plot and the offset is a factor of the distance from price action selected by the crosshairs. If placed above price action the script will plot a short trail, if placed below it will trail for a long position.
Additionally, there are several other trail types other than price based. There is also percent based, which offsets the trail as a percent from close. A hard stop is placed at the cross hair value, then once the distance is exceeded by the percentage specified, the trail begins.
There are 2 more volatility based trails. There is a PSAR trail which can provide quicker and tighter stops that accelerate with the trend locking in gains faster, and an ATR trail that keeps a distance from price action as a function of volatility. Volatility levels can be adjusted from the menu.
Volatility based trail (ATR)
Volatility based trail (PSAR)
Lastly, within the code for more the more technical savvy, is some starting setups for string alerts to be sent to exchanges via 3rd party or custom API applications. Some string manipulation is required for specific providers to meet their requirements, but there is some building block alerts that will take the ticker symbol, recognize the asset your trading (Fx, Crypto, etc) and take input quantity or exchange names from the settings via inputs.
Complex strings can be built to perform almost any trade related task when to comes to alerts via web hook. A little setup this way with some technology to back your system can mean a semi-automated half man, half machine setup that actually manages your trail stop while you cannot. For those that don’t go this far, there is some basic alert functionality that well trigger when a trail is hit so you can react and make a decision.
Please note that for now, interactive mode is engaged only when the script is added to the chart. Additional stops, or for adjustments to be made it is best to add a new version. Also as real trades could be at play managing an actual position, alerts are designed to go off only once to ensure no duplicate orders are sent meaning alerts are not reoccurring. Once an alert is triggered, a new trail is to be set up.
A modified version of the TradingView built in SAR equation was used in this script. To provide the value of the SAR on the stop candle, it was necessary to alter the equation to extract this value as the regular SAR “flips” at this point. Thank you to TradingView for supplying access to the built in formula so that this SAR could behave the same as the built-in function outside of these alterations
Example of SAR value maintained in trigger candle
Cheers and happy trading.

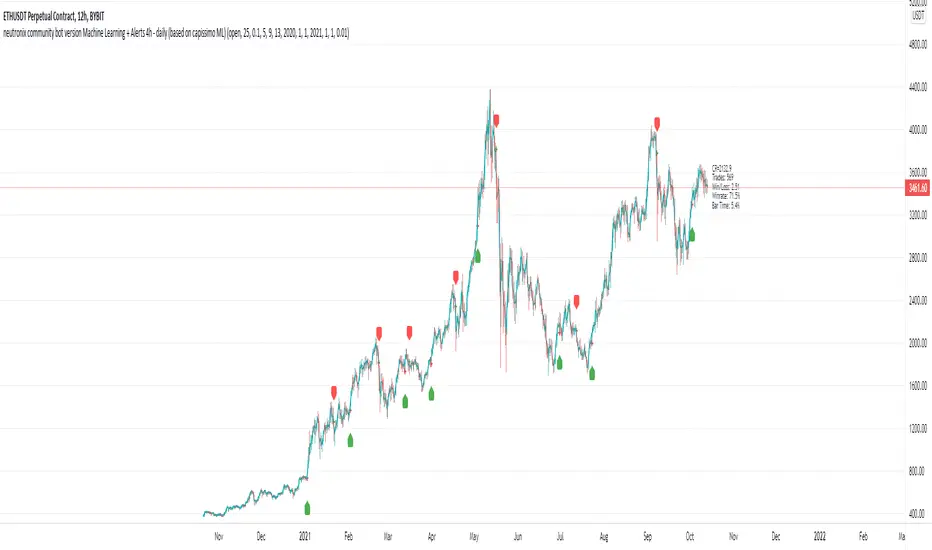
neutronix community bot ML + Alerts 4h-daily (mod. capissimo)Gm traders,
i have been a python programmer for some years studying artificial intelligence for general purpose; after some time i finally decided to have a look at some finance related stuff and scripts.
Moved by curiosity i've decided to make some but decisive modifications to a script i tried to use initially but without success: the LVQ machine learning strategy.
So after studying the charts and indicators, i have rewritten this script made by Capissimo and added heavy filtering thanks to vwap and vwma, then fixed repaint and other issues.
I hope you enjoy it and that it could increase your possibilities of success in trading.
HOW TO USE THE SCRIPT
Add the script to 3h+ charts like for example BTC 4h, 6h, 8h, 12h, daily. (In order for it to work on shorter timeframes charts you can try to change to lookback window but i dont advise it).
Change only rsi and volfilter(volume filtering) settings to try to find the best winrate. Leave dataset to open. Fyi the winrate isn't 100% accurate but can give you a raw vision of final results.
Use alerts included for trading and and in options click on 'Once per bar'. If you have checked 'Reverse Signals' in the control panel you have got more 'risky' signals so be advised if trading futures and stocks.
Exit trade signals not provided, so it is recommended the use of take profits and stop loss (1.5:1 ratio)
As always, the script is for study purposes. Do not risk more than you can spend!
Original LVQ-based strategy made by capissimo
Modified by gravisxv 13/10/2021
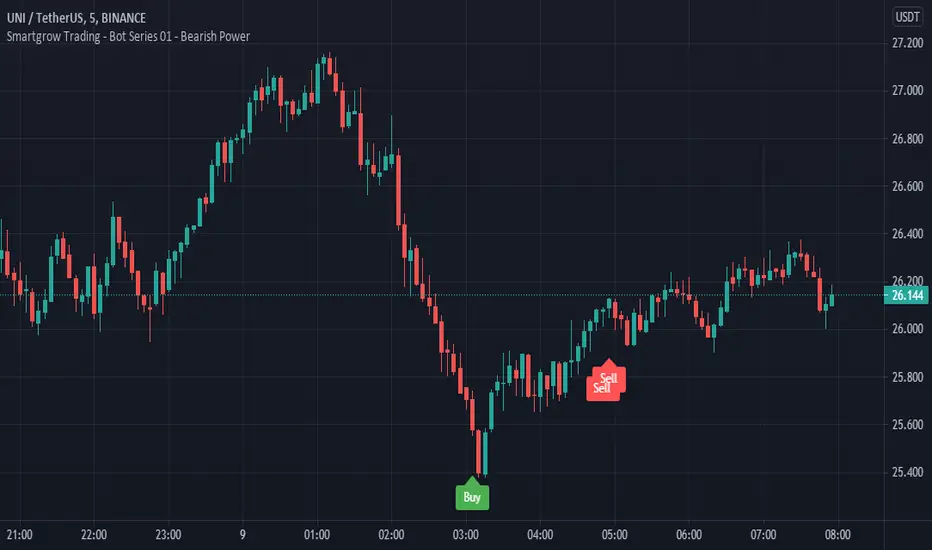
Smartgrow Trading - Bot Series 01 - Bearish PowerWelcome to our first Tradingview trading bot.
We develop signals which have been specially developed for crypto trading bots. We publish new indicators at regular intervals.
The main idea behind the bot is to use custom created indicators in a short and longer term timeframe to signal potential trendreversals in downtrends or ranging markets. The bot is not waiting for a trend confirmation signal before entering a trade, on the contrary, the bot waits for statistical extreme values to open a trade. When potential signals are detected we are trailing price to find the best spot to enter a trade. With this approach we buy in strong oversold areas as these have great potential to move in the other direction again. The sell signals are also generated by this custom indicator only selling off, if a stronger recovery in the market has occured. The potential profit margin is therefore between the best possible entry into a heavily oversold market and a recovery of the market.
So this tradingbot isnt designed to work with take profit, stop loss or trailing stop loss. This would result in a long term loss and is therefore not recommented. Also the bot is not tested in any other market like futures or stocks. So we recommend to use it in crypto spot market only.
Depending on market situations, potential losses can occur when a market is strongly bearish and does not want to recover over a long range, or when the bot has entered a trade to early. We have built in a safety mechanism for detecting further downtrends to avoid major losses. This mechanism is part of the needed risk management Therefore we are suggesting to use a proper risk management so only use 2-5% of your funds per trade. We use this bot with 2,5% funds per trade for our personal use. The study needs to be set up in the 5 min chart to work and you need to set up one buy alarm and one sell alarm per pair. The Signals are very picky therefore it is suitable to apply it on all possible pairs on your exchange excluding stable and shitcoins. You could test it in other financial markets but the bot was developed especially for crypto markets. If you have questions regarding pairs or want to see real life performance, feel free to contact us.
This indicator using different timeframes so it is sending a repainting warning. Cause it calculates values in a different timeframe. But thats normal and it wont recalculate results.
We sell this indicator so it is invite only. But of cause you can test it before buying.
If there are questions, write them into the comments or contact us directly over the direct message. Happy Trading!
Skript nur auf Einladung
RaBot V1.0.0Rabot is an indicator for new users as well as experienced users.
This indicator tries to predict both buy and sell signals. You can configure it for both scalping and swing trading.
It has two modes, one more "conservative", where the number of entries will be less than the other "greedy" mode.
Based on the famous and complex indicator "Koncorde" that combines both trend and volume knowing the manipulation of strong and weak hands, patterns, and crossing of emas customized by us; for example: a buy signal in conservative mode will only open if the trend is bullish and vice versa.
The user can configure the way they like by opening many positions or few but more secure based on their trading style.
The indicator also has the option to configure which chart we want to obtain the trend from, this is to avoid perhaps opening shorts in a very bullish trend line for example.
Rabot is a fairly complex indicator, which can be used for automatic use of inputs and outputs, as well as manual.
You also have the option of NOT opening a position if there is one currently open, and the option for the next signal to be the opposite of the last one.
5TPs, 1SL, and Breakeven after take profit achieved.
Finally version 1.0.0 is now available! :)
This version does not have backtesting (we have another that yes)
We are continuously working, testing and updating bugs and improvements.
Do not hesitate to get in touch for a feedback, it will be welcome and we will take it into account.

RaBot V1.0.0 - BacktestingRabot is an indicator for new users as well as experienced users.
This indicator tries to predict both buy and sell signals. You can configure it for both scalping and swing trading.
It has two modes, one more "conservative", where the number of entries will be less than the other "greedy" mode.
Based on the famous and complex indicator "Koncorde" that combines both trend and volume knowing the manipulation of strong and weak hands, patterns, and crossing of emas customized by us; for example: a buy signal in conservative mode will only open if the trend is bullish and vice versa.
The user can configure the way they like by opening many positions or few but more secure based on their trading style.
The indicator also has the option to configure which chart we want to obtain the trend from, this is to avoid perhaps opening shorts in a very bullish trend line for example.
Rabot is a fairly complex indicator, which can be used for automatic use of inputs and outputs, as well as manual.
You also have the option of NOT opening a position if there is one currently open, and the option for the next signal to be the opposite of the last one.
5TPs, 1SL, and Breakeven after take profit achieved.
Finally version 1.0.0 is now available! :)
This version contains backtesting with 5000 backbars to see if it is being profitable or not.
We are continuously working, testing and updating bugs and improvements.
Do not hesitate to get in touch for a feedback, it will be welcome and we will take it into account.

Dump AlertsNYSE:BRK.B
By popular demand: An inverted version of my first indicator Pump Alerts in Pine Script with two alert conditions for trading bots and automated stock trading setups.
It's originally based on "Pump Catcher" by @joepegler
I modified some parts, hopefully improved the usability and enabled alerts, so you can use it to trigger bots like 3commas via webhooks or stock brokers partnering with TradingView.
Dump Alerts 📉 attempts to detect moments of abnormal and accelerating increase in volume concurrent with falling prices AKA "dumps". Small and big dumps.
I recommend trying different timeframes and tinkering with the lookback period as well as both threshold values.
Other than that it's pretty self-explanatory and beginner-friendly.
Free and Open Source. Let me know how you use it!

Smart AlertsThis indicator provides back-tested signals and alerts from multiple technical indicators.
No more guessing whether or not you should trust an indicator. See your indicators' past performance at a glance.
No more false alarms. Disable re-painting of signals.
When multiple indicators overlap, a Confluence indicator will print (large triangle). With your settings properly tuned, this will show a HIGH probability of a move.
Current Signal/Alert Options (more to come):
RSI Oversold
RSI Overbought
EMA Crossing Up
EMA Crossing Down
Buy Signal Confluence
Sell Signal Confluence
Instructions:
-Enable/disable individual indicators so you can fine tune one at a time
-Adjust the indicator's settings
-Adjust your trade parameters (Max Wait, Take Profit %). Signals that would have given the desired profit in the time allowed will be painted orange.
-Repeat this process with each indicator until you're satisfied
-Set-up alerts
