Expansion Top/Bottom (Expo) Expansion Top/Bottom (Expo)
DESCRIPTION
Expansion Top/Bottom (Expo) indicator is a powerful oscillator that visualizes temporary Top/Bottom as well as trend shifts. When the market moves boldly a histogram will be formed in the indicator which indicates that the movement might be at its end. It's always a great idea to lock in some profit when we get these histograms. These ‘Lock-in’ profits points are visualized by a cross.
The professional trader has the ability to adjust the length of the calculation. A longer length means that the indicator spots broader market shifts. A short length means that the indicator spots temporary tops/bottoms.
Use the indicator in combination with other signals and analysis techniques.
HOW TO USE
1. Use the indicator to identify temporary tops/bottoms.
2. Use the indicator to identify broader tops/bottoms.
3. Use the indicator to visualize the trend.
4. Use the indicator to visualize ‘Lock-In’ profit points.
INDICATOR IN ACTION
Short length (Length = 14)
BTCUSD
EURUSD
BRENT
BRENT
BTCUSD
Long length (Length = 50)
BRENT
EURUSD
BTCUSD
The indicator works with RENKO, HEIKIN ASHI and with KAGI charts as well.
I hope you find this indicator useful, and please comment or contact me if you like the script or have any questions/suggestions for future improvements. Thanks!
I will continue to work on this indicator, so please share your experience and feedback with me so that I can continuously improve it. Thanks to everyone that have contacted me regarding my scripts. Your feedback is valuable for future developments!
ACCESS THE INDICATOR
• Contact me on TradingView or use the links below.
• I have started to publish private scripts which are not visible on my profile. However, if you're interested to know more about these scripts, drop me a message at my webpage and I will show you these scripts as well. The rationale behind publishing these scrips as private is that I don't want them to be indexed in search engines.
-----------------
Disclaimer
Copyright by Zeiierman.
The information contained in my scripts/indicators/ideas does not constitute financial advice or a solicitation to buy or sell any securities of any type. I will not accept liability for any loss or damage, including without limitation any loss of profit, which may arise directly or indirectly from use of or reliance on such information.
All investments involve risk, and the past performance of a security, industry, sector, market, financial product, trading strategy, or individual’s trading does not guarantee future results or returns. Investors are fully responsible for any investment decisions they make. Such decisions should be based solely on an evaluation of their financial circumstances, investment objectives, risk tolerance, and liquidity needs.
My scripts/indicators/ideas are only for educational purposes!
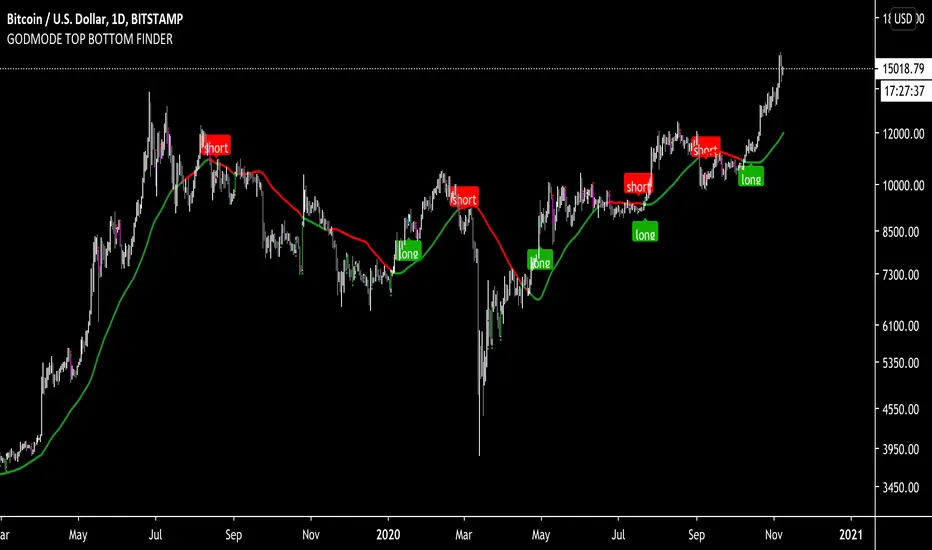
Bottom

potential top bottom finderpotential top bottom finder
long is start of accumulation / buying
short is start of distribution / selling
Epic Market Indicator 2.0 (EMI 2)After months and months of back-testing, I have finally decided to release this update. Would also like to give out a special thanks to Tradingview for making it possible to create scripts and share this with the community. I have occurred a lot of information in this community. I believe that when you take, you should also share. That’s why I am sharing this wonderful indicator for free. Remember, knowledge and experience is the most valuable things in life.
EMI, Epic Market Indicator:
60-74% theoretically profitable trades, depending on the time period. However if you use EMI blindly, the percentage might even go lower. Nevertheless, there should be enough presenting opportunities, if you use her wisely.
This indicator is a combination of different oscillators:
Common:
-MACD
-VWAP
-RSI
-Stochastic
-Volume Flow
-Buy & Sell signals
-Bottom & Top signals
-Volume Flow heat map
RSI turns green or red when entering overbought or oversold territories.
Dots on wave crossings are buy or sell signals.
Diamonds above are possible bottoms and tops.
Green = Bull signals
Red = Sell signals
These signals are buy & sell conditions based on different oscillators, known by many traders.
ALWAYS wait for the candle to close and another confirmation before taking any consideration nor actions. No signals means trend continuation.
Using EMI 2 in combination with EMI 1, traditional authentic pattern formations and darkened theme is recommended. Good luck fellow traders and don't forget to tap the like button. Thanks in advance.
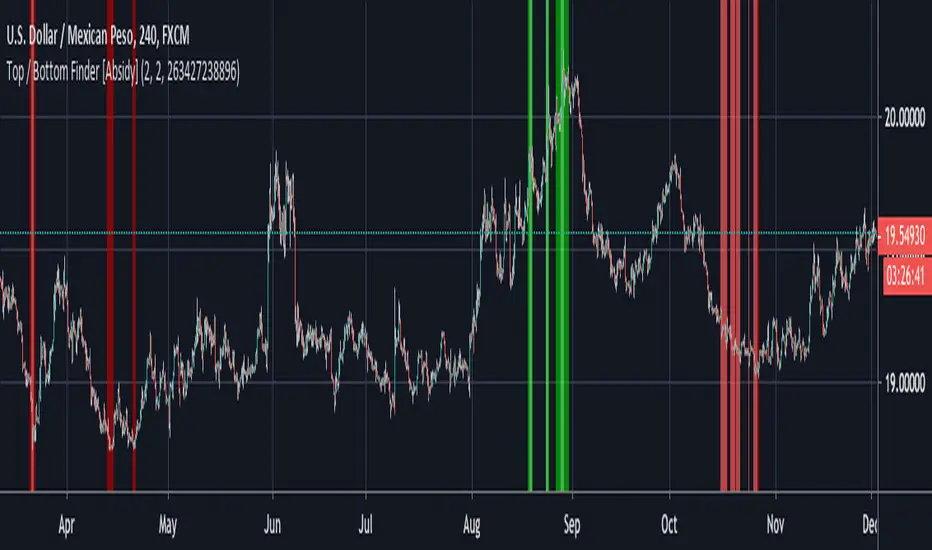
Top / Bottom Finder The Top/Bottom Finder is a unique indicator that looks for market tops and market bottoms in real time without repainting or lagging! When this indicator suspects that a market top is forming it changes the background of the chart to bright green. When this indicator suspects that a market bottom is forming it changes the background of the chart to bright red. This is a great confluent signal for other indicators and strategies that focus their trading styles on entries and exits in the top or bottom of the market. There are two settings that you can change depending on what markets you are in and your trading style. If you are looking for very quick scalping opportunities it is best to set the sensitivity setting very low to look for quick changes, but if you are looking for long term market peaks you can turn the sensitivity up. Since this indicator works independently from the time frame it's best to check out different setting on different time frames to see how they agree. For example, if you are looking for a lot of trades on the 4 hour charts you can set the sensitively very low, but this might give similar information if you set the sensitivity very high on the 5 minute charts. The next setting that you can change is the signal quality. The tops and bottoms of trending and ranging markets look very different, to account for this you can change how this indicator responds in both types of market by setting the signal quality very high for tending markets and very low for ranging markets, or somewhere in between for potential break out markets.
This indicator works by a proprietary recursive filtering technique that tries to gauge if a top or bottom is forming in real time.
To start your free four day trial please see the link below to receive access and free tutorials for this indicator!
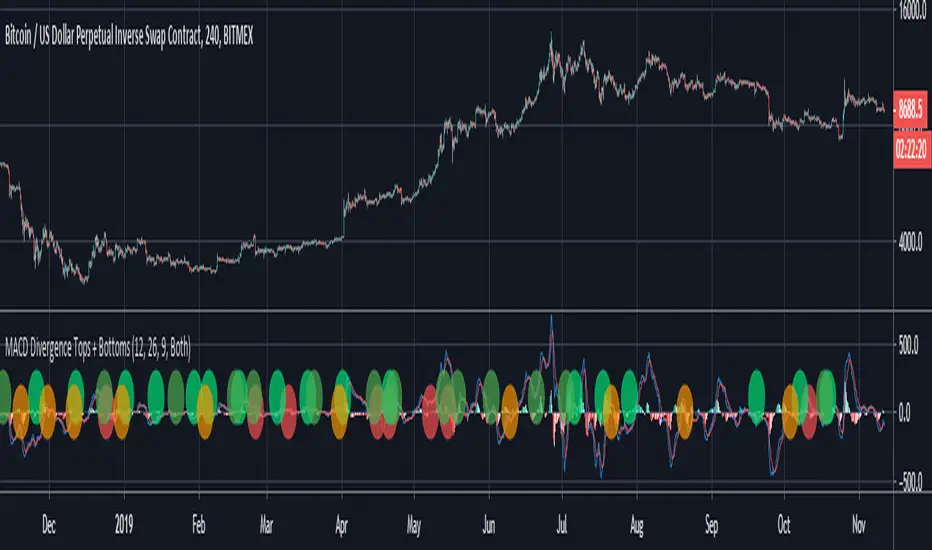
MACD Divergence Tops + BottomsMACD Indicator which plots local peaks and troughs in divergence.
"Classic" Divergence is specified as:
- A higher price, with reduced MACD high --> Potential Sell Point
- A lower price, with higher MACD low --> Potential Buy Point
"Alternative" Divergence is specified as:
- A higher MACD high, with reduced price --> Potential Sell Point
- A lower MACD low, with higher price --> Potential Buy Point
MACD Divergence should be used in combination with other indicators. This indicator identifies local tops and bottoms, with potential for macro trend shifts.
Golden Ratio Fibonacci Multipliers Top Detector [UO]Fibonacci levels that show the critical top and bottom levels. There is no way to miss the top and bottom. And a top detector.
Also the most important SMA lines (SMA 50, 200), EMA21. Those are the most frequently used lines by traders.
This indicator is based on the work of www.tradingview.com
His work set me thinking. Could I also see the bottom using Fibonacci numbers? Yes, of course.
My favorite timeframes with this indicator are 6H, 1D, 3D.
Intensively used for BTC and BNB. And useful for any other coin.

fear&greed by altcoinrookieThis indicator shows extreme moves to find bottoms and tops
Daily use will be more effective
Rookie

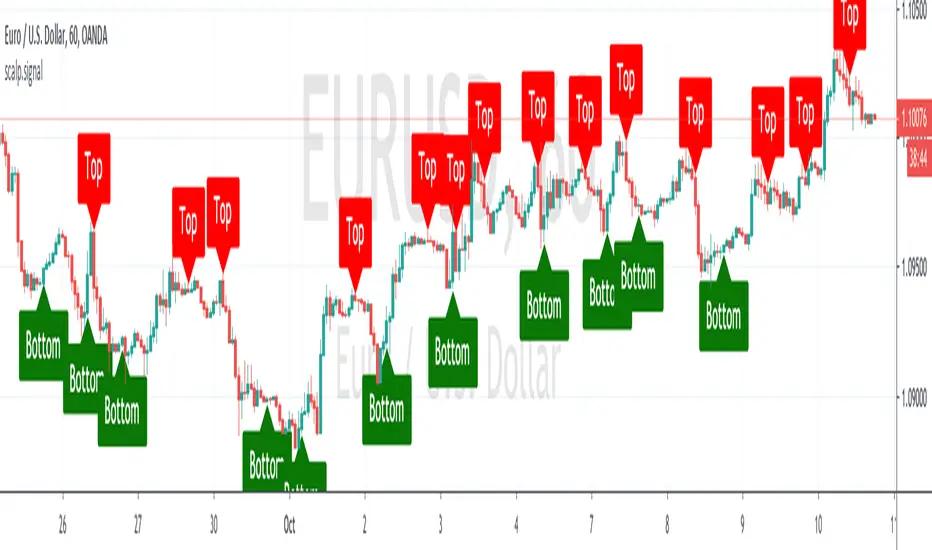
BK Scalp Signal Trader by Boris SchlossbergThis is part 2 of 2 part system of indicators that allows traders to scalp tops and bottoms on intra-day charts
[BERA] KNIFE CUT
Hey beras and bulas, this is my gift for you!
Please message me after you tried my indicators.
This indicator work in sync with SUper BOSS or SB , check it.
KNIFE CUT
Is a special indicator with 2 metrics you can use for be a better trade and stop losing money entering useless positions.
This indicator can:
The Area in the center measure "Market cycles" check below, and "BUY PRESSURE", check the reaction with the price action, impressive? i know.
About the bars green or red, are trend bars, compare it to the price action and you can see that these bars catched all uptrends and downtrends.
(you can change also resolutions of background bars, current H4 resolution if you watch lower timeframes.)
*BUY PRESSURE / TREND BACKGROUND BARS
*MARKET CYCLES
This script work with every exchange and pairs, also forex.
See price history.
You not believe? i believe.

SupercurveGives out top n bottom with the curve its very accurate in any time frame . Will be paid only in few weeks do try it .

RSI Bottom [aamonkey]This is a modified RSI that prints a bottom signal directly on your price chart.
It pulls the data (in the default settings) from the weekly chart no matter on what timeframe you are on.
You can adjust the timeframe and threshold.
Default settings work best for big BTC cycles.

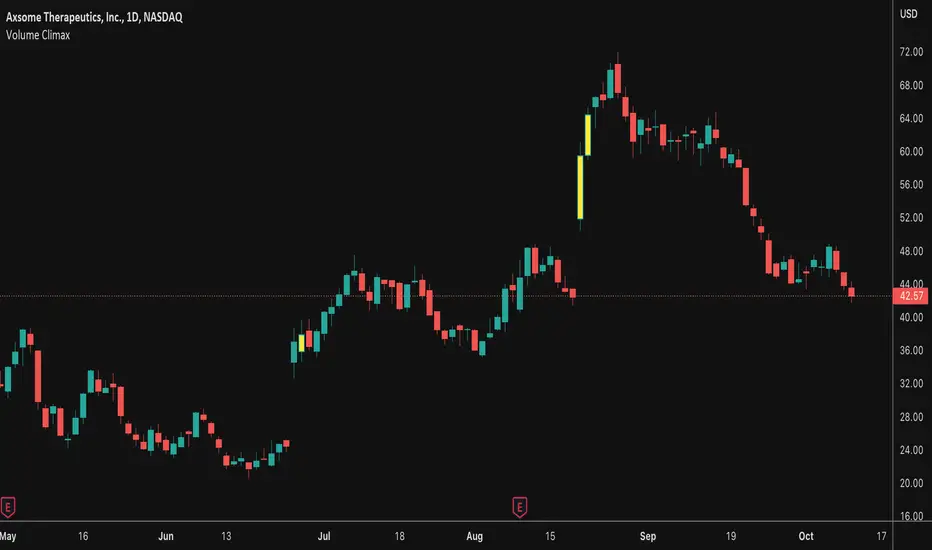
Volume ClimaxThis indicator couples RSI oversold and overbought regions with unusual volume . Often times you will see the final leg of a trend exhaust itself with this volume climax. This indicator is meant to help spot these instances.
User has the ability to customize oversold and overbought regions as well as a multiplier for how much more the volume needs to be relative to the 20 SMA . You can also set an alert with this indicator.
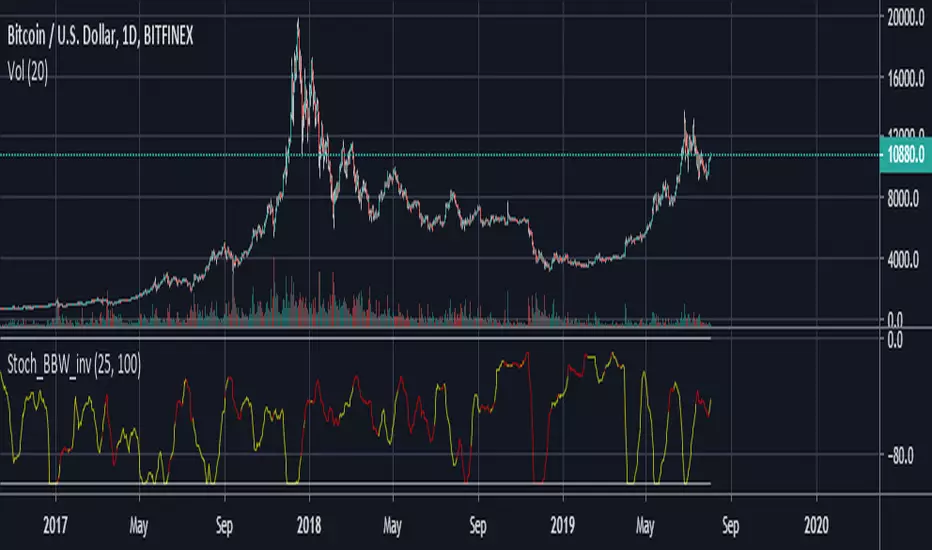
Stoch_BBW_invTop signal: reaches -100 when the color is yellow
Bottom signal: reaches -100 when the color is red
This script calculate a stochastic oscillator of BBW, and defines a top and a bottom as its highest in N bars.
TOP & BOTTOM Cycle [aamonkey]Works best on BTC and only on the daily timeframe!
This is a TOP / BOTTOM indicator for big market cycles.
These tops and bottoms are based on the difference between the 200MA on the daily and the price.


Rounded Bottom Breakout Strategy Moving Averages20-day SMA , 34-day EMA , 50-day SMA and 200-day SMA moving average indicator based on Rick Saddler's Rounded Bottom Reversal Breakout Strategy

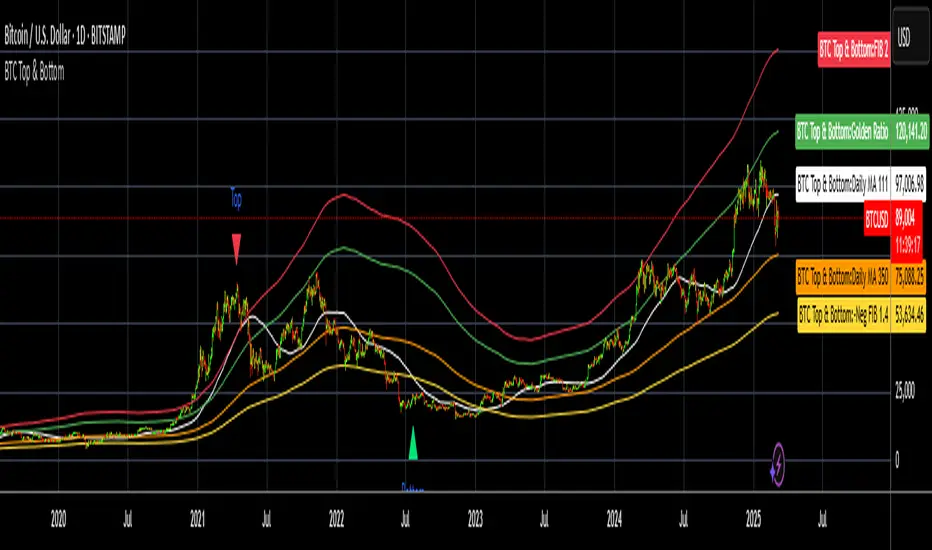
BTC Top and Bottom PickerBTC Top and Bottom Picker
This study predicts BTC tops and bottoms using Bitstamp's daily close data/
It is based on Philip Swift's The Golden Ratio Multiplier post on Medium
In a nutshell:
The top is calculated when 111 daily SMA crossing 350 daily SMA
The bottom is calculated by dividing 350 daily SMA by 1.4
If you like this, please like and share it and follow me.
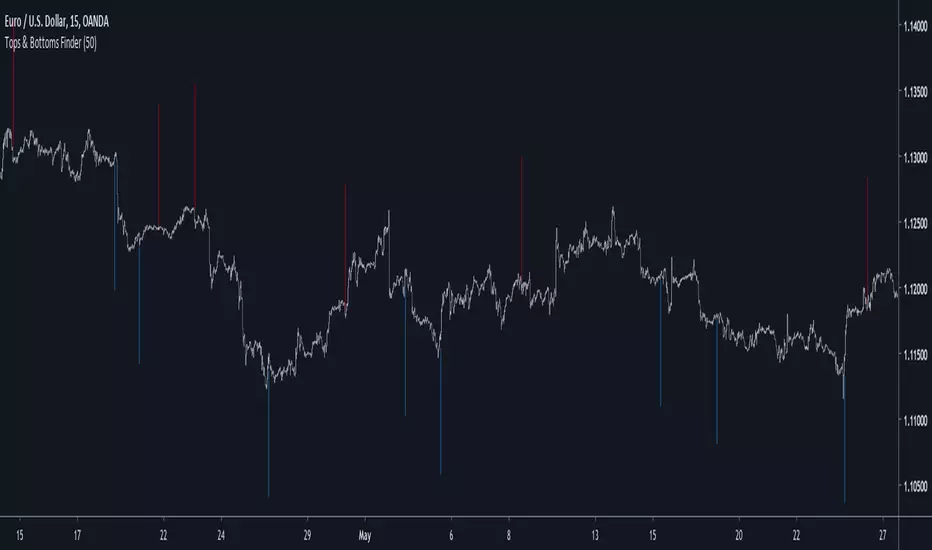
Tops & Bottoms FinderIntroduction
I already shared a method to estimate tops and bottoms (1), the number of parameters could lead to optimization issues so i tried to make a simpler method. In this method i use a simple rescaling method based on individual direction deviation. I will explain further details below.
The Indicator
I use as source for the entire calculation an exponential moving average, the first reaction to this choice would be to think that i wanted to filter signals in order to reduce them, but the truth is that i wanted to have more signals instead, this is because the first calculations involving standard deviations are based on price direction, so by using a smooth input we can get more persistent values in a and b , but its totally up to you to use whatever you want in a , just take into account that less smooth = less signals, this is why i used this calculation process.
a = close and length = 7
a = least squares moving average and length = 25
So you could use pretty much everything you want as input.
Conclusion
The accuracy of such indicators is still relatively low but i presented a way to estimate tops and bottoms without using highest/lowest or differencing thus creating a totally new approach. I encourage you to experiment with it and share your results. If you learned something with this post then i'am happy :)
Notes
Based on several complaints i will have to leave even sooner, i think the 7 of June will be a good day, so if you need something i encourage you to ask me now. With the hope you can understand.
Thanks for reading !
(1)

Double Bottom Pattern IdentifierHello friends,
This script is a powerful, non-repainting detector for the classic Double Bottom pattern — one of the most widely recognized bullish reversal setups. The indicator automatically identifies and tracks developing 'W'-shaped formations in real time, confirming valid entries once the neckline is broken and providing complete trade management features. No manual configuration is needed — it works right out of the box.
🛠 How It Works
It uses advanced techniques involving pivot point analysis and does not rely on other indicators, ensuring robustness and adaptability across different market conditions. When a potential Double Bottom is detected, the indicator marks the pattern points, draws the neckline, and waits for confirmation.
Once confirmed, it generates a 'Long' signal with calculated Take Profit (TP) and Stop Loss (SL) levels.
The script also includes a statistics table summarizing performance metrics — such as the number of patterns, trade results, bar distances, and bottom differences — all dynamically updated on your chart.
🔥 Key Features
Pine Script V6 — optimized logic and performance
Works right out of the box — no setup required
Non-repainting detection
Fully visualized structure — points, neckline, TP, and SL plotted automatically
Multiple TP/SL modes: R/R ratio, ATR-based, percent, points, pips, ticks, or bottom-to-neckline distance
Trailing Stop Loss support
Interactive statistics table with pattern count, trade outcomes, profit ratio, and structural measurements
Smart alert system
Customizable alert messages with placeholders (price, ticker, timeframe, etc.)
Clean, updated UI with improved layout and organization
If you'd like access or have any questions, feel free to reach out to me directly via DM.
👋 Good luck and happy trading!
Script a pagamento

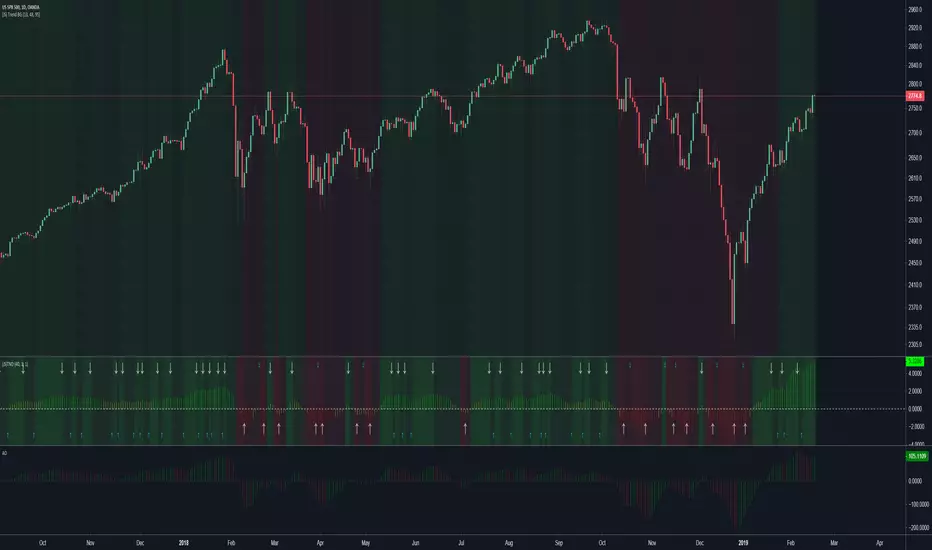
(JS) Tip-and-Dip OscillatorLet me start by saying I know that the name is goofy lol
This is an oscillator that that looks at price action vs. standard deviation in order to illustrate the trend. This thing looks like an Awesome Oscillator but the math behind this and the Awesome Oscillator are totally different (which is pretty interesting, given they look a lot alike). I included the Awesome Oscillator on the chart here so you can look at them and see where they are different.
So the Tip-and Dip Oscillator is meant to help you pinpoint tops and bottoms. I even added arrows where the top and bottom signals are given.
The oscillator itself has 3 colors, an up, down, and neutral color that come as green, red, and yellow. Since the readings given by the oscillator can greatly vary depending on the chart resolution, I included an option to edit the range to fit your chart.
Also - I have 4 different smoothing options that you can use depending on what your preference is. The default setting is the most sensitive so it will identify tops and bottoms more frequently, but it is the most accurate when pinpointing the correct reversal candle. As you smooth it out, the arrows will appear less, but my be slightly delayed and give a later reading. I personally prefer the default, but going up to the second setting in smoothing works nicely as well.
Enjoy!