RAS.V2 Strength Index OscillatorHeavily modified version of my previous "Relative Aggregate Strength Oscillator" -Added high/low lines, alma curves,, lrc bands, changed candle calculations + other small things. Replaces the standard RSI indicator with something a bit more insightful.
Credits to @wolneyyy - 'Mean Deviation Detector - Throw Out All Other Indicators ' And @algomojo - 'Responsive Coppock Curve'
And the default Relative Strength Index
The candles are the average of the MFI ,CCI ,MOM and RSI candles, they seemed similar enough in style to me so I created candles out of each and the took the sum of all the candle's OHLC values and divided by 4 to get an average, same as v1 but with some tweaks. Previous Peaks and Potholes visible with the blue horizontal lines which adjust when a new boundary is established. Toggle alma waves or smalrc curves or both to your liking. This indicator is great for calling out peaks and troughs in realtime, although is best when combined with other trusted indicators to get a consensus.
Boundary

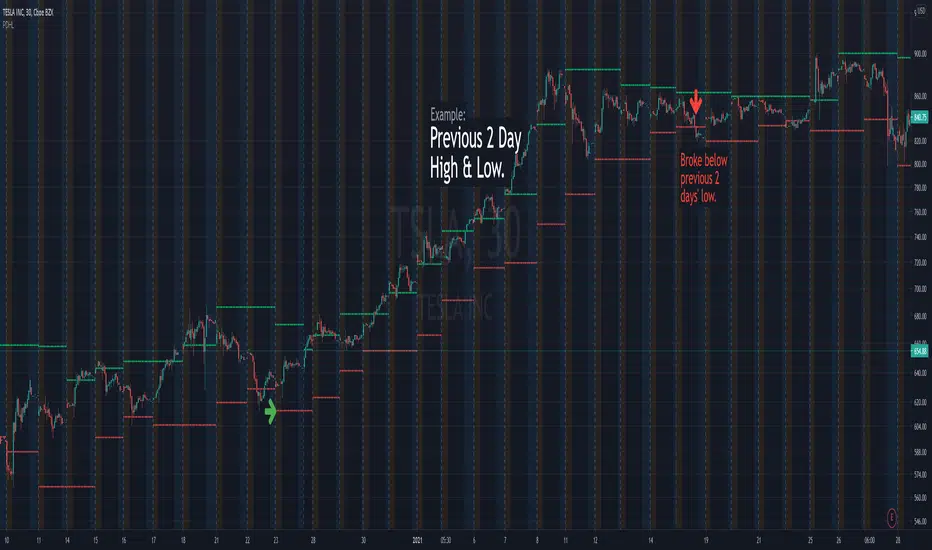
Previous Days High & LowRenders the high and low values from previous days.
Useful alert conditions are provided: "Less than low" and "Greater than high".
Configuration:
The number of days is configurable with a default of 1.
The source of the high and low values.
Use the close value instead of high and low values. Default is false.
The example above uses 2 days to demonstrate an exit strategy.