Break asian range break alerts
- stratégie break ou réintégration possible avec alertes intégrées .
asian range break
Break

HMA 34 Dual-Fractal Projections - VdubusVdubus MacD Divergence Trend Break Signal Generator :Here:-
HMA 18 Dual-Fractal Projections
Overview
The HMA 18 Dual-Fractal Projections is a technical analysis tool designed to identify market structure and potential breakout patterns by analyzing the pivots of a Hull Moving Average (HMA).
Unlike standard trendline indicators that struggle to balance "big picture" trends with immediate price action, this indicator utilizes a Dual-Fractal approach. It simultaneously calculates two separate timelines—Macro and Micro—to visualize both the dominant channel and the developing chart patterns (such as wedges or triangles) in real-time.
Visual Guide
The indicator plots three key elements on the main chart:
The HMA Line (Blue): A smooth, fast-acting moving average (default length 34) that serves as the baseline for all calculations.
Macro Structure (Solid, Thick Lines):
Red (Solid): Major Resistance.
Green (Solid): Major Support.
Purpose: Identifies the long-term trend channel. These lines react slowly and filter out noise.
Micro Structure (Dashed, Thin Lines):
Red (Dashed): Immediate Resistance.
Green (Dashed): Immediate Support.
Purpose: Identifies the short-term market structure. These lines react quickly to show forming wedges, triangles, or flags.
How It Works
The indicator applies a "Pivot High/Low" algorithm directly to the HMA data rather than raw price data. This filters out candle wicks and volatility, ensuring lines are drawn based on established momentum shifts.
Layer 1 (Macro): Uses a large "Lookback" period (default 44 bars) to find significant peaks and valleys. It connects the most recent major pivot to the previous one, projecting a line forward to show where the major trend channel lies.
Layer 2 (Micro): Uses a small "Lookback" period (default 10 bars) to find local peaks and valleys. This allows you to see how price is behaving within the larger channel.
Settings & Configuration
HMA Settings
HMA Length: The length of the Hull Moving Average.
Default: 34 (Matches the "visually pleasing" setting from recent testing).
Note: Set to 18 for a faster, more reactive baseline (scalping).
Layer 1: Macro (Big Channel)
Macro Lookback: Determines how many bars must pass before a peak is confirmed.
Default: 44. High values find broad, established channels.
Max Macro Lines: How many historical lines to keep on the chart.
Default: 1 (Keeps the chart clean, showing only the current structure).
Extend Macro Lines: Projects the lines infinitely to the right to predict future support/resistance zones.
Layer 2: Micro (Current Pattern)
Micro Lookback: A lower sensitivity setting to catch immediate structure.
Default: 10. Low values will pinpoint the exact boundaries of small wedges or flags forming right now.
Trading Strategy & Interpretation
1. The "Squeeze" (Wedge Identification) This is the primary use case.
Look for scenarios where the Macro Lines (Solid) are wide/parallel, but the Micro Lines (Dashed) are rapidly converging (pointing towards each other).
This indicates that while the main trend is intact, momentum is compressing. A breakout is imminent where the dashed lines intersect.
2. Trend Channels
When both Solid and Dashed lines are roughly parallel and sloping in the same direction, the trend is healthy and strong. Price is respecting both the short-term and long-term momentum.
3. Divergence / Early Reversal Warning
If the Macro Line is sloping UP, but the Micro Line starts sloping DOWN (crossing inside), it indicates a loss of momentum and a potential reversal before the price actually breaks the major trendline.
===========================================================================
2. Micro/Macro Cross Alert
A new input, Enable Micro/Macro Cross Alert, has been added under the "Alerts & Features" section.
This alert condition is triggered when the momentum of the Micro Structure exceeds the momentum of the Macro Structure, which is a high-probability signal for a breakout:
Bullish Alert: The Micro High (dashed red line) crosses above the Macro High (solid red line).
Bearish Alert: The Micro Low (dashed green line) crosses below the Macro Low (solid green line).
To set up the actual alert on your chart:
Right-click on the chart.
Select "Add alert on HMA 34 Dual-Fractal Projections".
In the Condition dropdown, select the indicator's name.
For the main alert criteria, choose "Any alert()".
Select your preferred alert actions (e.g., notification, email).

Range breaking indicatorDescription
Bull/Bear Area Ratio (last N candles) helps identify potential end-of-range situations by analyzing the relative strength of bullish vs bearish candles over a rolling window of N bars.
Instead of simply counting up or down candles, this script measures the "area" of each candle — the absolute distance between open and close, optionally weighted by volume.
By summing these areas over the last N bars, it calculates the percentage of bullish and bearish energy within that period.
When both sides become balanced (near 50/50), it often signals range exhaustion or possible trend transition.
How it works
Calculates the bullish and bearish area of each candle (abs(close - open), optionally × volume).
Maintains rolling buffers of the last N bars to compute running totals.
Plots both Bullish % (green) and Bearish % (red).
Highlights possible range-ending zones when the bullish ratio nears 50% ± threshold.
Displays a label showing the current balance.
Includes an alert condition when equilibrium is detected.
Inputs
Number of candles (N) – Rolling window length.
Use volume weighting – Multiplies each candle’s area by its volume.
Balance threshold (%) – Sensitivity for detecting equilibrium (default: 10%).
Best use
Combine with volume or volatility indicators to confirm market compression or expansion.
Use on higher timeframes (H1, H4, D1) to detect early signs of accumulation or distribution.
Works across all asset types: crypto, forex, stocks, indices, etc.
Alerts
An alert is triggered when:
“The range of the last N candles is balanced (possible end of range).”

Continuation Suite v1 — 5m/15mContinuation Suite v1 — 5m/15m (Non-Repainting, S/R + Trend Continuation)
What it does
Continuation Suite v1 is a practical intraday toolkit that combines non-repainting trend-continuation signals with auto-built Support/Resistance (S/R) from confirmed pivots. It’s designed for fast, liquid names on 5m charts with an optional 15m higher-timeframe (HTF) overlay. You get: stacked-EMA bias, disciplined pullback+reclaim entries, optional volume/volatility gates, a “Strong” signal tier, solid S/R lines or zones, and a compact dashboard for fast reads.
⸻
Why traders use it
• Clear bias using fast/mid/slow EMA stacking.
• Actionable entries that require a pullback, a reclaim, and (optionally) a minor break of prior extremes.
• Signal quality gates (volume vs SMA, ATR%, ADX/DI alignment, EMA spacing, slope).
• Non-repainting logic when “Confirm on Close” = ON. Intrabar previews show what’s forming, but confirmed signals only print on bar close.
• S/R that matters: confirmed-pivot lines or ATR-sized zones, optional HTF overlay, and auto de-dup to avoid clutter.
⸻
Signal construction (no magic, just rules)
Bullish continuation (base):
1. Trend: EMA fast > EMA mid > EMA slow
2. Pullback: price pulls into the stack (lowest low or close vs EMA fast/mid over a lookback)
3. Reclaim: close > EMA fast and close > open
4. Break filter (optional): current bar takes out the prior bar’s high
5. Filters: volume > SMA (if enabled) and ATR% ≤ max (if enabled)
6. Cooldown: a minimum bar gap between signals
Bearish continuation (base): mirror of the above.
Strong signals: base conditions plus ADX ≥ threshold, DI alignment (DI+>DI- for longs; DI->DI+ for shorts), minimum EMA-spacing %, and minimum fast-EMA slope.
Reference stops:
• Longs: lowest low over the pullback lookback
• Shorts: highest high over the pullback lookback
Alerts are included for: Bullish Continuation, Bearish Continuation, STRONG Bullish, STRONG Bearish.
⸻
S/R engine (current TF + optional HTF)
• Builds S/R from confirmed pivots only (left/right bars).
• Choose Lines (midlines) or Zones (ATR-sized).
• Zones merge when a new pivot lands near an existing zone’s mid (ATR-scaled epsilon).
• Touches counter tracks significance; you can require a minimum to draw.
• HTF overlay (default 15m) draws separate lines/zones with tiny TF tags on the right.
• De-dup option hides current-TF zones that sit too close to HTF zones (ATR-scaled), reducing overlap.
• Freeze on Close (optional) keeps arrays stable intrabar; snapshots show levels immediately as bars open.
⸻
Presets
• Auto: Detects QQQ-like tickers (QQQ, QLD, QID) or SoFi; else defaults to Custom.
• QQQ: Tighter ATR% and EMA settings geared to index-ETF behavior.
• SoFi: Wider ATR allowances and longer mid/slow for single-name behavior.
• Custom: Expose all key inputs to tune for your product.
⸻
Dashboard (top-right)
• Preset in use
• Bias (Bullish CONT / Bearish CONT / Neutral)
• Strong (Yes/No)
• Volatility (ATR% bucket)
• Trend (ADX bucket)
• HTF timeframe tag
• Volume (bucket or “off”)
• Signals mode (Close-Confirmed vs Intrabar)
⸻
Inputs you’ll actually adjust
Trend/Signals
• Fast/Mid/Slow EMA lengths
• Pullback lookback, Min bars between signals
• Volume filter (vol > SMA N)
• ATR% max filter (cap excessive volatility)
• Require break of prior bar’s high/low
• “Strong” gates: min EMA slope, min EMA spacing %, ADX length & threshold
Support/Resistance
• Lines vs Zones
• Pivot left/right bars
• Extend left/right (bars)
• Max pivots kept (current & HTF)
• Zone width (× ATR), Merge epsilon (× ATR), Min gap (× ATR)
• Min touches, Max zones per side near price
• De-dup current TF vs HTF (× ATR)
Repainting control
• Confirm on Close: when ON, signals/SR finalize on bar close (non-repainting)
• Freeze on Close: freeze S/R intrabar with snapshot updates
• Show previews: translucent intrabar labels for what’s forming
⸻
How to use it (straightforward)
1. Load on 5-minute chart (baseline). Keep Confirm on Close ON if you hate repainting.
2. Use Bias + Strong + S/R context. If a long prints into HTF resistance, you have information.
3. Manage risk off the reference stop (pullback extreme). If ATR% reads “Great,” widen expectations; if “Poor,” size down or pass.
4. Alerts: wire the four alert types to your workflow.
⸻
Notes and constraints
• Designed for liquid symbols. Thin books and synthetic “volume” will degrade the volume gate.
• S/R is pivot-based. On very choppy tape, touch counts help. Increase min touches or switch to Lines to declutter.
• If your chart timeframe isn’t 5m, behavior changes because lengths are in bars, not minutes. Tune lengths accordingly.
⸻
Disclaimers
This is a research tool. No signals are guaranteed. Markets change, outliers happen, slippage is real. Nothing here is financial advice—use your own judgment and risk management.
⸻
Author: DaddyScruff
License: MPL-2.0 (Mozilla Public License 2.0)

Smart Structure Breaks & Order BlocksOverview (What it does)
The indicator “Smart Structure Breaks & Order Blocks” detects market structure using swing highs and lows, identifies Break of Structure (BOS) events, and automatically draws order blocks (OBs) from the origin candle. These zones extend to the right and change color/outline when mitigated or invalidated. By formalizing and automating part of discretionary analysis, it provides consistent zone recognition.
Main Components
Swing Detection: ta.pivothigh/ta.pivotlow identify confirmed swing points.
BOS Detection: Determines if the recent swing high/low is broken by close (strict mode) or crossover.
OB Creation: After a BOS, the opposite candle (bearish for bullish BOS, bullish for bearish BOS) is used to generate an order block zone.
Zone Management: Limits the number of zones, extends them to the right, and tracks tagged (mitigated) or invalidated states.
Input Parameters
Left/Right Pivot (default 6/6): Number of bars required on each side to confirm a swing. Higher values = smoother swings.
Max Zones (default 4): Maximum zones stored per direction (bull/bear). Oldest zones are overwritten.
Zone Confirmation Lookback (default 3): Ensures OB origin candle validity by checking recent highs/lows.
Show Swing Points (default ON): Displays triangles on swing highs/lows.
Require close for BOS? (default ON): Strict BOS (close required) vs loose BOS (line crossover).
Use candle body for zones (default OFF): Zones drawn from candle body (ON) or wick (OFF).
Signal Definition & Logic
Swing Updates: Latest confirmed pivots update lastHighLevel / lastLowLevel.
BOS (Break of Structure):
Bullish – close breaks last swing high.
Bearish – close breaks last swing low.
Only one valid BOS per swing (avoids duplicates).
OB Detection:
Bullish BOS → previous bearish candle with lowest low forms the OB.
Bearish BOS → previous bullish candle with highest high forms the OB.
Zones: Bull = green, Bear = red, semi-transparent, extended to the right.
Zone States:
Mitigated: Price touches the zone → border highlighted.
Invalidated:
Bull zone → close below → turns red.
Bear zone → close above → turns green.
Chart Appearance
Swing High: red triangle above bar
Swing Low: green triangle below bar
Bull OB: green zone (border highlighted on touch)
Bear OB: red zone (border highlighted on touch)
Invalid Zones: Bull zones turn reddish, Bear zones turn greenish
Practical Use (Trading Assistance)
Trend Following Entries: Buy pullbacks into green OBs in uptrends, sell rallies into red OBs in downtrends.
Focus on First Touch: First mitigation after BOS often has higher reaction probability.
Confluence: Combine with higher timeframe trend, volume, session levels, key price levels (previous highs/lows, VWAP, etc.).
Stops/Targets:
Bull – stop below zone, partial take profit at swing high or resistance.
Bear – stop above zone, partial take profit at swing low or support.
Parameter Tuning (per market/timeframe)
Pivot (6/6 → 4/4/8/8): Lower for scalping (3–5), medium for day trading (5–8), higher for swing trading (8–14). Increase to reduce noise.
Strict Break: ON to reduce false breaks in ranging markets; OFF for earlier signals.
Body Zones: ON for assets with long wicks, OFF for cleaner OBs in liquid instruments.
Zone Confirmation (default 3): Increase for stricter OB origin, fewer zones.
Max Zones (default 4 → 6–10): Increase for higher volatility, decrease to avoid clutter.
Strengths
Standardizes BOS and OB detection that is usually subjective.
Tracks mitigation and invalidation automatically.
Adaptable: allows body/wick zone switching for different instruments.
Limitations
Pivot-based: Signals appear only after pivots confirm (slight lag).
Zones reflect past balance: Can fail after new events (news, earnings, macro data).
Range-heavy markets: More false BOS; consider stricter settings.
Backtesting: This script is for drawing/visual aid; trading rules must be defined separately.
Workflow Example
Identify higher timeframe trend (4H/Daily).
On lower TF (15–60m), wait for BOS and new OB.
Enter on first mitigation with confirmation candle.
Stop beyond zone; targets based on R multiples and swing points.
FAQ
Q: Why are zones invalidated quickly?
A: Flow reversal after BOS. Adjust pivots higher, enable Strict mode, or switch to Body zones to reduce noise.
Q: What does “tagged” mean?
A: Price touched the zone once = mitigated. Implies some orders in that zone may have been filled.
Q: Body or Wick zones?
A: Wick zones are fine in clean markets. For volatile pairs with long wicks, body zones provide more realistic areas.
Customization Tips (Code perspective)
Zone storage: Currently ring buffer ((idx+1) % zoneLimit). Could prioritize keeping unmitigated zones.
Automated testing: Add strategy.entry/exit for rule-based backtests.
Multi-timeframe: Use request.security() for higher timeframe swings/BOS.
Visualization: Add labels for BOS bars, tag zones with IDs, count touches.
Summary
This indicator formalizes the cycle Swing → BOS → OB creation → Mitigation/Invalidation, providing consistent structure analysis and zone tracking. By tuning sensitivity and strictness, and combining with higher timeframe context, it enhances pullback/continuation trading setups. Always combine with proper risk management.

Auto Support Resistance Channels [TradingFinder] Top/Down Signal🔵 Introduction
In technical analysis, a price channel is one of the most widely used tools for identifying and tracking price trends. A price channel consists of two parallel trendlines, typically drawn from swing highs (resistance) and swing lows (support). These lines define dynamic support and resistance zones and provide a clear framework for interpreting price fluctuations.
Drawing a channel on a price chart allows the analyst to more precisely identify entry points, exit levels, take-profit zones, and stop-loss areas based on how the price behaves within the boundaries of the channel.
Price channels in technical analysis are generally categorized into three types: upward channels with a positive slope, downward channels with a negative slope, and horizontal (range-bound) channels with near-zero slope. Each type offers unique insights into market behavior depending on the price structure and prevailing trend.
Structurally, channels can be formed using either minor or major pivot points. A major channel typically reflects a stronger, more reliable structure that appears on higher timeframes, whereas a minor channel often captures short-term fluctuations or corrective movements within a larger trend.
For instance, a major downward channel may indicate sustained selling pressure across the market, while a minor upward channel could represent a temporary pullback within a broader bearish trend.
The validity of a price channel depends on several factors, including the number of price touches on the channel lines, the symmetry and parallelism of the trendlines, the duration of price movement within the channel, and price behavior around the median line.
When a price channel is broken, it is generally expected that the price will move in the breakout direction by at least the width of the channel. This makes price channels especially useful in breakout analysis.
In the following sections, we will explore the different types of price channels, how to draw them accurately, the structural differences between minor and major channels, and key trade interpretations when price interacts with channel boundaries.
Up Channel :
Down Channel :
🔵 How to Use
A price channel is a practical tool in technical analysis for identifying areas of support, resistance, trend direction, and potential breakout zones. The structure consists of two parallel trendlines within which price fluctuates.
Traders use the relative position of price within the channel to make informed trading decisions. The two primary strategies include range-based trades (buying low, selling high) and breakout trades (entering when price exits the channel).
🟣 Up Channel
In an upward channel, price moves within a positively sloped range. The lower trendline acts as dynamic support, while the upper trendline serves as dynamic resistance. A common strategy involves buying near the lower support and taking profit or selling near the upper resistance.
If price breaks below the lower trendline with strong volume or a decisive candle, it can signal a potential trend reversal. Channels constructed from major pivots generally reflect dominant uptrends, while those based on minor pivots are often corrective structures within a broader bearish movement.
🟣 Down Channel
In a downward channel, price moves between two negatively sloped lines. The upper trendline functions as resistance, and the lower trendline as support. Ideal entry for short trades occurs near the upper boundary, especially when confirmed by bearish price action or a resistance level.
Exit targets are typically located near the lower support. If the upper boundary is broken to the upside, it may be an early sign of a bullish trend reversal. Like upward channels, a major down channel represents broader selling pressure, while a minor one may indicate a brief retracement in a bullish move.
🟣 Range Channel
A horizontal or range-bound channel is characterized by price oscillating between two nearly flat lines. This type of channel typically appears during sideways markets or periods of consolidation.
Traders often buy near the lower boundary and sell near the upper boundary to take advantage of contained volatility. However, fake breakouts are more frequent in range-bound structures, so it is important to wait for confirmation through candlestick signals and volume. A confirmed breakout beyond the channel boundaries can justify entering a trade in the direction of the breakout.
🔵 Settings
Pivot Period :This parameter defines how sensitive the channel detection is. A higher value causes the algorithm to identify major pivot points, resulting in broader and longer-term channels. Lower values focus on minor pivots and create tighter, short-term channels.
🔔 Alerts
Alert Configuration :
Enable or disable the full alert system
Set a custom alert name
Choose the alert frequency: every time, once per bar, or on bar close
Define the time zone for alert timestamps (e.g., UTC)
Channel Alert Types :
Each channel type (Major/Minor, Internal/External, Up/Down) supports two alert types :
Break Alert : Triggered when price breaks above or below the channel boundaries
React Alert : Triggered when price touches and reacts (bounces) off the channel boundary
🎨 Display Settings
For each of the eight channel types, you can customize:
Visibility : show or hide the channel
Auto-delete previous channels when new ones are drawn
Style : line color, thickness, type (solid, dashed, dotted), extension (right only, both sides)
🔵 Conclusion
The price channel is a foundational structure in technical analysis that enables traders to analyze price movement, identify dynamic support and resistance zones, and locate potential entry and exit points with greater precision.
When constructed properly using minor or major pivots, a price channel offers a consistent and intuitive framework for interpreting market behavior—often simpler and more visually clear than many other technical tools.
Understanding the differences between upward, downward, and range-bound channels—as well as recognizing the distinctions between minor and major structures—is critical for selecting the right trading strategy. Upward channels tend to generate buying opportunities, downward channels prioritize short setups, and horizontal channels provide setups for both mean-reversion and breakout trades.
Ultimately, the reliability of a price channel depends on various factors such as the number of touchpoints, the duration of the channel, the parallelism of the lines, and how the price reacts to the median line.
By taking these factors into account, an experienced analyst can effectively use price channels as a powerful tool for trend forecasting and precise trade execution. Although conceptually simple, successful application of price channels requires practice, pattern recognition, and the ability to filter out market noise.

D|W|M|Y Breaks with NY TimezoneThis indicator plots breaks for multiple timeframes: Daily, Weekly, Monthly, Quarterly, Half Yearly, Yearly.
I also added the option to change timezone to New York to see the week the ICT way ;)

Support and Resistance (High Volume Boxes) [ChartPrime]Support and Resistance (High Volume Boxes)
◆ Overview:
The "Support and Resistance" indicator identifies key support and resistance levels using pivot points and volume analysis. It visually represents these levels with dynamically colored boxes, indicating the strength of the volume. This helps traders recognize potential price reversals and key zones for buy and sell opportunities.
◆ Key Features:
Dynamic Support and Resistance Boxes:
The indicator plots support and resistance boxes based on pivot points and volume above threshold for positive volume boxes and below lower threshold for negative volume boxes.
Box colors change from transparent to more intense based on volume, reflecting the strength of support or resistance.
Boxes expands until a new box of the same type appears.
Volume-Based Color Coding:
Boxes are color-coded based on the amount of volume:
Green boxes indicate support levels with positive volume.
Red boxes indicate resistance levels with negative volume.
Hold Signals:
Green diamonds (◆) indicate when support holds, signaling potential buy opportunities.
Red diamonds (◆) indicate when resistance holds, signaling potential sell opportunities.
Breakout Labels:
If the price falls below a support level, that level will become resistance. If the price rises above a resistance level, it will often become support. As the price moves past a level of support or resistance, it is thought that supply and demand has shifted, causing the breached level to reverse its role.
Labels "Break Sup" and "Break Res" are displayed when support or resistance levels are broken, indicating significant market movements.
◆ Break Resistance:
◆Break Support:
◆ Usage Notes:
This indicator helps traders identify strong support and resistance levels, offering visual cues for potential price reversals.
By analyzing volume at these levels, traders can gauge the strength of these zones and make more informed trading decisions.
◆ Settings:
Lookback Period: The number of bars to look back for pivot points.
Delta Volume Filter Length: The length of the volume filter for more accurate volume analysis. (Higher input, will filter low volume boxes)
Adjust Box Width: Adjusts the width of the support and resistance boxes.
This indicator is designed to enhance your trading by providing clear visual cues for support and resistance levels based on volume, making it easier to spot potential price reversals and key trading opportunities.

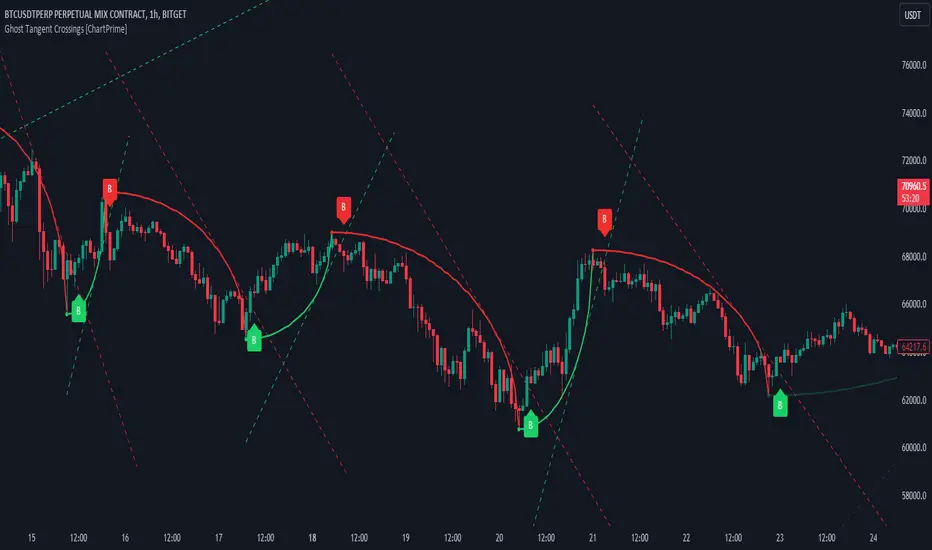
Ghost Tangent Crossings [ChartPrime]Ghost Tangent Crossings (ChartPrime) is a revolutionary way to visualize pivot points and zig-zag patterns that utilizes ellipses. This indicator makes sure that each pivot is plotted from high to low, ensuring a correct zig-zag wave pattern. Before a zig-zag is confirmed Ghost Tangent Crossings (ChartPrime) plots an estimate of the next valid move allowing you to plan well ahead of time. Once it is confirmed, the indicator will fill in the plot with a solid color and print a break label.
Unlike other zig-zag or pivot point indicators, Ghost Tangent Crossings (ChartPrime) only has a pivot lookforward input. This is because the lookback is automatically adjusted based on the last known zig-zag. This allows the indicator to dynamically look for the most recent valid market movement. The equipoint is calculated as the point along the ellipse with an equal change in price on either side. From this point we plot a line with the slope at that location and when the price breaks this level a break label is plotted. Alternatively you can plot this point as a horizontal line. This area works as support and resistance for the market as its the point where the balance in movement is found. We feel that this is a simple and elegant solution to connected zig-zag patterns that utilizes a novel method of visualization that many traders will find useful. With its simple controls and intuitive style, we believe that Ghost Tangent Crossings (ChartPrime) will find a home on most traders charts.
To use Ghost Tangent Crossings (ChartPrime) simply add it to your chart and adjust the lookforward to your taste. From there you can adjust the color of the zig-zags and enable or disable any of the visual features. We have included both wick and body pivot types to accommodate most trading style. From there, you are all done and ready to trade!
Enjoy
Pivotal MomentsPivotal Moments draws lines for each of up to 500 pivot high and pivot low levels that have never been revisited at the present moment in time. After the Pivotal Moments indicator has been loaded onto chart and any of the subsequent realtime bars that are formed touch or cross a pivot level it is deleted. The duration for how long any touched or crossed pivot levels remain on chart before deletion may be extended by N bars or N units of time.
There are user selectable options for the following:
• Pivot Bars Left : the number of lower highs or higher lows that must be formed before a possible pivot bar can occur.
• Right : the number of lower highs or higher lows that must be formed after potential pivot to validate a pivot bar.
• Lines Show As : the choice of line style to use for the drawn pivot levels includes Dashed, Dotted, or Solid.
• Wide : the number of lines wide for how thick the drawn pivot levels are desired to be on the chart.
• Delay Removal : the number of units that touched or crossed pivot levels will persist on chart.
• Units : the choice of which delay unit type includes nBars, nSecs, nMins, nHrs, or nDays.
• Extend Right : the number of bars right of current bar to extend drawn pivot levels.
• Show : the number of maximum recent drawn pivot levels to keep on chart.
• Colors Used : the colors used for pivots high, low, and dual pivot bars.
• Show Price Labels : the choice whether to show prices for levels.
• On Right : the choice to move prices to right of pivot levels.
• Show Pivot Bars : the choice to colorize pivot bars.
If desired, alerts can be received for whenever new touches or crosses occur for both pivot highs and pivot lows by creating a single Alert. Note that these alerts are triggered by realtime bars which by their very nature are repainting prices, thus the alert creation window will warn of this with an orange exclamation symbol. For an illustration of how to create alerts for this indicator click the chart below:
Credit: this indicator was originally built for @Luckshury, who has graciously given me permission to publish it publicly.
NOTICE: This is an example script and not meant to be used as an actual strategy. By using this script or any portion thereof, you acknowledge that you have read and understood that this is for research purposes only and I am not responsible for any financial losses you may incur by using this script!

Lunch-BreakThis script is only for Lunch breaks of London, NYSE and Tokyo session for those who don't want to trade between in these times.

Day/Week/Month/3M/6M/12M MTF breaks by makuchakuThis indicator plots breaks for multiple timeframes. Works on Daily to Yearly timeframes.
Currently supported timeframes :
Daily
Weekly
Monthly
Quarterly
Half Yearly
Yearly
It currently plots all breaks together. From Indicator settings hide what you don't need and save as default settings.

Support Resistance ChannelsHello All,
For Long time I was planning to make Support/Resistance Channels script, finally I had time and here it is.
How this script works?
- it finds and keeps Pivot Points
- when it found a new Pivot Point it clears older S/R channels then;
- for each pivot point it searches all pivot points in its own channel with dynamic width
- while creating the S/R channel it calculates its strength
- then sorts all S/R channels by strength
- it shows the strongest S/R channels, before doing this it checks old location in the list and adjust them for better visibility
- if any S/R channel was broken on last move then it gives alert and put shape below/above the candle
- The colors of the S/R channels are adjusted automatically
You can set/change following settings:
- Pivot Period
- Source : High/Low or Close/Open can be used
- Maximum Channel Width %: this is the maximum channel width rate, this is calculated using Highest/Lowest levels in last 300 bars
- Number of S/R to show : this is the number of Strongest S/R to show
- Loopback Period: While calculating S/R levels it checks Pivot Points in LoopBack Period
- Show S/R on last # Bars: To see S/R levels only on last N bars
- Start Date: the script starts calculating Pivot Point from this date, the reason I put this option is for visuality. Explained below
- You can set colors/transparency
- and You can enable/disable shapes for broken S/R levels
Examples:
You can change colors as you wish:
here " Show S/R on last # Bars " set 100:
Sometimes visuality may corrupt because of old S/R levels, to solve it you need to set "Start Date" in the options to start the script in visual part (last 292 bars)
here in first screenshot it doesn't look good (shrink), then on second screenshot I set the "Start Date" it looks better, if you change time frame don't forget to set it again :)
Enjoy!

Trend Lines for RSI, CCI, Momentum, OBVHello Traders!
After publishing Trend Lines for RSI yesterday, I realized that Trend Lines for more indicators needed by the traders. so I decided to make it for four different indicators: RSI, CCI, OBV, Momentum
In the indicator options you can choose the indicator from pull-down menu.
How it works?
- On each bar it finds last 10 higher and lower Pivot Points (PP) for the indicator.
- from first bar to 10. Pivot Point it searchs if a trend line is possible
- for each PP it starts searching from the last PP .
- it checks if drawing a trend line possible or not and also it's broken or not
- if it's broken then optionally it shows broken trend lines as dotted (or you can option not to see broken lines)
- if it finds a continues trend line then it stops searhing more and draw trend line, this is done by checking angles (I did this to make the script faster, otherwise you may get error because of it needs time more than .2sec)
- the script makes this process for each PP
- then shows the trend lines
P.S. it may need 3-10 seconds when you added the script to the chart at first (because of calculations)
Trend lines for CCI:
Trend Lines for OBV
Trend Lines for Momentum:
You may want to watch how Trend Lines script works (that was made for RSI)
s3.tradingview.com
If you still didn't see Trend Lines v2 then visit:
All Comments are welcome..
Enjoy!

Trend Lines v2Hello Everyone. After working on new and better trend lines script for couple of weeks, finally I am proud to publish Trend Lines v2.
How it works?
- On each bar it finds last 10 higher and lower Pivot Points (PP).
- from first bar to 10. PP it search if a trend line is possible
- for each it starts searching from the last PP.
- it check if drawing a trend line possible or not and also it's broken or not
- if it's broken then optionally it shows broken trend lines as dotted
- if it finds a continues trend line and stop searhing more and draw trend line (I did this to make the script faster, otherwise you may get error because of it needs time more than .2sec)
- the script makes this process for each PP
optionally trend lines may be Solid or Dashed
optionally you may get rid of broken trend lines if you think it's crowded
and sometimes you may not see any trend line on the chart. this means you need to adjust the period for Pivot Points accordingly
also I made a video. if you watch this video you can see how the script works.
Important! after you add this tool to the chart you may need zoom-in and zoom-out to see all lines!
I thought a lot to make it free or not then I decided make it free and open source. you should know there is a lot of effort for this script, so if you think this is usefull please consider a donation ;)
Enjoy!

Month breaksA very simple indicator that marks the start of every month with a vertical line. But default the vertical line is gray with 80% transparency but you can customize the style/color/transparency as you like.
I hate crowded charts, bloated with all kind of crazy shapes and I created this indicator for two main reasons:
1. beginning/end of the month is an excellent pivot-point
2. to be simple, easy to customize and non-intrusive with the underlying chart
See the attached EURUSD daily chart, at the beginning of every month the price pivoted up and down, can you figure out what happens at the end of Dec 2019?
Trade long and prosper!!!

Market StructureSimple script to Plot Horizontal Lines at turning points of the market. Often times, these key levels can indicate a potential trade when price breaks above/below.
Breakout IndicatorThis script allows you to set breakout alerts.
An alert will be triggered only when price breaks and closes beyond the specified prices. You will get an alert on the first candle that closes beyond the levels you set.
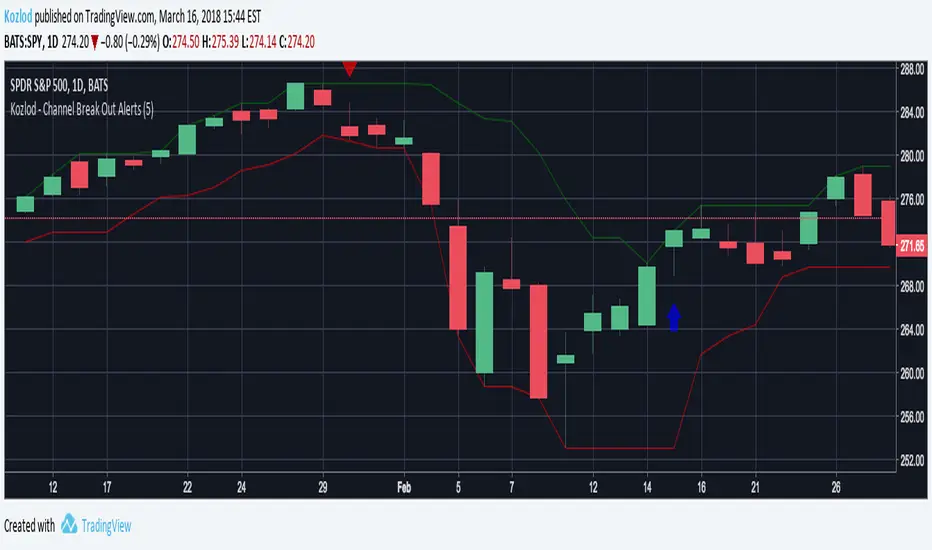
Kozlod - Channel Break Out AlertsStudy version with alerts of standard "Channel Break Out Strategy".
[JR] Multi Bollinger Heat Bands - EMA/Breakout optionsA little, yet hopefully useful update over my previous "Multi Bollinger Heat Bands". For those who like quick visual cue's.
In short: It's your Basic Bollinger Bands, but 3 of them, and some pointy things.
In full:
Three stacked SMA based Bollinger Bands designed just to give you a quick visual on the "heat" of movement.
Set inner band as you would expect, then set your preferred additional multiplier increments for the outer 2 bands.
Option to use EMA as alternative basis, rather than SMA.
Breakout indication shapes, which have their own multiplier (but still tied to same length/period as the BB's) so you can make them pop on their own separate "band".

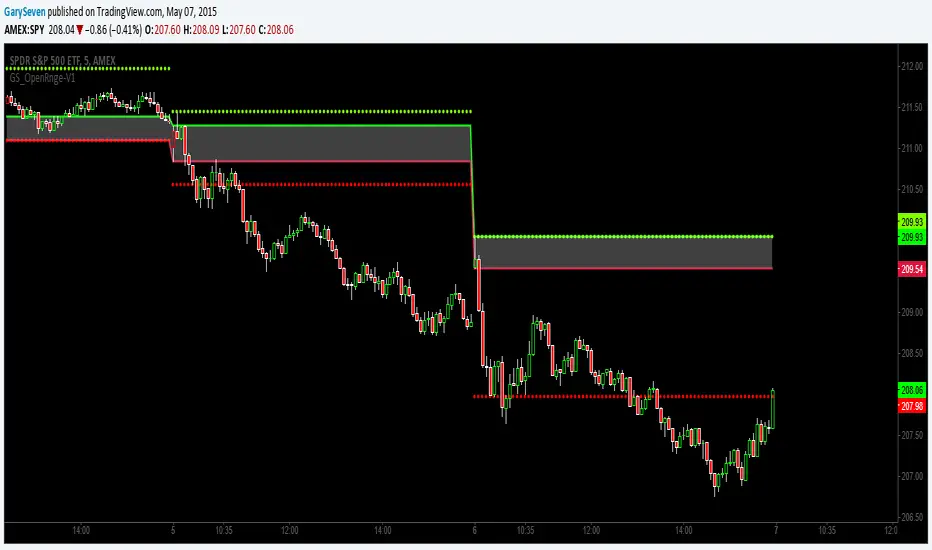
GS_Opening-Range-V1ORB Opening Range Breakout 5 and 3O Minute Indicator
Kudos to Chris Moody for the inspiration to create my first indicator.
The 5 and 30 run together at times but the scalp would be when the equity breaks the 5 go long or short for the scalp and when it breaks the 30 go for the swing trade.
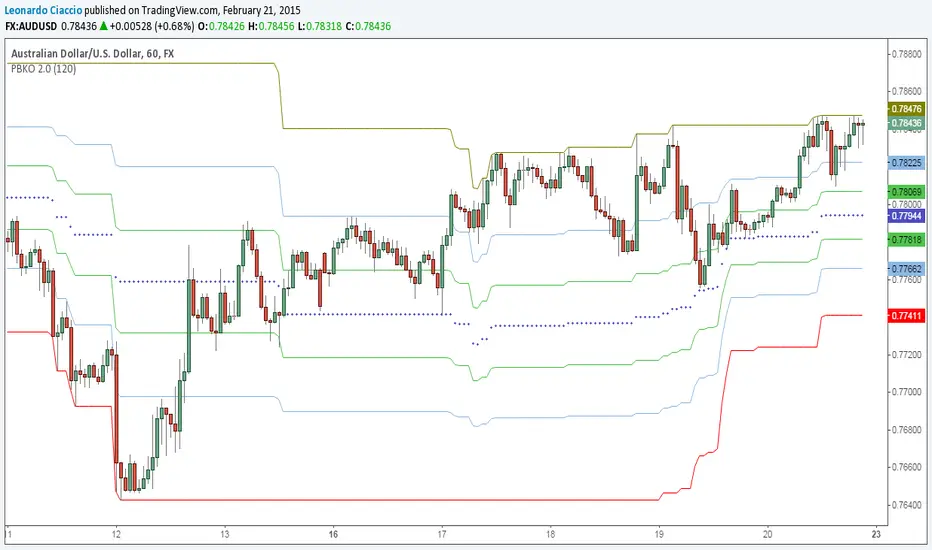
PBKO - Progressive Break Out 2.0Progressive Fibonacci level, intercept support/resistance from lenght bars default 120 bars, best use to 1H chart