Average Price Calculator / VisualizerDCA Average Price Calculator - Visualize Your Breakeven & TP!
Ever wished you could visualize your trades and instantly see your average entry price right here on TradingView? Especially if you're a DCA (Dollar-Cost Averaging) trader like me, tracking multiple entries can be a hassle. You're constantly switching to a spreadsheet or calculator to figure out your breakeven and take-profit levels. Well I've developed this DCA Average Price Calculator to solve exactly that problem, bringing all your position planning directly onto your chart.
What It Does
This indicator is a interactive tool designed to calculate the weighted average price of up to 10 separate trade entries. It then plots your crucial breakeven (average price) and a customizable take-profit target directly on your chart, giving you a clear visual of your position.
Key Features
Up to 10 Order Entries: Plan complex DCA strategies with support for up to ten individual buys.
Flexible Size Input: Enter your position size in either USD Amount or Number of Shares/Contracts. The script is smart enough to know which one you're using.
Instant Average Price Calculation: Your weighted average price (your breakeven point) is calculated and plotted in real-time as a clean yellow line.
Customizable Take-Profit Target: Set your desired profit percentage and see your take-profit level instantly plotted as a green line.
Detailed On-Chart Labels: Each order you plot is marked with a detailed label showing the entry price, the number of shares purchased, and the total USD value of that entry.
Clean & Uncluttered UI: The main Average and TP labels are intelligently shifted to the right, ensuring they don't overlap with your entry markers, keeping your chart readable.
How to Use It - Simple Steps
Add the indicator to your chart.
Open the script's 'Settings' menu.
In the 'Take Profit' section, set your desired profit percentage (e.g., 1 for 1%).
Under the 'Orders' section, begin filling in your entries. For each 'Order #', enter the Price.
Next, enter the size. You can either fill in the 'Size (USD)' box OR the '/ Shares' box. Leave the one you're not using at 0.
As you add orders, the 'Avg' (yellow) and 'TP' (green) lines, along with the blue order labels, will automatically appear and adjust on your chart!
Who Is This For?
DCA Traders: This is the ultimate tool for you!
Position Traders: Keep track of scaling into a larger position over time.
Manual Backtesters: Quickly simulate and visualize how a series of buys would have played out.
Any Trader who wants a quick and easy way to calculate their average entry without leaving TradingView.
I built this tool to improve my own trading workflow, and I hope it helps you as much as it has helped me. If you find it useful, please consider giving it a 'Like' and feel free to leave any feedback or suggestions in the comments!
Happy trading
Breakeven

Pro BTB Pour Samadi Indicator [TradingFinder] Back To Breakeven🔵 Introduction
The Pro BTB (Professional Back To Breakeven) strategy is one of the most advanced price action setups, designed and taught by Mohammad Ali Poursamadi, an international Iranian trader and a well-known instructor of financial market analysis.
The main logic of this strategy is based on the natural behavior of the market :
Breakout of a key level: Price moves beyond an important support or resistance.
Retest / Back To Breakeven: Price returns to the broken level.
Continuation of the main trend: Entry at this point allows alignment with the dominant market direction.
To better understand Pro BTB, it is necessary to first know the concept of a Spike. A spike refers to a sudden and powerful movement of price in one direction, usually caused by heavy order flow. Such a move creates an Imbalance between buyers and sellers. Because the market does not have enough time to distribute orders fairly, it leaves an Inefficiency on the chart.
The direct result of this process is the formation of a Fair Value Gap (FVG) a gap between candles that shows trades were not distributed evenly. In simple terms: the spike is the cause, and Imbalance, Inefficiency, and FVG are its consequences.
In practice, Pro BTB works effectively in both bullish and bearish structures. In a Bullish Setup, a bullish spike first breaks a resistance level. Then, when price returns to that same level, a safe and low-risk buying opportunity is created. Conversely, in a Bearish Setup, a bearish spike breaks a support level, and when price comes back to the broken level, it provides the best conditions for a short entry. These two examples illustrate how Pro BTB logic provides precise, low-risk entries in both directions of the market.
🔵 How to Use
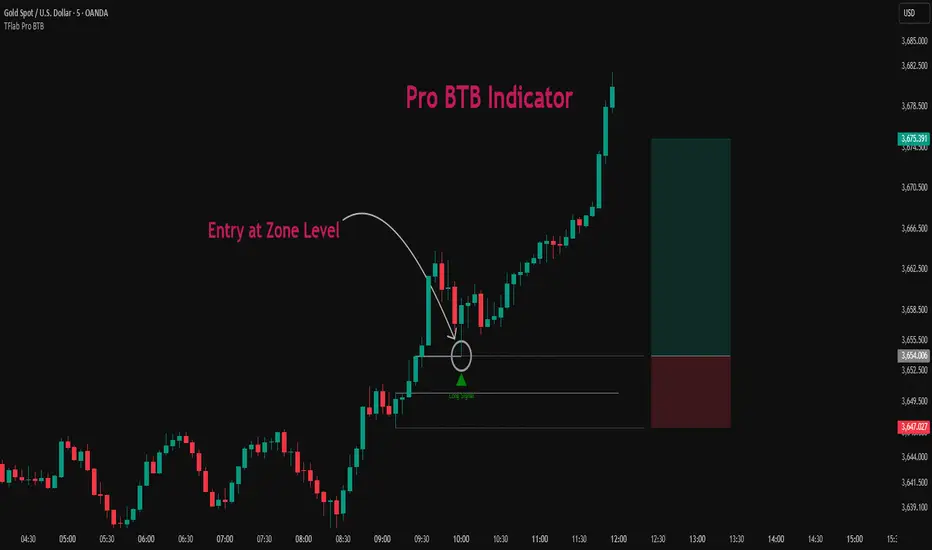
The Pro BTB (Back To Breakeven) strategy allows traders to enter precisely after price returns to the breakout level; this way the entry aligns with the natural market flow while risk is minimized. In practice, this method is simple yet powerful: first, identify a valid breakout on a key level, then wait for price to return to that level, and finally, take the entry in the direction of the main trend.
🟣 Bullish Setup
When a bullish spike occurs and a key resistance is broken, price usually returns to the same level. This level, now acting as support, provides the best opportunity for a long entry. In this scenario, the stop-loss is placed behind the breakout candle or slightly below the broken level, and the take-profit target should be defined with at least a 1:2 risk-to-reward ratio. With strong momentum, higher targets can also be considered.
🟣 Bearish Setup
In a bearish scenario, a bearish spike breaks a key support. After the breakout, price usually returns to the same level, which now acts as resistance. This creates the best conditions for a short entry. The stop-loss is placed behind the breakout candle or slightly above the broken level, while the take-profit target is set with a risk-to-reward ratio greater than 1:2.
🟣 General Rules of Pro BTB
To apply Pro BTB correctly, several key rules must be followed :
The breakout must be valid and occur on a key level.
Always wait for the retest; do not enter immediately after the breakout.
Entry should only happen when price touches the broken level and shows candlestick confirmation.
The stop-loss (SL) must be placed behind the breakout candle or the broken level.
The take-profit (TP) must always be at least twice the trade risk.
For higher reliability, the breakout should align with the trend on higher timeframes.
🟣 Six Entry Methods in Pro BTB
For greater flexibility, Pro BTB offers six standard entry methods :
Market Entry : Enter immediately at the breakout level.
Limit Order : Place a limit order on the breakout level.
Stop Order : Enter only after confirmation of continuation.
Confirmation Candle : Enter after a confirmation candle closes on the level.
Pattern Entry : Enter based on candlestick patterns such as Pin Bar or Engulfing.
Zone Entry : Enter from a zone instead of an exact point to account for market noise.
🔵 Setting
🟣 Spike Filter | Movement
Minimum Spike Bars : Defines the minimum number of consecutive candles required for a valid spike.
Movement Power : Enables or disables the momentum-based spike filter.
Movement Power Level : Sets the strength threshold; higher values filter out weaker moves and only detect strong spikes.
🟣 Spike Filter | Gap
Gap Filter : Enables or disables the gap filter.
Gap Type : Selects which type of gap should be detected (All Gaps, Significant, Structural, Major).
🟣 Spike Filter | Doji
Doji Tolerance : Defines whether doji candles are allowed within a spike.
Max Doji Body Ratio : Maximum ratio of body-to-total candle size for classifying a candle as a doji.
Max Doji in Spike Ratio : Maximum percentage of doji candles allowed within a spike.
🟣 Position Management
Stop-Loss Threshold : Enables or disables the stop-loss threshold feature.
Stop-Loss Threshold Value : Defines the value of the stop-loss threshold for risk management.
Risk-Reward Ratio : Sets the desired risk-to-reward ratio (e.g., 1:1 or 1:2).
Include SL Threshold in R:R : Determines whether the stop-loss threshold is included in risk-to-reward calculations.
🟣 Display Settings
Display Mode : Chooses between Setup (showing setups) or Signal (showing trade signals).
Show Entry Levels: Displays entry levels on the chart (buy/sell zones) when enabled
Only Display the Last Position : Displays only the most recent position on the chart when enabled.
Setup Width Drawing : Adjusts the visual width of the setup drawings on the chart for better visibility.
🟣 Alert
Alert : Enables alert notifications. When turned on, you can set TradingView alerts to receive notifications once the setup or signal conditions are met
🔵 Conclusion
The Pro BTB (Back To Breakeven) strategy is a smart and structured entry method based on natural market behavior after a breakout and retest of the broken level. It helps traders avoid emotional, high-risk entries by waiting for market confirmation and entering precisely at a point that aligns with the main trend and sits closest to the key level.
The simplicity of its rules, flexibility in entry methods, and a risk-to-reward ratio above 2 have made Pro BTB one of the most popular tools among price action traders. Nevertheless, as with any strategy, it is recommended to practice it in demo accounts or through personal backtesting before applying it to real trading, in order to find the entry conditions that best suit your trading style.
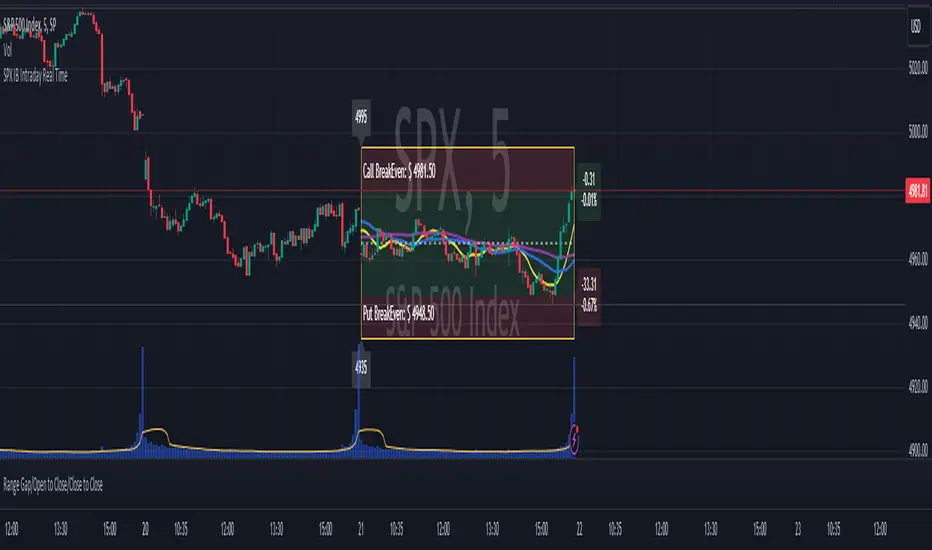
SPX IB Intraday Real TimeThis indicator was designed for traders doing Iron Butterflies intradays with the SPX.
Draw and assemble the picture of an IB with the call and put wings chosen according to the selected configuration. Additionally, it shows both breakevens according to the credit obtained.
The indicator shows the distance, in real time, between the current price of the SPX and the breakevens (calls and puts) that have been selected. This result is shown in percentages and points. In the upper right corner (for calls) and lower right (for puts). The label will change color as the price moves closer or further away from the breakevens.
Setting:
Open Time (Hour): IB opening time.
Open Time (Minute): IB opening minutes.
Open Price: Strike to which the center or body of the IB was opened.
Auto Price Open: If enabled, it will take the strike at the price closest to the SPX.
Wings Width: width of the IB wings.
Credit: Refers to the credit obtained according to the IB that was opened.
Shows Breakeven: Shows breakeven points at expiration based on credit earned.
Add SMAs: Adds the SMAs 8, 20 and 50 to the chart.
Note 1: It is recommended to use TradingView's Dark Theme Color.
Note 2: this indicator will only work in intraday times of less than 30 minutes (1m,2m,5m,10m,15m,30m) and will only show results while the market is open, that is, in real time.
************************************
Spanish Version:
Este indicador fue diseñado para los traders que hacen intradías de Iron Butterflies con el SPX.
Dibuja y arma el cuadro de un IB con las alas call y puts elegidas de acuerdo a la configuración seleccionada. Además, muestra ambos breakevens según el crédito obtenido.
El indicador muestra la distancia, en tiempo real, entre el actual precio del SPX y los breakevens (calls y puts) que se hayan seleccionado. Este resultado se muestra en porcentajes y en puntos. En la esquina superior derecha (para los calls) e inferior derecha (para los puts). El label cambiará de color a medida que el precio se acerque o aleje de los breakevens.
Configuración:
Open Time (Hour): Hora de apertura del IB.
Open Time (Minute): Minutos de apertura del IB.
Open Price: Strike al que se abrió el centro o cuerpo del IB.
Auto Price Open: Si se encuentra habilitado tomará el strike al precio más cercano al SPX.
Wings Width: ancho de las alas del IB.
Credit: Se refiere al crédito obtenido según el IB que se abrió.
Shows Breakeven: Muestra los puntos de breakeven en la expiración según el crédito obtenido.
Add SMAs: Agrega al cuadro las SMA 8, 20 y 50.
Nota 1: se recomienda usar el Dark Theme Color de TradingView.
Nota 2: este indicador solo funcionará en temporalidades intradías menores a 30 minutos (1m,2m,5m,10m,15m,30m) y solo mostrará resultados mientras el mercado esté abierto, o sea en tiempo real.
SHAD helperDisplays lines and labels for prices following the SHAD strategy.
SHAD strategy consists in selling half the position every time price doubles, thus this indicator displays values for x2, x4, x8 and x16 of current closing price.
You can also see "/2" (-50%) and "/4 " (-75%) values.
You can edit display colors and labels text size in the indicator's settings

Bitcoin Production CostBitcoin's Production Cost
Based on raw data from CBECI.
Follow me to read more about the calculation logic.

Crypto Break-even FeeWhen I started trading cryptocurrency, I lost money because I didn't take the fees enough into account. Therefore I created my own indicator to quicqly see the break-even selling price of the selling price if I want a predifined profit level.
2 lines are added to the graph. These lines move together with the current price.
- One line indicating the break-even selling price (depending on your maker/taker strategy). For beginners I suggest taking the taker strategy (mostly 0.25%)
- Another line indicating the selling price in order to make a predifined profit %
There are 2 parameters you can set:
- Desired profit (%)
- Maker/Taker Fee (%)
Always happy with a little appreciation ;-) Bitcoin wallet: 18522cAc7YDwwXTvtckXKb1kP33upVDRFR

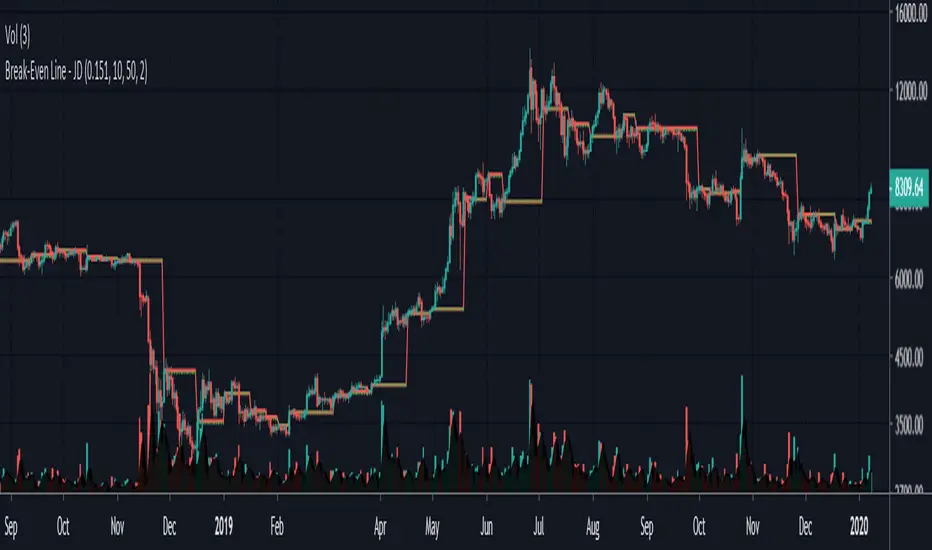
Break-Even Line - JDThis gives you a simple visual representation of fees implications.
This indicator can give you an insight of what timeframes are worth trading, and at what timeframes your profit will be "eaten by fees"
The indicator shows, how far price has to move from the last swing points (if you entered there) to break-even after fees
As long as you're 'in the red' you P/L after fees will be negative!!
The fees are added once for entry and once for exit, so you have to enter the fees per transaction
(eg in BitSeven this is 0.075%/trans for BTC and 0.151%/trans for ETH)
Of course this can be used for any market.
JD.
#NotTradingAdvice #DYOR
I build thes indicators for myself and provide them open source, to use for free to use and improve upon,
as I believe the best way to learn is toghether.