TradewithPuneet: Pro-PatternsThe Pro-Patterns strategy is designed to trade classic chart patterns. At present, it identifies the Ascending Triangle patterns and Weekly Inside Bars patterns and takes Long or Short entries, as the case may be.
Ascending Triangle patterns:
- The strategy identifies ascending triangle patterns ranging from 40 to 120 days.
- BUY signals are generated on the breakout of the horizontal resistance line. No SHORT signal is generated on the breakdown of the rising trend line.
- The importance is given to higher lows, instead of attempting to make a perfectly straight rising trend line. Hence, the drawing of the rising trend line is skipped.
- The strategy gives BUY signals on continuation as well as reversal patterns.
- Users can choose exit rules either on the breakdown of a certain number of days or based on ATR.
- The Ascending triangle patterns can be seen on Daily timeframes only.
Weekly Inside Bars
- The strategy identifies inside bars on weekly charts with three candles. This means, that Weekly Inside Bars pattern is said to be formed when the current week's candle is inside the previous week and the previous week's candle is inside the week prior to it.
- A BUY or SHORT signal is generated next week on breakout or breakdown of high or low of third week’s candle.
- The importance is given to a decrease in volume on second & third weeks’ candles.
- The strategy gives BUY or SHORT signals on continuation as well as reversal patterns. However, users can choose to see trading signals on continuation patterns only.
- Users can choose exit rule on breakdown or breakout of a certain number of weeks in case of BUY & SHORT signals respectively.
- The Weekly Inside Bars patterns can be seen on Weekly timeframes only.
The strategy guides you the price level at which to BUY / SHORT and EXIT. It is intended for short to medium-term traders. It is important for the security to close beyond the trigger point for the signal to remain in force.
Breakout!


BEST Long Term Levels Breakout ScreenerHello traders
Continuing deeper and stronger with the screeners' educational serie one more time (#daft #punk #private #joke)
We don't have to wait for TradingView to allow screener based on custom indicator - we can build our own ^^
I - Long Terms concept
I had the idea from @scarff.
I think it's genius and I use this long terms level in my trading across all assets.
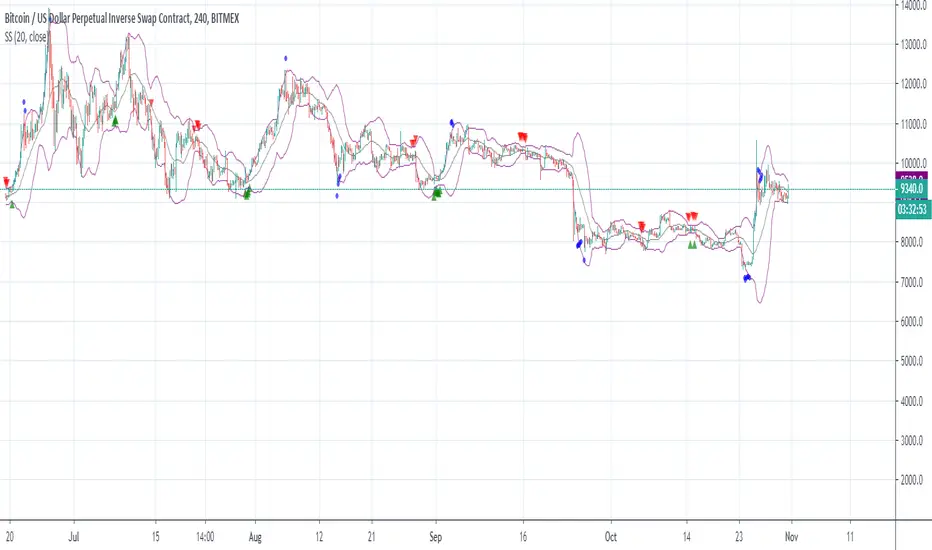
The screener, in particular, analyzes whenever the price breaks out a weekly/monthly/quarterly/yearly level on candle close .
Triggering events on candle close = we get rid of the REPAINTING = we remove the fake signals (in that case the fake breakouts).
The candle close is based on the close of the current chart => if the chart displays candlesticks on the weekly timeframe, then the considered close will be the weekly close.
If in daily timeframe, the close will be .............................. 4h (#wrong)..... kidding :) .............. DAILY obviously
II - How did I set the screener
The visual signals are as follow:
- square: breakout of a high/low weekly level
- circle: breakout of a high/low monthly level
- diamond: breakout of a high/low quarterly level
- flag: breakout of a high/low yearly level
- dash: none of the above
Then the colors are:
- green when bullish
- red when bearish
- orange/dash when none of the above
Cool Hacks
"But sir... what can we do with only 3 instruments for a screener?" I agree not much but...
As said previously... you can add multiple times the same indicator on a chart :)
Wishing you all the BEST trading and.... wait for it... BEST weekend
Dave

Stock Analysis SoftwareStock Analysis Software is a full trading setup and style that is meant for swing trading stocks, but can also be used for Forex, cryptocurrencies, indices and commodities. Whatever your choice of trading style (Intraday, Scalping, Swing trading, Investing) or trading instrument is (FX, Futures, Cryptos, Stocks) I can tailor it for you specifically. For example if you want to use it for trading Forex intraday I will show you how to use it for that.
The software consists of 11 indicators, 7 are custom and 4 are common and well known indicators available on Tradingview. The system itself is part software and part learning my specific pattern finding techniques. There is no one without the other. This is a complete system
This trading system is something I have developed over the last 10 years through extensive research and development and is now available on this platform.
The indicators used are mostly screening for trend breakouts, support and resistance, specific candle patterns, overextended, volume spikes and more.
This is a system that can be taught easily if one is motivated to learn.
The setup includes a video guide and a live one-on-one full breakdown on how to use it to your benefit.

ORB WITHOUT WEAK CANDLE WITH ALERTS [MV]This indicator for automation Trading with Alerts
I already explain every plot in Chart

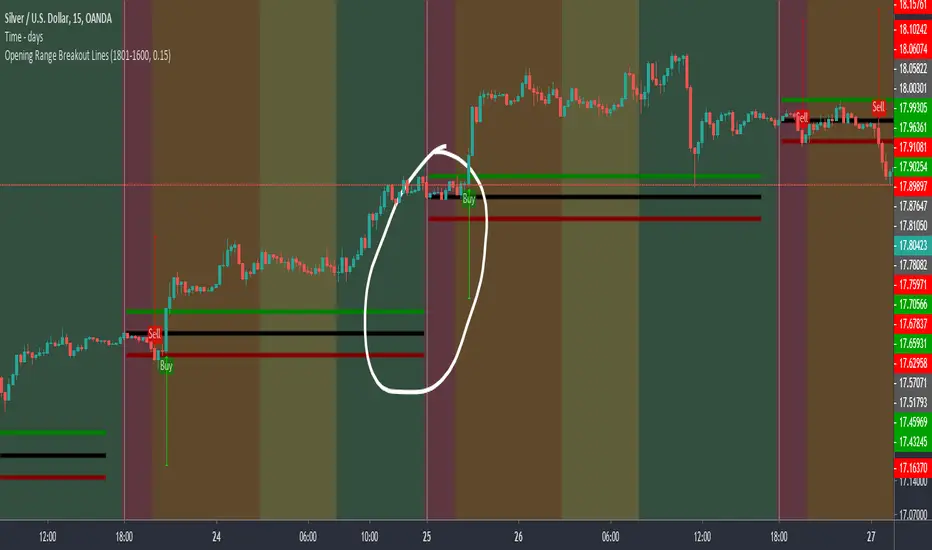
Opening Range Breakout LinesDisclaimer: Use proper risk management and remember that all trading involves risk.
Based on RicardoSantos' "Open Session Breakout Trader Strategy"
I turned it into a study and tweaked it for trading Silver
My goal when creating this was to help visualize breakout lines for multiple trading days at the same time without having to always draw them in.
Renko channel BREAK (alert)This is the Alert version for Renko channel BREAK.
Please use this script after research the Strategy version!!

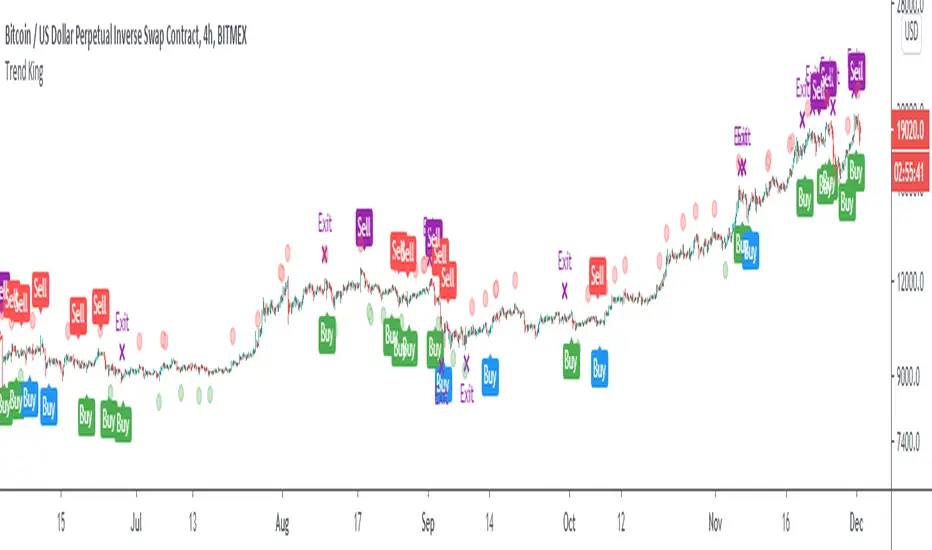
Trend KingIntroducing “Trend King”.
The alpha generating strategy built for Crypto.
“Trend King” combines 4 proprietary indicators. It buys and sells based on:
Short-term momentum
Long-term momentum
Volume compression
Volatility breakouts
The strategy was built on 2 years of BitMEX data (XBTUSD) and backtested on 9 years of Bitcoin data (BLX). Finally, the strategy was validated on multiple large market cap cryptocurrencies, including Ethereum (ETHUSD), without parameter adjustment.
Strategy backtesting checks include:
Used 0.12% fees. 60% more than the actual BitMex/Binance fees of 0.075%.
No Heikin-Ashi Candles (to avoid fake results)
No Stop-losses (to avoid fake order execution)
Market Orders Only (to avoid fake order execution)
The results speak for them self.
See the positive excess return from the “Trend King” strategy returns versus a simple Bitcoin “Buy-and-Hold” strategy. Best functionality on the Daily and 4HR timeframes.
**For Access: Contact me on TradingView or Twitter.
BreakOut Candle with Alerts [MV]hello everyone this indicator using for automation trading with alerts
here previous Day high low
first candle high low and time frame
Green background it's mean 200 SMA above open candle
red background it's mean 200 SMA below open candle
!!! you can also change any period SMA. buy default add 200 SMA

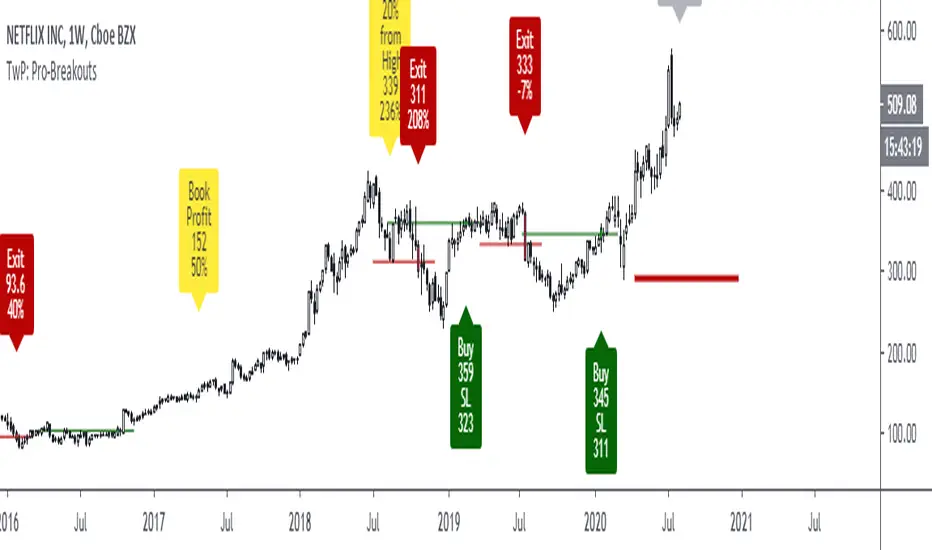
TradewithPuneet: Pro-BreakoutsThe Pro-Breakouts strategy is designed to get into a LONG position when a stock enters an Uptrend after a breakout. This strategy gives you:
• BUY signals : On a breakout, with strong probability of continuing up-moves.
• No SHORT signals are included in this strategy.
Through this strategy, we aim to ride a big chunk of the Uptrend till it reverses.
The strategy uses certain filters to avoid fake breakouts. Once those filter conditions are met, the stock waits for a breakout of key resistance level. Upon the breakout, the stock gives a BUY signal. Finally, when the stock breaks its key support level, it gives an EXIT signal.
The strategy guides you the price level at which to BUY and EXIT. You can also input your acceptable stop loss and profit booking levels, which are then displayed on the chart. The resistance and support lines (which result in trades) are drawn automatically on the chart.
The strategy is for medium to long-term traders . It works only on Daily timeframes and on closing prices. Hence, during the market hours, if a stock breaks out of its key-resistance level, you will see a BUY signal, but if it closes below it, the signal will disappear.
This strategy is only built for stocks, not for indices or any other financial instrument.
W5T BiasThe Bias indicator is a sub-chart allowing the users of the main B.I.T.S (Breakout Intelligent Trading Signals Indicator) suite. This Bias indicator automatically looks at a higher timeframe and indicates bullish , neutral and bearish Bias. This is respect to our 3 points of control EMA´s.
Check out our signature to learn more!
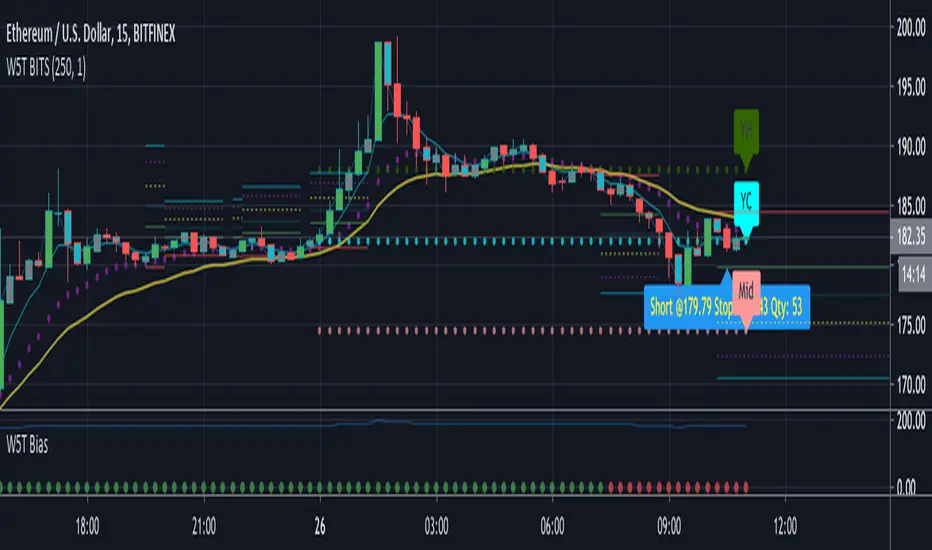
W5T BITSThe B.I.T.S (Breakout Intelligent Breakout Signals) Trading Suite is for swing and day trading instruments with Volume and price action. So Cryptocurrency, Futures , Stocks and Commodities on all time frames. We are looking at squeezes in price action with increased volume . Then the proximity to our points of control, which are different EMA´s
Developed through in our Cloud
Signal Candles Both Long & Short
Entry & Stop Loss Prices
Automated Bias Indicator
W5T Special Points of Control
Yesterday's HLC levels and labels
Automatic Risk Calculator when trading Stocks
Training Bootcamp
See our signature to learn more!

Extended Recursive Bands - Maximum Efficiency With Extra OptionsIntroducing A New Calculation For Efficient Bands Calculation !
Here it is ! The Recursive Bands Indicator, an indicator specially created to be extremely efficient, i think you already know that calculation time is extra important in algorithmic trading, and this is the principal motivation for the creation of the proposed indicator. Originally described in my paper "Pierrefeu, Alex (2019): Recursive Bands - A New Indicator For Technical Analysis" , the indicator framework has been widely used in my previous uploaded indicators, however it would have been a shame to not upload it, however user experience being a major concern for me, i decided to add extra options, which explain the term "extended".
On The Indicator Calculation
You can skip this part if it doesn't interest you. The calculation of the indicator is based on recursion, but i want to explain the mathematical formula described in the paper.
I've seen some users trying to remake it from the calculations, however there was always something weird, and i understand, mathematical notations are always a bit weird, even myself don't always write them correctly/understand them, however this one is relatively simple to understand.
First lets explain each elements of the calculation :
α = smoothing constant, or 2/(length+1)
max/min = maximum and minimum function, max return the greatest input value while min return the lowest one, for example :
max(4,2) = 4 while min(4,2) = 2
the "||" notation mean taking the absolute value, for example : |-1| = abs(-1) = 1
The calculation after the max/min function is called the correction factor, and is the core of the indicator. The last two variables are just here to provide an initial value for upper and lower, basically when we start our calculations we will assign the value of the closing price for upper and lower.
The motivation behind using a smoothing constant in range of (0,1) was to tell the reader that the indicator is easily made adaptive, this is what i did on my adaptive trailing stop indicator by using the efficiency ratio as smoothing variable, the user can use 1/length instead of the provided calculation for alpha.
If you interested on the indicator main logic, it is actually really simple, by using upper = max(price,upper) and lower = min(price,lower) we would get the maximum/minimum price value at time t , therefore upper can only be greater or equal than its precedent value, while lower can only be lower or equal than its precedent value, in order to fix that we subtract/sum upper/lower with a value, this allow the upper band to be lower than its precedent value and lower to be greater than its precedent value, this is the role of the correction factor.
The Indicator
The indicator display one upper and one lower band, every common usages applied to bands indicators such as support/resistance, breakout, trailing stop...etc, can also be applied to this one. length control how reactive the bands are, higher values of length will make the bands cross the price less often.
In order to provide more flexibility for the user i added the option to use various methods for the calculation of the indicator, therefore the indicator can use the average true range, standard deviation, average high-low range, and one totally exclusive method specially designed for this indicator.
Classic Method
This option make the indicator use its classical calculation, this is the most efficient method of all.
Atr Method (atr)
This method use the average true range as correction factor, notice that lower values of length can still produce wide band.
Standard Deviation Method (stdev)
This method use a biased estimate of the standard deviation as correction factor.
The method produce smoother bands that converge more slowly toward the price in comparison with the classic correction factor.
Average High-Low Range Method (ahlr)
This method use the average of the high-low range as correction factor, extremely similar to the average true range.
Rising Falling Volatility (rfv) Method
A new method created for this indicator, this correction factor use the absolute prices changes when price value is greater/lower than any length past values of the price, this allow to have more boxy shaped bands, work best with greater values of length.
The bands can be in contact with this method, a possible fix in the future.
Conclusion
The recursive band indicator is one of my greatest indicators in my opinion (i would love to have yours), as you can see the idea behind it is extremely simple and allow for a super efficient band indicator, which was the original motivation behind it, in order to provide more fun for the users i also added more option for the correction factor, this allow the user to be creative and not get stuck with the original calculation.
Like the trend step indicator family we have almost ended our series on the recursive band framework, 1 more trailing stop will be added in the future, and then we'll have more "boring" stuff until i find something cool again, it shouldn't be long ;)
Thanks for reading !

Super Signal - Bollinger BandsBollinger Bands are price channels, or bands, that are plotted above and below price. The outer Bollinger Bands are based on price volatility, which means that they expand when the price fluctuates and trends strongly, and the Bands contract during sideways consolidations and low momentum trends. By using a combination of several indicators, we try to predict the direction of a large price movement when the Bands are compressed and the market is in a consolidation period.
To use the indicator:
Go long on the green arrows.
Go short on the red arrows.
The blue circles give a clear indication of when a trend has ended.
Inside Bar Visualizer PineV4I didn't find a study for Inside bar as I wanted. Therefore I wrote a one with PineV4. This may help you to see inside bars.
It can recalculate and works with either (opens-closes) or (highs-lows)
Cheers! :)

CFT Auto Pivot Trend LinesThis script draws real time trend lines from swing highs and lows which will automatically draw your trend lines for you.
Extremely useful for catching a trend confirmation and triangle break outs.
This is best used with the CFT Auto Support & Resistance Indicator and CFT Buy Sell Signals for additional confirmations.
If you need any help just message me.

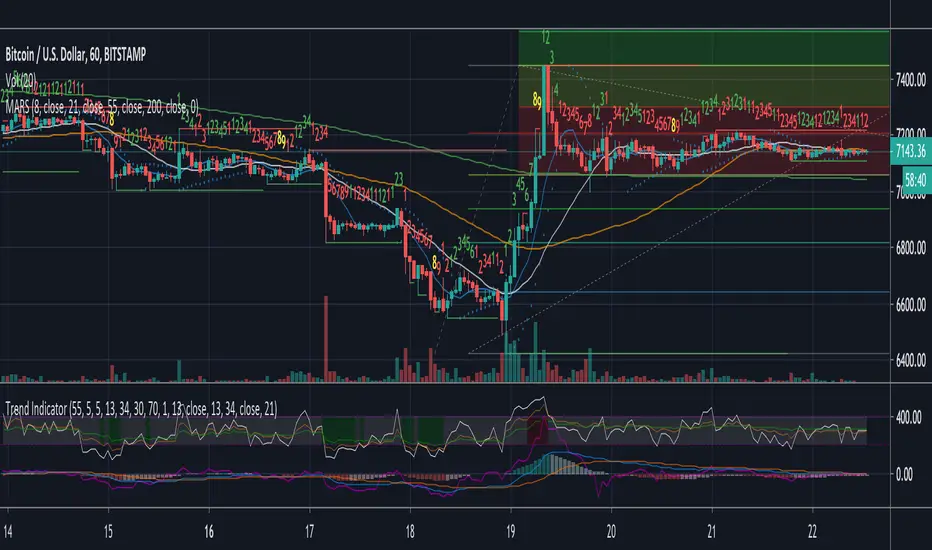
Trend Indicator
A Simple indicator combining 3 of the most popular Oscillators RSI, MacD and Momentum to help see reversals or the continuation of a trend. Designed with the COINBASE:BTCUSD chart in mind but there's not reason it shouldn't work on any other asset.
The indicator has two main parts:
- The gray area at the top between the purple dotted lines is 3 RSI's in one (5, 13, 34) These have been moved up from the RSI's original position to avoid cluttering the MacD and make the lines easier to read. Just like with the regular RSI the lower dotted line indicates oversold and the top dotted line indicates an overbought condition.
To identify this more easily the background changes to green when the middle (13 period) RSI is oversold and red when it's overbought.
*Note* On some very small timeframes the position may need to be adjusted in order to make them easier to see.
This section of the indicator is designed to give early warning signs of markets reversing by the faster white line with confirmation from the orange and green lines.
- The bottom section of the indicator has two parts. The first is a modified MacD which is slightly longer term than the original. This is to act as confirmation or entry/take profit points on divergence or if either of the lines within the MacD crossover or the histogram goes from one color to the other. The histogram is also helpful for trend-following as it lets you gauge if the momentum is gaining or losing strength.
The last part of the indicator is simply a momentum line to indicate in which direction the momentum is heading. It's designed as a confirmation of the other indicators and shouldn't be used on it's own.
All individual indicators that make up the trend indicator have been tweaked slightly to use numbers from the fibonacci sequence rather than the originals.
This indicator is best used in combination with volume and moving averages.
- Look for reversals on low volume near a moving average or key historical point.
- Look for breakouts on high volume if the oscillators line up.
Moving Averages (21, 55, 200) with Parabolic SAR and Support/ ReA Simple indicator combining 3 of the most popular simple moving averages; (21,55, 200) with a tweaked Parabolic SAR as well as recent support & resistance points.
Developed to help see key areas of interest on COINBASE:BTCUSD quickly without needing to draw many manual trendlines in order to trade breakouts or bounces at key levels. But should be useful for any market.
This indicator is best used in combination with oscillators such as the MacD or RSI and also volume.

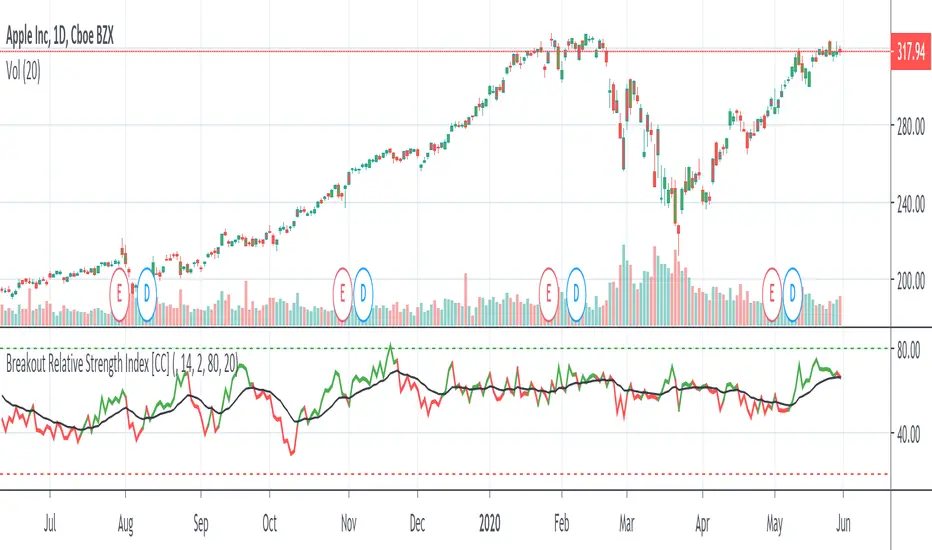
Breakout Relative Strength IndexIt isn't easy to determine if the price of a stock is about to break out. Here’s one way you can determine the relative strength of a breakout, enabling you to act early and realize higher profits.
This indicator was originally developed by Howard Wang Stocks & Commodities V. 33:09 (60–62)
EXZYLE:Pipsanee BB (development)This is the development version of the Exzyle/Pipsanee Bollinger Band Breakout indicator and alerts.
Bollinger Band breakouts are tagged with an arrow showing the direction they are heading.
The alerts trigger only on the first breakout.
This code also includes a MACD Retracement indicator.

Auto Squeeze Breakout BarsThe Auto Squeeze Breakout Bars find bars that are breaking out of a low volatility environment into a high volatility environment.
The Squeeze shading is signaled when the volatility of the asset is very low. Then the Squeeze Breakout Bars are signaled when the asset is breaking out of this low volatility structure.
Warning bars will be signaled when it is approaching a breakout, but the conditions are not fully met at that very time.
The Auto Squeeze Breakout Bar indicator also has a built in stop loss mechanic that can be set to your preferred limit.
Stop losses are highly recommended when using the breakout bars because of possible head fakes. They are rare, but can occur depending on the asset you are trading.
For Access or Questions: Private message us. Thank you.

X Period High/Low/MidToday we have a simple, but endlessly versatile, indicator that plots the X Period High/Low/Mid of your chosen market.
Traditionally the 52 week High/Low is used as a breakout signal. However, by changing to an X period, and adding a midway line, we create a more versatile indicator that can be tailored to various markets.
By default it's set at 250 periods (because I like the 250 period moving average), and I generally trade H4 and Daily time frames. But tweak it to your liking, you just have to modify the length periods by your desired time frame and lookback length. E.g. to create a 52 week indicator on the daily time frame, enter a length of 260 in the indicator (5 days per week * 52 weeks = 260).
For the above reason, I haven't made this indicator MTF, as there's no real need. However, if users find it easier I can look at adding it later.
Also, the mid point between an X period high/low is often a good trend-follower, as well as acting as support/resistance . I encourage you to experiment with different ways of using this indicator. Entire systems (if your risk management is correct) can be built and traded from this one indicator.
Good luck.
DD
