Brian Shannon 5-Day MA BackgroundBrian Shannon 5-Day Moving Average with Dynamic Background Fill
OVERVIEW
This indicator implements Brian Shannon's renowned 5-Day Moving Average methodology from his acclaimed work "Technical Analysis Using Multiple Timeframes." The indicator provides instant visual clarity on short-term trend direction and momentum, making it an essential tool for swing traders and active investors.
KEY FEATURES
• True 5-Day Moving Average: Dynamically calculates the correct period across all timeframes (1min, 5min, 15min, 1H, etc.)
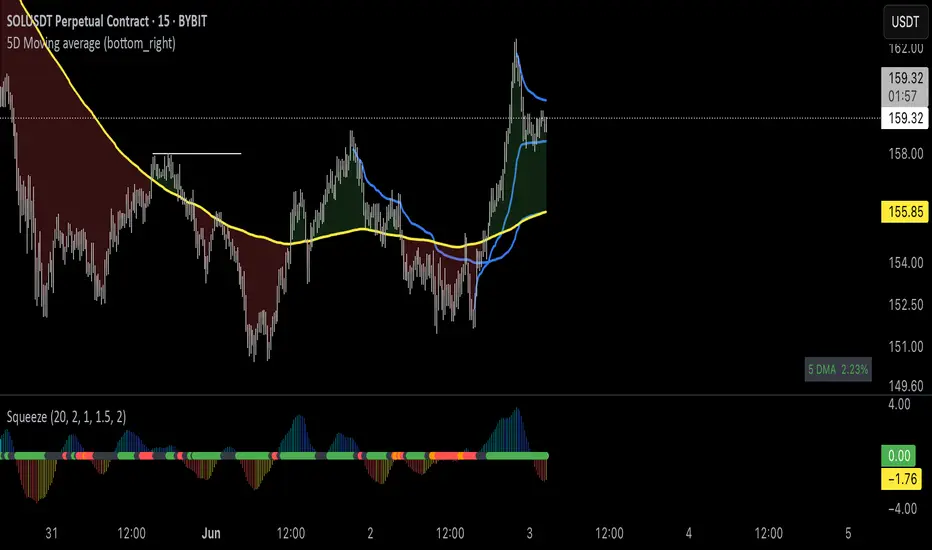
• Visual Price-to-MA Relationship: Color-coded fill between price and the moving average
- Green Fill: Price is above the 5-day MA (bullish short-term momentum)
- Red Fill: Price is below the 5-day MA (bearish short-term momentum)
• Multi-Timeframe Compatible: Works seamlessly on any chart timeframe while maintaining the true 5-day calculation
BRIAN SHANNON'S STRATEGIC APPLICATION
Primary Uses:
1. Trend Identification: Quickly identify short-term momentum shifts
2. Dynamic Support/Resistance: The 5-day MA acts as a moving support level in uptrends and resistance in downtrends
3. Entry Signal Confirmation: Look for pullbacks to the 5-day MA as potential entry points in trending stocks
4. Multi-Timeframe Analysis: Essential component of Shannon's multiple timeframe approach
Perfect Combination with:
• AVWAP (Anchored Volume Weighted Average Price): Use together to identify high-probability setups where price is above both the 5-day MA and AVWAP
• Longer-term Moving Averages: Combine with 20-day and 50-day MAs for complete trend analysis
• Volume Analysis: Confirm 5-day MA signals with volume patterns
TRADING APPLICATIONS
For Swing Traders:
• Bullish Setup: Price above 5-day MA + above AVWAP + above longer-term MAs = Strong uptrend
• Bearish Setup: Price below 5-day MA + below AVWAP + below longer-term MAs = Strong downtrend
• Entry Timing: Use pullbacks to the 5-day MA as entry opportunities in the direction of the primary trend
For Day Traders:
• Quick visual confirmation of intraday momentum
• Dynamic support/resistance levels for scalping opportunities
• Clear trend bias for directional trades
WHY THIS INDICATOR WORKS
Brian Shannon's approach emphasizes that the 5-day moving average represents the short-term sentiment of market participants. When price is consistently above this level, it indicates buyers are in control of short-term price action. Conversely, when price falls below, it suggests selling pressure is dominating.
The visual fill makes it immediately obvious:
• How far price is from the 5-day MA
• The strength of the current short-term trend
• Potential areas where price might find support or resistance
BEST PRACTICES
1. Never use in isolation - Always combine with longer timeframe analysis
2. Volume confirmation - Look for volume expansion on moves away from the 5-day MA
3. Multiple timeframe approach - Check higher timeframes for overall trend direction
4. Combine with AVWAP - Most powerful when both indicators align
INSTALLATION NOTES
This indicator automatically adjusts for any timeframe, ensuring you always get a true 5-trading-day moving average regardless of whether you're viewing 1-minute or hourly charts.
Based on the technical analysis methodology of Brian Shannon, author of "Technical Analysis Using Multiple Timeframes"
Brianshannon
Multi-Day Rolling VWAP [Intraday]Ideas from Brian Shannon's book "Anchored VWAP"
The Multi-Day Rolling VWAP indicator for intraday timeframes allows you to track the Volume Weighted Average Price (VWAP) over multiple days, specifically for 1-day, 2-day, 3-day, 4-day, and 5-day periods. This indicator beyond the standard daily VWAP provides a broader perspective on price trends and market sentiment.
Features:
- Multi-day VWAPs: Analyze VWAP over several days to observe longer-term price movements.
- Customizable display: Choose which VWAP periods to display on the chart
- Colorize: Choose different colors for each VWAP to easily distinguish between periods.
- Adjustable settings: Change the line thickness and select the price source for VWAP calculations.
- Works with Replay Mode
- Works in any intraday timeframe on any asset with volume and price
Benefits:
- Trend identification: Compare current prices with multi-day rolling VWAPs to spot trends.
- Spot reversals: Look for potential price reversals or support when prices cross VWAP lines.
Multi VWAP [MW]Introduction
The Multi VWAP tool extends the concept of using the Anchored Volume Weighted Average Price, popularized by its founder, Brian Shannon, founder of AlphaTrends, and creates automatic AVWAPS for multiple anchor points, such as for 2-day, 3-day, 4-day, 5-day, and custom date anchors as well as automagically creating month-to-date and year-to-date anchors. Currently, most standard VWAP tools allow users to place custom anchored VWAPs, but the routine of doing this for every equity being watched can become cumbersome. This tool makes that process multi-times easier. Brian Shannon is also the author of “Maximum Trading Gains With Anchored VWAP: The Perfect Combination of Price, Time, and Volume”. Available at Amazon.
Settings
Daily VWAP : A continuous line of the the daily Volume Weighted Average Price (VWAP)
Weekly VWAP : A continuous line of the weekly VWAP
2-Day AVWAP : The anchored VWAP from 2 trading days ago (holidays and weekends are excluded in this calculation)
3-Day AVWAP : The anchored VWAP from 3 trading days ago
4-Day AVWAP : The anchored VWAP from 4 trading days ago
5-Day AVWAP : The anchored VWAP from 5 trading days ago. The slope of this line and the position of the price relative to this line can be used to determine trend direction.
10-Day AVWAP : The anchored VWAP from 10 trading days ago
Month-to-Date AVWAP : The anchored VWAP from the beginning of the current month
Year-to-Date AVWAP : The anchored VWAP from the beginning of the current year
Custom Date AVWAP : Sets a date to begin an anchored VWAP starting from any time.
Use only the most recent VWAP for Week, Month, and Year: Toggles on and off the continuous weekly, monthly, and yearly VWAPs
Calculations
This indicator does not provide buy or sell signals. It is simply the VWAP calculated starting from an “anchor point”, or start time. It is the calculated by the summation of Price x Volume / Volume for the period starting at the anchor point.
How to Interpret
According to Brian Shannon, VWAP is an objective measure of what the average trader has paid for a particular equity over a given period, and is the value that large institutional investors frequently use as a trade signal. Therefore, by definition, when the price is above an AVWAP, buyers are in control for that period of time. Likewise, if the price is below the AVWAP, sellers are in control for that period of time.
Shannon also distinguishes the importance of an increasing or decreasing 5 day VWAP, which reflects the price sentiment, objectively, for roughly the last trading week, or 5 trading days. Pricing below a decreasing 5-day VWAP is considered very bearish, while pricing above an increasing 5-day VWAP is considered bullish and is recommended before considering long positions.
Additionally, a custom VWAP can be generated to coincide with important events, such as FOMC meetings, CPI reports, earnings reports, etc.
Practically speaking, price action can tend to change direction when a significant VWAP is hit, voiding buy and sell signals. Like moving averages, this indicator can show, in real-time, how a buy or sell signal should be interpreted. A significant AVWAP line is a point of interest, and can serve as strong support or resistance, because large institutions may be using those values for entries or exits. For a great analysis of how to use AVWAP, visit the AlphaTrends channel on Youtube here or you can buy Brian Shannon’s “Anchored VWAP” book on Amazon.
Other Usage Notes and Limitations
It's important for traders to be aware of the limitations of any indicator and to use them as part of a broader, well-rounded trading strategy that includes risk management, fundamental analysis, and other tools that can help with reducing false signals, determining trend direction, and providing additional confirmation for a trade decision. Diversifying strategies and not relying solely on one type of indicator or analysis can help mitigate some of these risks.
Additionally, the indicator may take a little longer to load than usual. On the rare occasion where it fails to load, you may need to remove the indicator and add it back to your chart. Also, if you do encounter this problem, avoid redrawing your chart while the indicator is being added to the screen.
Acknowledgements
This script uses the MarketHolidays library by @Protervus. Also, for debugging, the JavaScript-style Debug Console by @algotraderdev and the TimeFormattingLibrary by @twingall were invaluable. And, of course, without Brian Shannon's books, videos, and interviews, this indicator would would not be possible.
