Broadening Formation + Failed 2 CandlesThis indicator is a technical analysis tool designed to identify potential trend reversals at the boundaries of Broadening Formations (BF). It combines structural pivot analysis with the "Failed 2" candle pattern (a variation of an outside-bar or stop-run reversal) to highlight zones of technical alignment.
How it Works
1. Structural Detection (Broadening Formations)
The script identifies market structure using pivot-based logic:
* Auto Mode: Dynamically identifies Pivot Highs and Pivot Lows to plot the upper and lower boundaries of a broadening range.
* Manual Mode: Allows users to input specific price levels for fixed horizontal support and resistance.
2. The "Failed 2" Reversal Pattern
The script looks for specific price action exhaustion at the boundaries:
* Failed 2 Down (Long): Occurs when a candle creates a New Low (taking out the previous candle's low) but reverses to close higher than its open (Bullish).
* Failed 2 Up (Short): Occurs when a candle creates a New High (taking out the previous candle's high) but reverses to close lower than its open (Bearish).
3. Proximity Filtering
The Proximity Engine acts as a filter. A label will appear and will only be valid if the price is within a user-defined threshold of the BF lines. Users can define this "strike zone" via:
* Percent / Points / Ticks: Static distance from the level.
* ATR Multiple: Volatility-adjusted distance, ensuring the zone expands or contracts based on current market conditions.
Key Features
* On-chart Visualization of Stop and Target Reference Levels: On-chart plotting of Stop Loss and Profit Targets (Target modes include Opposing BF Line, 50% Range, or Fixed Amount).
* Real-Time Statistics: An on-screen dashboard tracks Win Rate, Hit/Fail counts, and Risk-to-Reward ratios for the last N bars. Statistics reflect historical signal outcomes only and do not predict future performance.
* Visual Customization: Fully adjustable markers, line styles, and table positioning to fit any chart layout.
* Alerts: Integrated alert functionality for Long and Short triggers.
Usage Note
This tool is intended to help identify structural exhaustion. Like all technical indicators, it is most effective when used in conjunction with other forms of analysis (such as volume or higher-timeframe trend context). It does not constitute financial advice.
Broadening-formation

Broadening Formation Structure Review ToolThis script provides an educational, checklist-based framework for studying Broadening Formations together with basic Strat-style reversal behavior and higher-timeframe direction. It is designed to show multiple structural conditions in one place so users can observe how they interact. It does not execute trades, generate signals, or provide financial advice.
What makes this script original is the integration of four components into a single logical framework:
• dynamic tracking of Broadening Formation high/low levels
• proximity evaluation relative to those levels
• classification of simple bar reversal behavior
• higher-timeframe open–close continuity checks
Instead of using these concepts as separate tools, the script combines them into a single checklist so users can see when multiple conditions occur at the same time.
Broadening Formation levels may be user-defined or automatically derived using:
• unlimited dynamic expansion
• range-limited dynamic expansion
• swing-pivot detection
• manual input mode
Users may also optionally lock levels once a structure is identified.
Proximity to BF levels can be measured in several ways, including percentage, ticks, points, dollars, ATR multiples, or expected-move multiples. The script can also detect when price takes out BF highs or lows.
The script classifies basic Strat-style price behavior, including:
• two-up / two-down moves
• outside bars
• failed 2U/2D reversals
• 2D→2U and 2U→2D reversals
A selectable higher timeframe (such as 60, 240, D, W, or M) is used to evaluate direction by comparing the higher-timeframe open and close.
The on-chart table summarizes:
• current BF High and BF Low levels
• proximity status relative to those levels
• whether BF highs or lows have been taken out
• reversal classification results
• higher-timeframe direction
• theoretical risk distance and 2R/3R projections
Optional alerts can notify when three-condition or four-condition checklist alignment occurs, based only on the logical rules visible in the script. Optional chart lines for BF levels may also be displayed.
Transparency and behavior notes
• swing pivots repaint until confirmed
• higher-timeframe direction is only final at bar close
• dynamically derived BF levels may update as price forms new extremes
This script is intended purely for market-structure study and education. It does not guarantee performance, predict outcomes, or recommend trades.

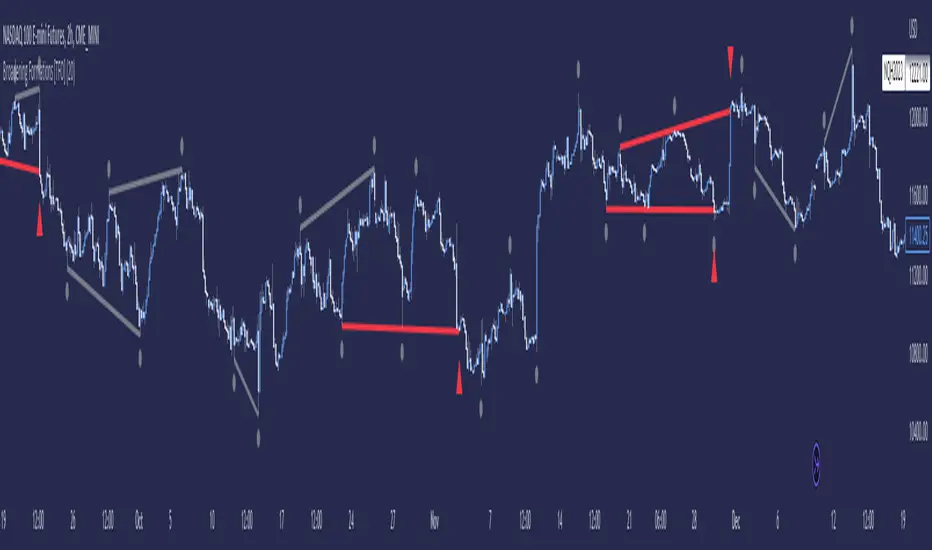
Broadening Formations [TFO]This indicator highlights deviations from broadening formations (or megaphone patterns). Deviations from broadening ranges can often foreshadow reversals, especially in consolidation phases. These deviations are highlighted via trendlines that change color when tested, and also have the option to be alerted.
These broadening formations are heavily used with "The Strat" and can add confluence when looking for reversals within higher timeframe points of interest.