RSI + Stochastic RSI Indicator CombinedFree to use RSI and Stochastic RSI, combined within one indicator.
The RSI and Stochastic RSI are two of the most commonly used and respected indicators in trading technical analysis. By placing them on top of each other you can save valuable space on your chart and stay more easily within your TradingView indicator limit.
The RSI is bright blue, with the "neutral" 30-70 chart area shaded blue.
The Stoch RSI is red and blue, with the "neutral" 20-80 chart area shaded purple.
None of the other annotations shown above will appear, they are only to demonstrate how they can be interpreted.
So what does the RSI do?
Broadly speaking, the Relative Strength Index measures the strength and movements of a market.
Above 70 the RSI is considered oversold = an increased likelihood of an incoming price drop.
Below 30 the RSI is considered undersold = an increased likelihood of an incoming price rise.
What does the Stochastic RSI do?
Broadly speaking, the Stochastic RSI measures the momentum of a market. It does this by measuring the RSI relative to its own high/low over the previous period.
Above 80 the Stoch RSI is considered oversold = an increased likelihood of an incoming price drop.
Below 20 the Stoch RSI is considered undersold = an increased likelihood of an incoming price rise.
Look for when the two Stoch RSI lines cross over - it is an important signal.
When the blue line is on top we have momentum driving the price up; when the red line is on top we have momentum driving the price down.
The key here is to look for periods where both the RSI and Stoch RSI are both low at the same time (especially on the daily chart) = an extremely promising entry point to catch a move up. Equally, looking for periods where both the RSI and Stoch RSI are very high is likely a good exit point (or at least a time to make absolutely certain you have a suitable stop-loss in place), because a price drop is likely not far away.
Remember: the Stoch RSI does not always fluctuate cleanly between the top and bottom. At any time it can change direction to reflect market conditions, which is why a stop loss is essential at all times. Equally, just because the RSI or Stoch RSI is at 100, it is still possible for it to keep going up due to whale action or traders FOMOing in. The same applies at low levels. Both these indicators represent historical data and therefore are not strictly predictive in nature, but show trends that may be in action.
Please give me a thumbs up and follow me if you found this useful. This tool is for educational purposes only and not a recommendation to buy or sell. Always do your own research before trading. Make sure to add this to your favourite scripts.
Best wishes,
BCryptological
ps - combine this powerful indicator with knowledge of strong support and resistance points with the 50/100/200 Moving Average . This will help you identify likely entry/exit points to maximise the accuracy of your predictions.
Btc!

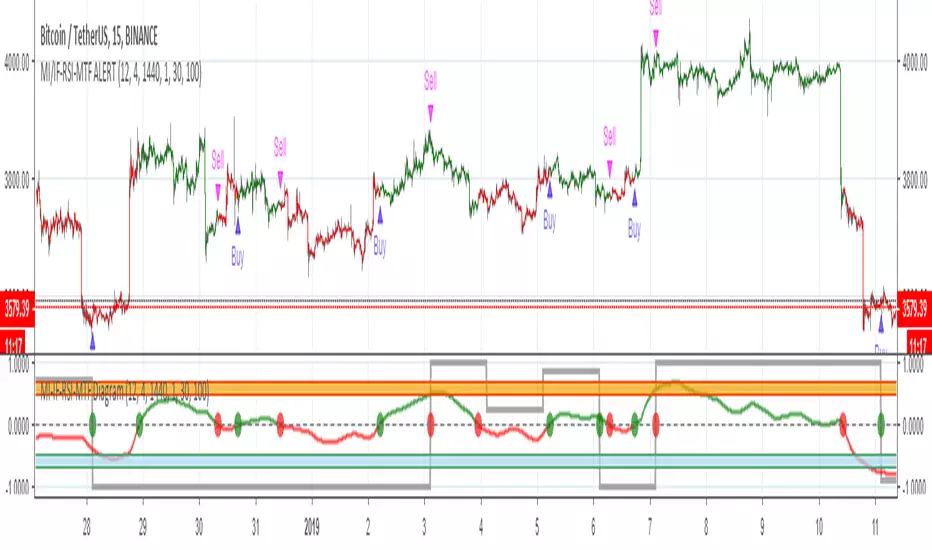
MOMENTUM INDICATOR / INVERS FISHER / RSI / MTF / ALERT// Alerts based on Momentum indicator and Inverse Fisher transform with Multi Time Frame function on Relative Strength Index (RSI)
// Greatest effect on 15M+ time frame
// Created and based on Binance chart
// Working with comission
// No repaints
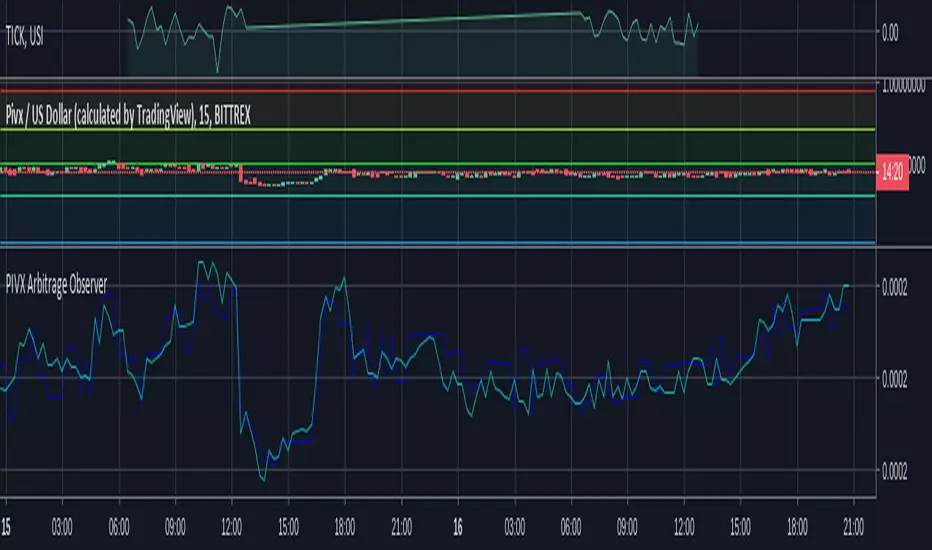
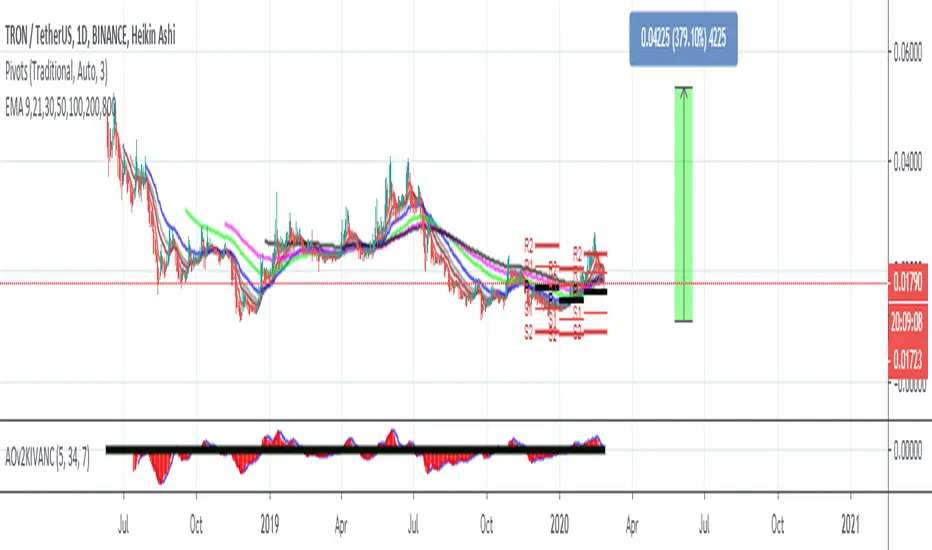
PIVX Arbitrage ObserverObserve PIVX price arbitrage in BTC on two exchanges that TradingView has listed. It's on a bunch more but TV doesn't track them :/
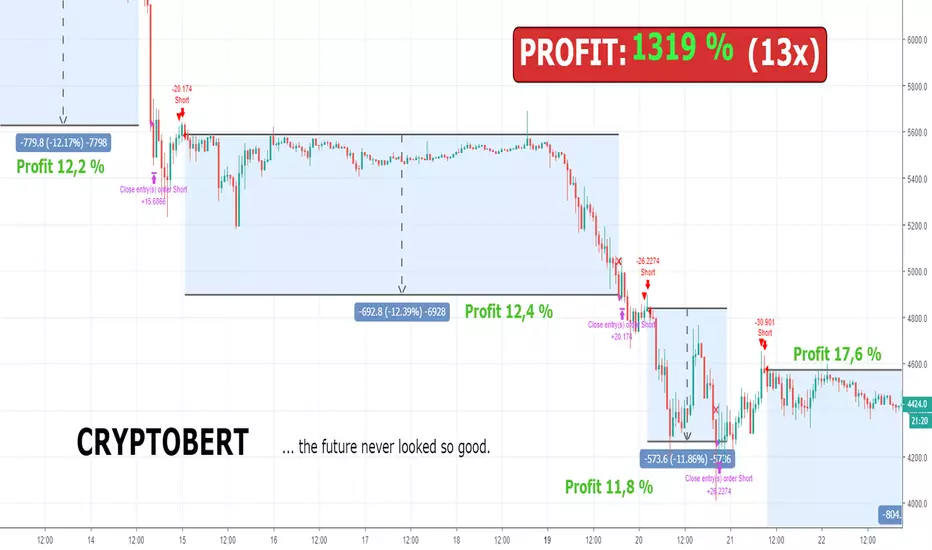
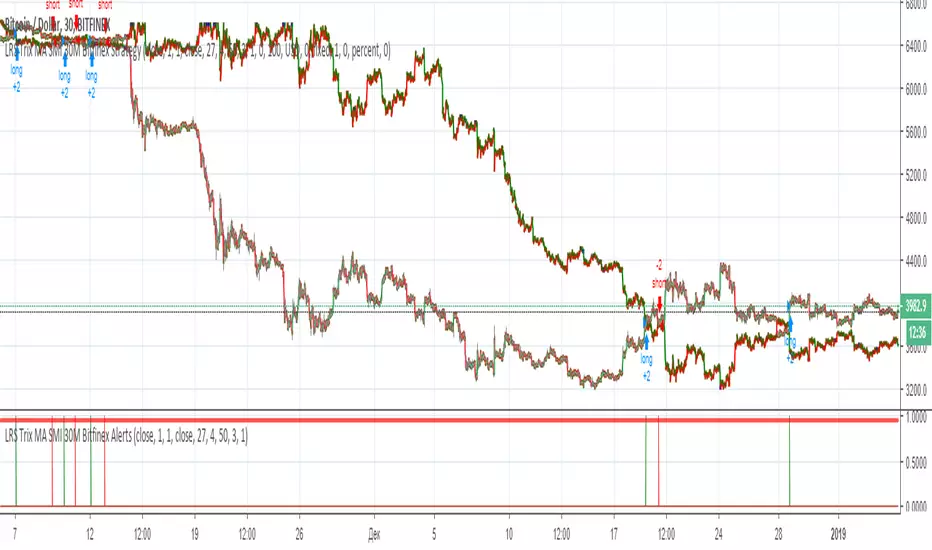
Bert LONG BTC Study (Alerts) - Profit 2018: 1319 % (no leverage)Bert LONG Term BTC study (BITMEX) - script for setting alerts and trading bots
This is a revolutionary strategy for bitcoin (XBT) trading. The strategy is perfectly configured for trading on the Bitmex exchange. No further configuration and setup is required.
The strategy itself recognizes a volatile period or whether the market is in downtrend, uptrend or sideways. Accordingly, it applies the appropriate orders to reach maximum profit.
The strategy can be handled manually, you can receive alerts (popup, email, sms) or can be fully automated by bot (works with: Autoview, Gunbot, Profitview, Jubot and others) without any manual intervention.
What is the minimum and maximum capital I can trade with?
You can trade with 0.0001BTC – 1000BTC. That is one of many advantages of using this strategy on XBT. There is enough liquidity to execute the order for the market price with a big investment amount.
What is the recommended setting?
Timeframe: 45m
Chart: Bitcoin/USD Dollar Perpetual Inverse Swap Contract (XBT)
Leverage: 2x
Orders: Long and Shorts
Why was this strategy created?
You have basically two option how to make money in crypto market. HODL (buy the coin and believe it will rise to the moon) and TRADING (only 3-5% traders are profitable, most of them are full time traders with 5+ years of experience in trading).
If you HODL btc in this year, you are -70 % this year
If you are TRADING, the results depend on how good you are (think about this, if you decide to be a heart surgeon, rocket star or NBA player, do you think you can be? Yes, you can but the chances are very small. The same probability you have that you will be in the 3-5% profitable traders 😊). It takes time, you need experience and still 96% all of you will never be a profitable traders!
If you use Bert BTC long term strategy, you are + 1319 % this year
How well the Bert BTC strategy performs?
Profit in 2018 was 1319 % / 13x (without leverage)
Profit in 2018 was 11 477 % / 115x (with leverage 2)
If you invested (with leverage 2) 1 000 USD you have now 114 766 USD
If you invested (with leverage 2) 10 000 USD you have now 1 147 660 USD
Detailed trades report for 2018 (you can calculate your own profit with specific investments and leverage) – download excel here
Notes:
You will hardly find better strategy on the market which achieves similar results with minimal risk and can operate in any market condition (downtrend, uptrend, sideways).
We guarantee the strategy does not repaint, and we use real candles (not heikin ashi or renko which does not reflect real prices).
We wish you to become financially independent and all your secret wishes to be fulfilled.
And in case if you still want to HODL or you want to be TRADING all the days watching to your monitors, consider to try our strategy at least with a minimum capital invested, you will see that you will not regret in long run. Be patient and the money will come to you!
For access to this strategy visit website: www.cryptobert.io
Momentum Indicator Alerts 15m// Alerts based on Momentum Indicator Strategy
// Greatest effect on 15M time frame
// Created and based on Binance chart
// Working with comission
// No repaints


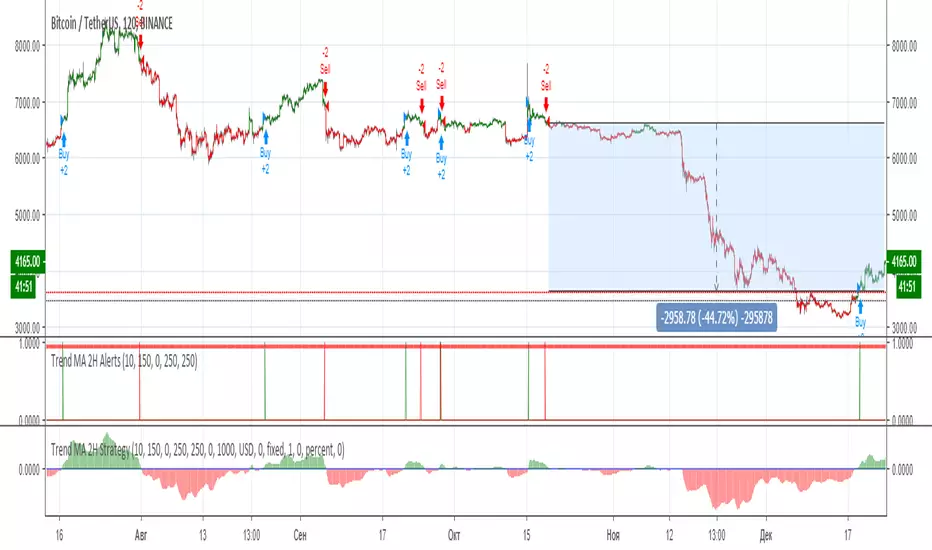
Trend MA 2H Alerts// Alerts based on the spread between the Slow and Fast Moving Average.
// Greatest effect on 2H time frame
// Created and based on Binance chart
// Working with comission
// No repaints
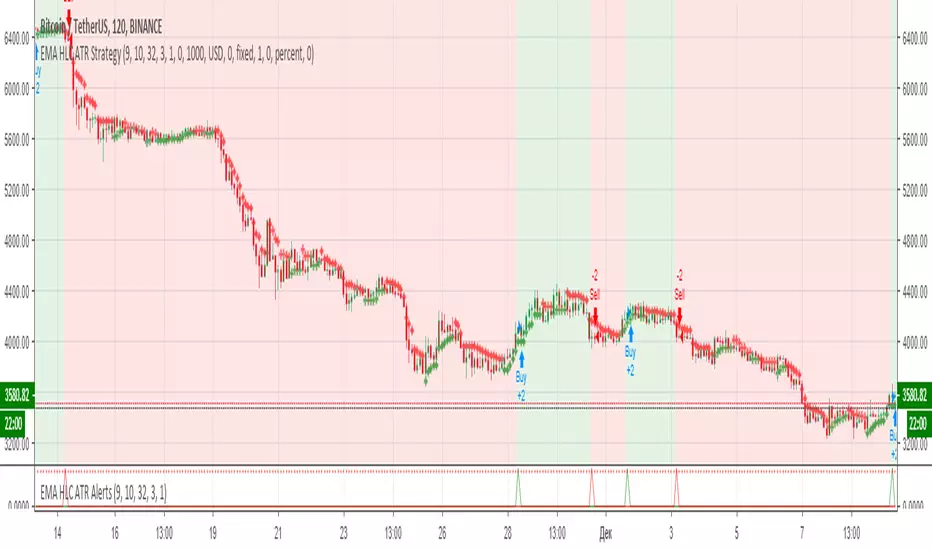
EMA HLC ATR Alerts// Alerts based on EMA HLC ATR Strategy
// Greatest effect on 2H time frame
// Created and based on Binance chart
// Working with comission
// No repaints
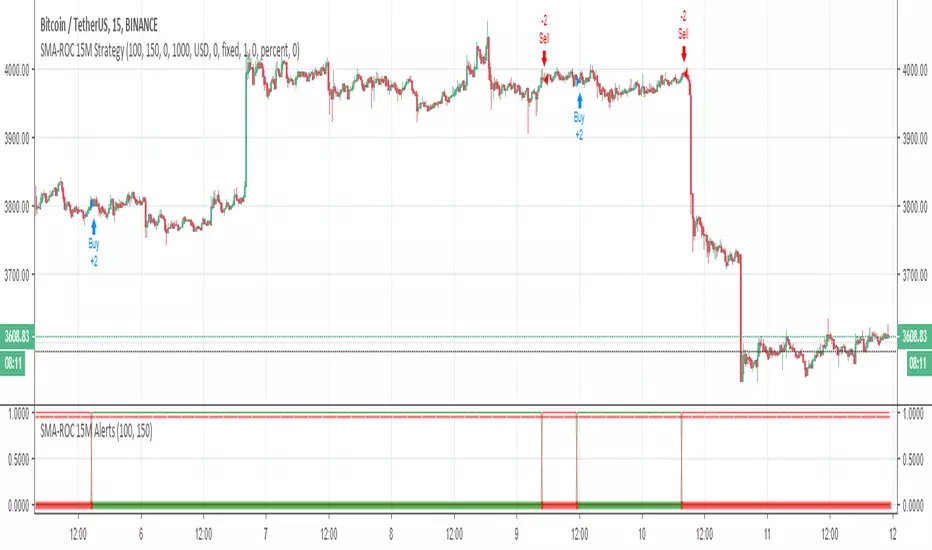
SMA-ROC 15M Alerts// Alerts based on Simple Moving Average (SMA) and Rate of Change (ROC) Strategy
// Greatest effect on 15M time frame
// Created and based on Binance chart
// Working with comission
// No repaints
CCV Crypto Margin Positions Via BitfinexAllows you to change between multiple assets to see open longs versus shorts. Includes BTC, ETH, LTC, TRX and more. You can also choose the quote pair of USD or BTC to get an idea for Bitmex assets as well. If you choose BTC on a BTC quote the USD positions will appear. All other assets will show the BTC paired positions.
Like and follow for more free scripts in the future.

BTC ETH RatioBTCUSD / ETHUSD Ratio.
You might find patterns when to move from BTC to ETH and vice versa.
# Open Source
The code is open source @ github.com and uses the commonpine library github.com

CCI Highlighted & Divergence Signals [CryptoProSignal]>> This is the updated version of my previous ' CCI Highlighted ' indicator/oscillator (checkout in my previous published scripts) .
> > Whats new :
> This version of CCI highlighted has integrated divergence signals to spot various divergences on any timeframe which ultimately saves your time rather than
spotting divergences by manual analysis. Thus making it CCI Highlighted & Divergence Signals indicator/oscillator.
> By default it is optimised to give you divergence signal whenever CCI Length1 is above 100 or below -100 but you can always enable all divergences in
setting/format by simple check/uncheck.
> Tag reference in indicator/oscillator :
* Tag "R" refers to Regular divergence.
* Tag "H" refers to Hidden divergence.
----------------------------------------------------------------------------------------------------------------------------------------------------------------------
----------------------------------------------------------------------------------------------------------------------------------------------------------------------
***Below is the description copy pasted from my previous version of CCI Highlighted for remaining functionality of this updated indicator/oscillator.***
>> This script is purely based on Commodity Channel Index ( CCI ) with multiple CCI instances being used within one oscillator.
>> User can use as much as 5 CCI instances/plot within one oscillator.
> How to use :
1. When Bullish :
Whenever CCI length 14 crosses above -100(negative 100) that means bullish momentum is supported.
Best bullish/long entry would be when CCI length 14 crosses above -100(negative 100) as mentioned above and at the same time CCI length
200 is bouncing on top of +100(positive 100).
2. When Bearish :
Whenever CCI length 14 crosses below +100(positive 100) that means bearish momentum is supported .
Best bearish/short entry would be when CCI length 14 crosses below +100(positive 100) as mentioned above and at the same time CCI length
200 is bouncing at bottom of -100(negative 100) .
> Color Clarity :
a. Bullish support is highlighted GREEN and bearish support is highlighted RED within the oscillator background with respect to
Length 1 (i.e 14 by default) .
b. PURPLE is highhighted when Length 5(i.e 200 by default) is bouncing either on top of +100(for bullish ) or at bottom of -100(for bearish ).
c. AQUA is highlighted when Length 3(i.e 50 by default) is bouncing on top or at bottom of 0 from either side respectively.
d. Best entry in both cases i.e bullish or bearish as mentioned above('How to use') is highlighted WHITE by default.
> Tip:
Just observe the color outputs on any timeframe in a chart as it works fractally on every timeframe , it will help you understand better with
clarity.
> You are always free to experiment with the CCI lengths, change highlighted color and hide/unhide the Lengths as per your requirements in
setting/format .

2 EMA CROSSOVERS 2H ALERTS// Alerts based on 2 moving average Strategy
// Greatest effect on 2H time frame
// Created and based on Binance chart
// Working with comission
// No repaints


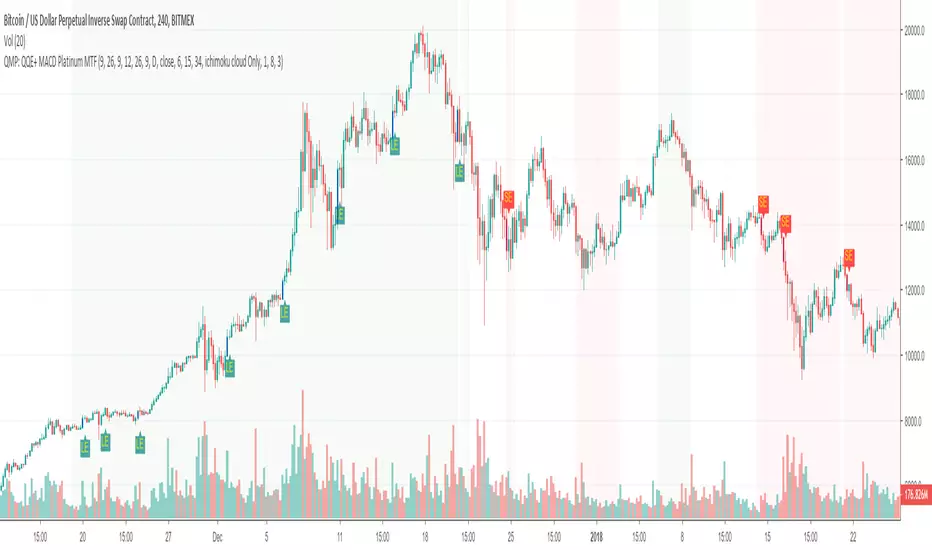
Trend following and reversal strategy for cryptoThe idea of this indicator comes from Jim Brown's book.
using the "MACD Platinum" and "QQE advanced" and multi-timeframe.
The difference to the original idea is that I use Ichimoku cloud for trend detection.
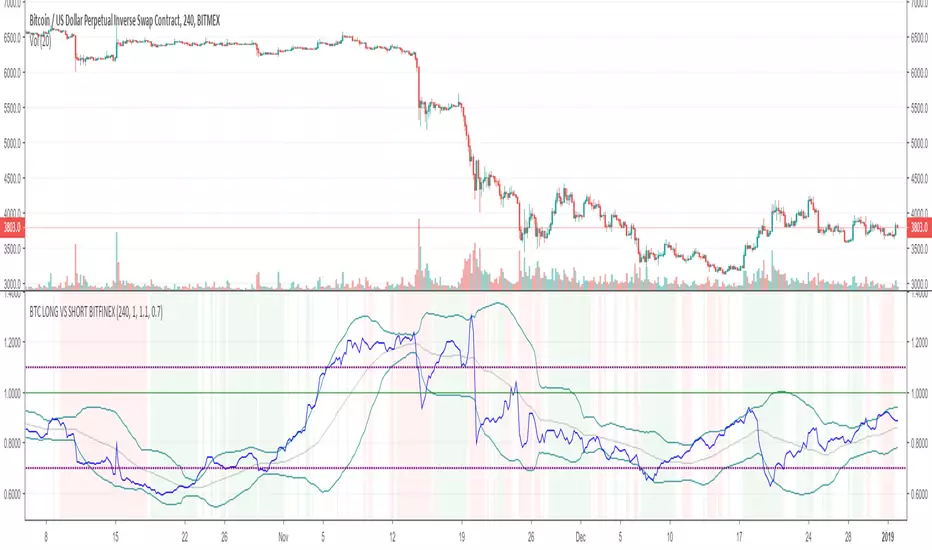
BTC LONGS VS SHORTS (With Demand of USDT)General idea is like this:
Go long when RULE 1 and RULE 2 are true:
RULE 1 - when USDT is in high demand (background is green)
RULE 2 - when Longs/Shorts is just recovered from Lower Bollinger Band
go short when the opposite is true.
you should also be careful and be prepared for a rise / fall when is below / above the purple dotted lines
you may want to ignore RULE1 since Bitmex doesn't use USDT to trade
This seems to work for the recent bear market while prices is driven largely by BTC margin or futures trading.
The rationale is that when a lot of people go short, the whales or the exchanges (who are of course unethical) will try to do the opposite to liquidate the accounts of retail traders.
BTC LONGS VS SHORTS (With Demand of USDT)General idea is like this:
go long when RULE 1 and RULE 2 are true:
RULE 1 - when USDT is in high demand (background is green)
RULE 2 - when Longs/Shorts is just recovered from Lower Bollinger Band
go short when the opposite is true.
This seems to work for the recent bear market while prices is driven largely by BTC margin or futures trading.
The rationale is that when a lot of people go short, the whales or the exchanges (who are of course unethical) will try to do the opposite to liquidate the accounts of retail traders.

Real Volume BTCStudy based and adjusted in real Bitcoin volume. It shows important areas of great activity that will help you make better decisions.
This indicator also shows complete cycles of price action based on volume.
In combination with other indicators, it becomes a powerful tool.

SSABU TOTAL / BTC / ETH / USDT Dominance
✅ TOTAL / BTC / ETH / USDT Dominance (total market cap / beat / ethernet / share) indicator.
This indicator is a supplementary indicator for the market share of TOTAL Market Cap / BTC / ETH / USDT.
You can check the above occupation rate in real time through the check box of the input. By default, only the dominance of the bit is set to come out.
If you want to see a different share of the bit, check the check box in the input box.
The above screen shot shows only the dominance of the default setting bit.
✅ TOTAL / BTC / ETH / USDT Dominance (총 마캣캡 / 비트 / 이더 / 유에스디티 점유율) 지표입니다.
본 지표는 TOTAL Market Cap / BTC / ETH / USDT의 점유율을 확인 할 수 있는 보조지표 입니다.
인풋의 체크박스를 통하여 위의 점유율을 실시간으로 확인 할 수 있고 기본으로는 비트의 도미넌스만 나오도록 설정하였습니다.
비트 외의 다른 점유율을 보고 싶으시면 인풋에서 체크박스 체크해주시면 확인 가능합니다.
위의 스크린샷은 기본설정인 비트의 도미넌스만 적용한 모습입니다.
✅ 매매에 도움되는 다른 보조지표
Basel ver 2.21

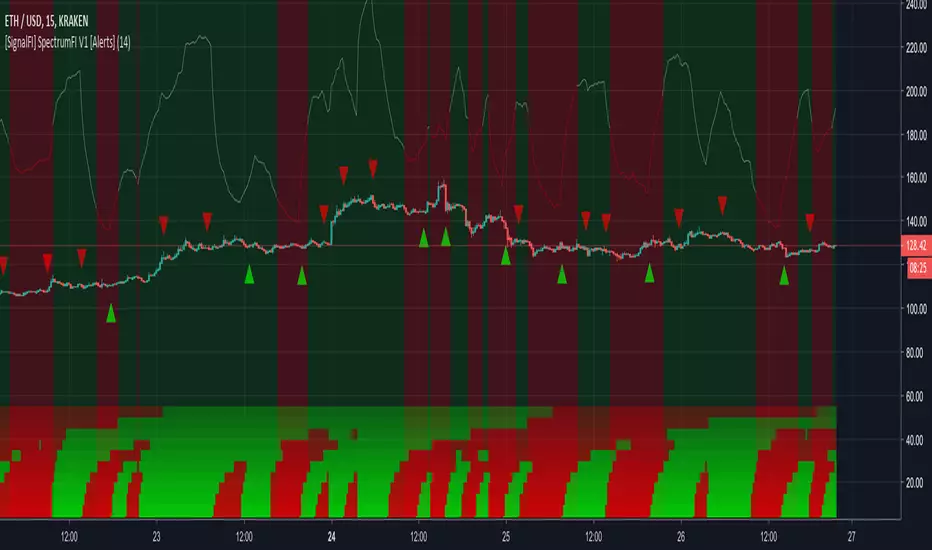
[SignalFI] SpectrumFI V1 [Alerts]SpectrumFI uses 11 independent Fibonacci based moving averages and their associated momentum to create a unified trend signal.
FIBONACCI BASED TREND DISCOVERY
DIFFERENCE STATISTICS COMBINED WITH RSI MOMENTUM
HEATMAP AND RSI INDICATORS BUILT INTO ONE TRADINGVIEW INDICATOR
ALERTS VERSION Only for Jedi and Master Subscribers
SignalFI was created to help traders and investors to effectively analyze the market based on the Golden Mean Ratio (Fibonacci numbers), plan a trade and ultimately execute it. To help inform and educate market decisions we developed a set of Trading Indicators which are available on TradingView , the most advanced and yet easy to use charting platform available on the web.
SignalFI indicators are just that, indicators. Our indicators are generally configured to use completely historical data (negating repaint), and we advise all alerts created with SignalFI indicators to be fired upon "close" of the current candle. Our indicators can provide valuable context and visualization support when performing market analysis and executing buy and sell decisions. However. we are not financial experts, and all information presented on this site or our other media outlets are for educational purposes only.
For subscription information, visit www.signalfi.net and follow us on twitter.
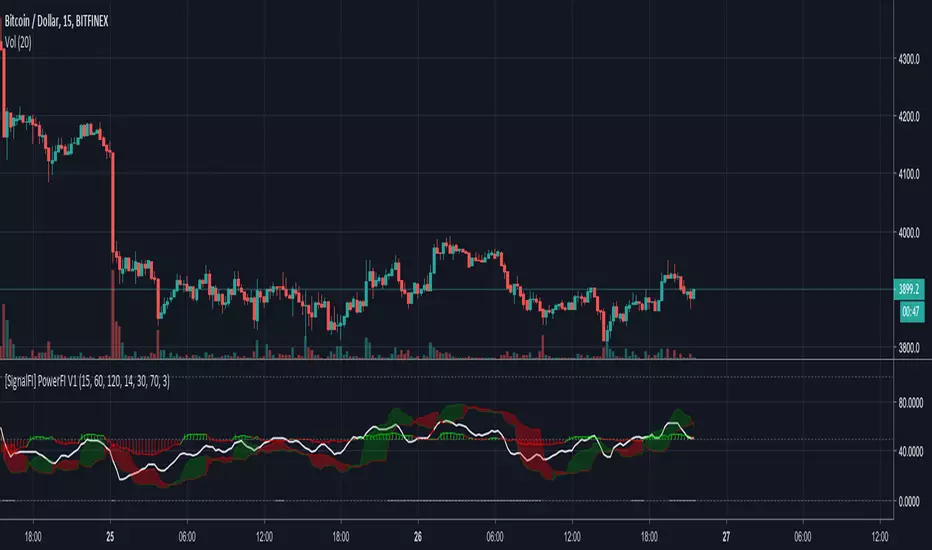
[SignalFI] PowerFI V1PowerFI is a multidimensional RSI that gives you insight into price momentum and trend crossovers via price statistics and rates of change.
MUTLTIPLE-TIMEFRAME RSI
DIFFERENCE STATISTICS COMBINED WITH RSI MOMENTUM
RSI IMPULSE STRENGTH HISTOGRAM
SignalFI was created to help traders and investors to effectively analyze the market based on the Golden Mean Ratio (Fibonacci numbers), plan a trade and ultimately execute it. To help inform and educate market decisions we developed a set of Trading Indicators which are available on TradingView , the most advanced and yet easy to use charting platform available on the web.
SignalFI indicators are just that, indicators. Our indicators are generally configured to use completely historical data (negating repaint), and we advise all alerts created with SignalFI indicators to be fired upon "close" of the current candle. Our indicators can provide valuable context and visualization support when performing market analysis and executing buy and sell decisions. However. we are not financial experts, and all information presented on this site or our other media outlets are for educational purposes only.
For subscription information, visit www.signalfi.net and follow us on twitter.