AltCoin & MemeCoin Index Correlation [Eddie_Bitcoin]🧠 Philosophy of the Strategy
The AltCoin & MemeCoin Index Correlation Strategy by Eddie_Bitcoin is a carefully engineered trend-following system built specifically for the highly volatile and sentiment-driven world of altcoins and memecoins.
This strategy recognizes that crypto markets—especially niche sectors like memecoins—are not only influenced by individual price action but also by the relative strength or weakness of their broader sector. Hence, it attempts to improve the reliability of trading signals by requiring alignment between a specific coin’s trend and its sector-wide index trend.
Rather than treating each crypto asset in isolation, this strategy dynamically incorporates real-time dominance metrics from custom indices (OTHERS.D and MEME.D) and combines them with local price action through dual exponential moving average (EMA) crossovers. Only when both the asset and its sector are moving in the same direction does it allow for trade entries—making it a confluence-based system rather than a single-signal strategy.
It supports risk-aware capital allocation, partial exits, configurable stop loss and take profit levels, and a scalable equity-compounding model.
✅ Why did I choose OTHERS.D and MEME.D as reference indices?
I selected OTHERS.D and MEME.D because they offer a sector-focused view of crypto market dynamics, especially relevant when trading altcoins and memecoins.
🔹 OTHERS.D tracks the market dominance of all cryptocurrencies outside the top 10 by market cap.
This excludes not only BTC and ETH, but also major stablecoins like USDT and USDC, making it a cleaner indicator of risk appetite across true altcoins.
🔹 This is particularly useful for detecting "Altcoin Season"—periods where capital rotates away from Bitcoin and flows into smaller-cap coins.
A rising OTHERS.D often signals the start of broader altcoin rallies.
🔹 MEME.D, on the other hand, captures the speculative behavior of memecoin segments, which are often driven by retail hype and social media activity.
It's perfect for timing momentum shifts in high-risk, high-reward tokens.
By using these indices, the strategy aligns entries with broader sector trends, filtering out noise and increasing the probability of catching true directional moves, especially in phases of capital rotation and altcoin risk-on behavior.
📐 How It Works — Core Logic and Execution Model
At its heart, this strategy employs dual EMA crossover detection—one pair for the asset being traded and one pair for the selected market index.
A trade is only executed when both EMA crossovers agree on the direction. For example:
Long Entry: Coin's fast EMA > slow EMA and Index's fast EMA > slow EMA
Short Entry: Coin's fast EMA < slow EMA and Index's fast EMA < slow EMA
You can disable the index filter and trade solely based on the asset’s trend just to make a comparison and see if improves a classic EMA crossover strategy.
Additionally, the strategy includes:
- Adaptive position sizing, based on fixed capital or current equity (compound mode)
- Take Profit and Stop Loss in percentage terms
- Smart partial exits when trend momentum fades
- Date filtering for precise backtesting over specific timeframes
- Real-time performance stats, equity tracking, and visual cues on chart
⚙️ Parameters & Customization
🔁 EMA Settings
Each EMA pair is customizable:
Coin Fast EMA: Default = 47
Coin Slow EMA: Default = 50
Index Fast EMA: Default = 47
Index Slow EMA: Default = 50
These control the sensitivity of the trend detection. A wider spread gives smoother, slower entries; a narrower spread makes it more responsive.
🧭 Index Reference
The correlation mechanism uses CryptoCap sector dominance indexes:
OTHERS.D: Dominance of all coins EXCLUDING Top 10 ones
MEME.D: Dominance of all Meme coins
These are dynamically calculated using:
OTHERS_D = OTHERS_cap / TOTAL_cap * 100
MEME_D = MEME_cap / TOTAL_cap * 100
You can select:
Reference Index: OTHERS.D or MEME.D
Or disable the index reference completely (Don't Use Index Reference)
💰 Position Sizing & Risk Management
Two capital allocation models are supported:
- Fixed % of initial capital (default)
- Compound profits, which scales positions as equity grows
Settings:
- Compound profits?: true/false
- % of equity: Between 1% and 200% (default = 10%)
This is critical for users who want to balance growth with risk.
🎯 Take Profit / Stop Loss
Customizable thresholds determine automatic exits:
- TakeProfit: Default = 99999 (disabled)
- StopLoss: Default = 5 (%)
These exits are percentage-based and operate off the entry price vs. current close.
📉 Trend Weakening Exit (Scale Out)
If the position is in profit but the trend weakens (e.g., EMA color signals trend loss), the strategy can partially close a configurable portion of the position:
- Scale Position on Weak Trend?: true/false
- Scaled Percentage: % to close (default = 65%)
This feature is useful for preserving profits without exiting completely.
📆 Date Filter
Useful for segmenting performance over specific timeframes (e.g., bull vs bear markets):
- Filter Date Range of Backtest: ON/OFF
- Start Date and End Date: Custom time range
OTHER PARAMETERS EXPLANATION (Strategy "Properties" Tab):
- Initial Capital is set to 100 USD
- Commission is set to 0.055% (The ones I have on Bybit)
- Slippage is set to 3 ticks
- Margin (short and long) are set to 0.001% to avoid "overspending" your initial capital allocation
📊 Visual Feedback and Debug Tools
📈 EMA Trend Visualization
The slow EMA line is dynamically color-coded to visually display the alignment between the asset trend and the index trend:
Lime: Coin and index both bullish
Teal: Only coin bullish
Maroon: Only index bullish
Red: Both bearish
This allows for immediate visual confirmation of current trend strength.
💬 Real-Time PnL Labels
When a trade closes, a label shows:
Previous trade return in % (first value is the effective PL)
Green background for profit, Red for losses.
📑 Summary Table Overlay
This table appears in a corner of the chart (user-defined) and shows live performance data including:
Trade direction (yellow long, purple short)
Emojis: 💚 for current profit, 😡 for current loss
Total number of trades
Win rate
Max drawdown
Duration in days
Current trade profit/loss (absolute and %)
Cumulative PnL (absolute and %)
APR (Annualized Percentage Return)
Each metric is color-coded:
Green for strong results
Yellow/orange for average
Red/maroon for poor performance
You can select where this appears:
Top Left
Top Right
Bottom Left
Bottom Right (default)
📚 Interpretation of Key Metrics
Equity Multiplier: How many times initial capital has grown (e.g., “1.75x”)
Net Profit: Total gains including open positions
Max Drawdown: Largest peak-to-valley drop in strategy equity
APR: Annualized return calculated based on equity growth and days elapsed
Win Rate: % of profitable trades
PnL %: Percentage profit on the most recent trade
🧠 Advanced Logic & Safety Features
🛑 “Don’t Re-Enter” Filter
If a trade is closed due to StopLoss without a confirmed reversal, the strategy avoids re-entering in that same direction until conditions improve. This prevents false reversals and repetitive losses in sideways markets.
🧷 Equity Protection
No new trades are initiated if equity falls below initial_capital / 30. This avoids overleveraging or continuing to trade when capital preservation is critical.
Keep in mind that past results in no way guarantee future performance.
Eddie Bitcoin
Btcdominance

Trojan Cycle: Dip & Profit Hunter📉 Crypto is changing. Your signals should too.
This script doesn’t try to outguess price — it helps you track capital rotation and flow behavior in alignment with the evolving macro structure of the digital asset market.
Trojan Cycle: Dip & Profit Hunter is a signal engine built to support and validate the capital rotation models outlined in the Trojan Cycle and Synthetic Rotation theses — available via RWCS_LTD’s published charts
It is not a classic “buy low, sell high” tool. It is a structural filter that uses price/volume statistics to surface accumulation zones, synthetic traps, and macro context shifts — all aligned with the institutionalization of crypto post-2024.
🧠 Purpose & Value
Crypto no longer follows the retail-led, halving-driven pattern of 2017 or 2021.
Instead, institutional infrastructure, regulatory filters, and equity-market Trojan horses define the new path of capital.
This tool helps you visualize that path by interpreting behavior through statistical imbalances and real-time momentum signals.
Use it to:
Track where capital is accumulating or exiting
Identify signals consistent with true cycle rotation (vs. synthetic traps)
Validate your macro view with real-time statistical context
🔍 How It Works
The engine combines four signal layers:
1. Z-Score Logic
- Measures how far price and volume have deviated from their mean
- Detects dips, blowoffs, and exhaustion zones
2. Percentile Logic
- Compares current price and volume to historical rank distribution
- Flags statistically rare conditions (e.g. bottom 10% price, top 90% volume)
3. Combined Context Engine
- Integrates both models to generate one of 36 unique output states
- Each state provides a labeled market context (e.g., 🟢 Confluent Buy, 🔴 Confluent Sell, 🧨 Synthetic Trap )
4. Momentum Spread & Divergence
- Measures whether price is leading volume (trap risk) or volume is leading price (accumulation)
- Outputs intuitive momentum context with emoji-coded alerts
📋 What You See
🧠 Contextual Table UI with key Z-Scores, percentiles, signals, and market commentary
🎯 Emoji-coded signals to quickly grasp high-probability setups or risk zones
🌊 Optional overlays: price/volume divergence, momentum spread
🎨 Visual table customization (size, position) and chart highlights for signal clarity
🔔 Alert System
✅ Single dynamic alert using alert() that only fires when signal context changes
Prevents alert fatigue and allows clean webhook/automation integration
🧭 Use Cases
For macro cycle traders: Track where we are in the Trojan Cycle using statistical context
For thesis explorers: Use the 36-output signal map to match against your rotation thesis
For capital rotation watchers: Identify structural setups consistent with ETF-driven or compliance-filtered flow
For narrative skeptics: Avoid synthetic altseason traps where volume lags or flow dries up
🧪 Suggested Pairing for Thesis Validation
To use this tool as part of a thesis-confirmation framework , pair it with:
BTC.D — Bitcoin Dominance
ETH/BTC — Ethereum strength vs. Bitcoin
TOTALE100/ETH — Altcoin strength relative to ETH
RWCS_LTD’s published charts and macro cycle models
🏁 Final Note
Crypto has matured. So should your signals.
This tool doesn’t try to game the next 2 candles. It helps you understand the current phase in a compliance-filtered, institutionalized rotation model.
It’s not built for hype — it’s built for conviction.
Explore the thesis → Validate the structure → Trade with clarity.
🚨 Disclaimer
This script is not financial advice. It is an analytical tool designed to support market structure research and rotation thesis validation. Use this as part of a broader framework including technical structure, dominance charts, and macro data.

ZenAlgo - DominatorThis indicator provides a structured multi-ticker overview of market momentum and relative strength by analyzing short-term price behavior across selected assets in comparison with broader crypto dominance and Bitcoin/ETH performance.
Ticker and Market Data Handling
The script accepts up to 9 user-defined symbols (tickers) along with BTCUSD and ETHUSD. For each symbol:
It retrieves the current price.
It also requests the daily opening price from the "D" timeframe to compute intraday percentage change.
For BTC, ETH, and dominance (sum of BTC, USDT, and USDC dominance), daily change is calculated using this same method.
This comparison enables tracking relative performance from the daily open, which provides meaningful insight into intraday strength or weakness among different assets.
Dominance Logic
The indicator aggregates dominance data from BTC , USDT , and USDC using TradingView’s CRYPTOCAP indices. This combined dominance is used as a reference in directional and status calculations. ETH dominance is also analyzed independently.
Changes in dominance are used to infer whether market attention is shifting toward Bitcoin/stablecoins (typically indicating risk-off sentiment) or away from them (typically risk-on behavior, benefiting altcoins).
Price Direction Estimation
The script estimates directional bias using an EMA-based deviation technique:
A short EMA (user-defined lookback , default 4 bars) is calculated.
The current close is compared to the EMA to assess directional bias.
Recent candle changes are also inspected to confirm a consistent short-term trend (e.g., 3 consecutive higher closes for "up").
A small threshold is used to avoid classifying flat movements as trends.
This directionality logic is applied separately to:
The selected ticker's price
BTC price
Combined dominance
This allows the script to contextualize the movement of each asset within broader market conditions.
Market Status Evaluation
A custom function analyzes ETH and BTC dominance trends along with their relative strength to define the overall market regime:
Altseason is identified when BTC dominance is declining, ETH dominance rising, and ETH outperforms BTC.
BTC Season occurs when BTC dominance is rising, ETH dominance falling, and BTC outperforms ETH.
If neither condition is met, the state is Neutral .
This classification is shown alongside each ticker's row in the table and helps traders assess whether market conditions favor Bitcoin, Ethereum, or altcoins in general.
Ticker Status Classification
Each ticker is analyzed independently using the earlier directional logic. Its status is then determined as follows:
Full Bull : Ticker is trending up while dominance is declining or BTC is also rising.
Bullish : Ticker is trending up but not supported by broader bullish context.
Bearish : Ticker is trending down but without broader confirmation.
Full Bear : Ticker is trending down while dominance rises or BTC falls.
Neutral : No strong directional bias or conflicting context.
This classification reflects short-term momentum and macro alignment and is color-coded in the results table.
Table Display and Plotting
A configurable table is shown on the chart, which:
Displays the name and status of each selected ticker.
Optionally includes BTC, ETH, and market state.
Uses color-coding for intuitive interpretation.
Additionally, price changes from the daily open are plotted for each selected ticker, BTC, ETH, and combined dominance. These values are also labeled directly on the chart.
Labeling and UX Enhancements
Labels next to the current candle display price and percent change for each active ticker and for BTC, ETH, and combined dominance.
Labels update each bar, and old labels are deleted to avoid clutter.
Ticker names are dynamically shortened by stripping exchange prefixes.
How to Use This Indicator
This tool helps traders:
Spot early rotations between Bitcoin and altcoins.
Identify intraday momentum leaders or laggards.
Monitor which tickers align with or diverge from broader market trends.
Detect possible sentiment shifts based on dominance trends.
It is best used on lower to mid timeframes (15m–4h) to capture intraday to short-term shifts. Users should cross-reference with longer-term trend tools or structural indicators when making directional decisions.
Interpretation of Values
% Change : Measures intraday move from daily open. Strong positive/negative values may indicate breakouts or reversals.
Status : Describes directional strength relative to market conditions.
Market State : Gives a general bias toward BTC dominance, ETH strength, or altcoin momentum.
Limitations & Considerations
The indicator does not analyze liquidity or volume directly.
All logic is based on short-term movements and may produce false signals in ranging or low-volume environments.
Dominance calculations rely on external CRYPTOCAP indices, which may differ from exchange-specific flows.
Added Value Over Other Free Tools
Unlike basic % change tables or price overlays, this indicator:
Integrates dominance-based macro context into ticker evaluation.
Dynamically classifies market regimes (BTC season / Altseason).
Uses multi-factor logic to determine ticker bias, avoiding single-metric interpretation.
Displays consolidated information in a table and chart overlays for rapid assessment.

Regime Filter IndicatorRegime Filter – Crypto Market Trend Indicator
📊 Overview
The Regime Filter is a powerful market analysis indicator designed specifically for crypto trading. It helps traders identify whether the market is in a bullish or bearish phase by analyzing key assets in the cryptocurrency market, including Bitcoin (BTC), Bitcoin Dominance (BTC.D), and the Altcoin Market (TOTAL3). The indicator compares these assets against their respective Simple Moving Averages (SMA) to determine the overall market regime, allowing traders to make more informed decisions.
🔍 How It Works
The Regime Filter evaluates three main components to determine the market's sentiment:
1. BTC Dominance (BTC.D) vs. 40 SMA (Medium Timeframe)
The Bitcoin Dominance (BTC.D) is compared to its 40-period SMA on a mid-timeframe (e.g.,
1-hour). If BTC.D is below the 40 SMA, it indicates that altcoins are performing well relative
to Bitcoin, suggesting a bullish altcoin market. If BTC.D is above the 40 SMA, Bitcoin is
gaining dominance, indicating a potential bearish phase for altcoins.
2. TOTAL3 Market Cap vs. 100 SMA (Medium Timeframe)
The TOTAL3 index, which tracks the total market capitalization of all cryptocurrencies except
Bitcoin and Ethereum, is compared to its 100-period SMA. A bullish signal occurs when TOTAL3
is above the 100 SMA, indicating strength in altcoins, while a bearish signal occurs when
TOTAL3 is below the 100 SMA, signaling a potential weakness in the altcoin market.
3. BTC Price vs. 200 SMA (Higher Timeframe)
The current Bitcoin price is compared to its 200-period Simple Moving Average (SMA) on a
higher timeframe (e.g., 4-hour). A bullish signal is given when the BTC price is above the 200
SMA, and a bearish signal when it's below.
🟢 Bullish Market Conditions
The market is considered bullish when:
- BTC Dominance (BTC.D) is below the 40 SMA, suggesting altcoins are gaining momentum.
- TOTAL3 Market Cap is above the 100 SMA, signaling strength in the altcoin market.
- BTC price is above the 200 SMA, indicating an uptrend in Bitcoin.
In these conditions, the background turns green 🟢, and a "Bullish" label is displayed on the chart.
🔴 Bearish Market Conditions
The market is considered bearish when:
- BTC Dominance (BTC.D) is above the 40 SMA, indicating Bitcoin is outperforming altcoins.
- TOTAL3 Market Cap is below the 100 SMA, signaling weakness in altcoins.
- BTC price is below the 200 SMA, indicating a downtrend in Bitcoin.
In these conditions, the background turns red 🔴, and a "Bearish" label appears on the chart.
⚙ Customization Options
- The Regime Filter offers flexibility for traders:
- Enable or Disable Specific SMAs: Customize the indicator by enabling or disabling the 200 SMA for Bitcoin, the 40 SMA for BTC Dominance, and the 100 SMA for TOTAL3.
- Adjust Timeframes: Choose the timeframes for each of the moving averages to suit your preferred trading strategy.
- Real-Time Data Adjustments: The indicator updates in real-time to reflect current market conditions, ensuring timely analysis.
📈 Best Use Cases
- Trend Confirmation: The Regime Filter is ideal for confirming the market's overall trend,
helping traders to align their positions with the dominant market sentiment.
- Trade Entry/Exit Signals: Use the indicator to identify favorable entry or exit points based on
whether the market is in a bullish or bearish phase.
- Market Overview: Gain a quick understanding of the broader crypto market, with a focus on
Bitcoin and altcoins, to make more strategic decisions.
⚠️ Important Notes
Trend-Following Indicator: The Regime Filter is a trend-following tool, meaning it works best in strong trending markets. It may not perform well in choppy, sideways markets.
Risk Management: This indicator is designed to assist in identifying market trends, but it does not guarantee profits. Always apply sound risk management strategies and use additional indicators when making trading decisions.
Not a Profit Guarantee: While this indicator can help identify potential market trends, no trading tool or strategy guarantees profits. Please trade responsibly and ensure that your decisions are based on comprehensive analysis and risk tolerance.

BTC Dominance Trend CheckerThis monitors the Bitcoin dominance (BTC.D) in the market. It retrieves the current and previous day's BTC dominance values, determines whether dominance is increasing or decreasing, and visually displays the trend.
Simple Dominance Momentum IndicatorThe Simple Dominance Momentum Indicator is a powerful tool for tracking market trends in the world of cryptocurrency. By analyzing the relationship between dominance and market movement, this indicator helps traders identify when money is flowing into or out of the market.
Using the pane structure on TradingView, the Dominance Momentum Indicator makes it easy to visualize and track data from CryptoCap charts. Whether you're a seasoned investor or starting out, this indicator can help you make more informed trading decisions.
All this indicator does is create the pane with a line chart using the Dominance charts to allow you to see the data with one button instead of doing it all manually. However with the addition to allow it to toggle between crypto and stables, so if you are using a /BTC pair, you don't have to add a new pane on, it automatically converts. If you are looking at USDT pairs for example, it will highlight that one for you.
While it can work under any conditions, the Dominance Momentum Indicator is particularly effective on higher timeframes, providing valuable insight into the overall plot of the market trend. With a 55EMA and a faster-moving average of 21EMA, this indicator is designed to help you stay ahead of the curve and make smarter trading decisions.
Remember the golden rule for stablecoin dominance. Down = good, and up = bad; however, you can just invert the indicator, so it flows with the market.
When it comes to the dominance of individual cryptocurrencies, for example, DOT.D, you might find that it going up = increasing dominance is STRENGTH. If the dominance of that is increasing it means it's growing.
Creator Credit: Jamie Goodland

Indicator for proxy BTC and ALT dominanceThis indicator calculates a proxy for BTC dominance and ALT domance from total crypto cap by removing USDT and USDC. The indicator has 4 plots:
Proxy BTC Dominance = BTC dominance / (total crypto cap - stablecoin cap)
Proxy ALT Dominance = (Total crypto cap - stablecoins - btc cap) / (total crypto cap - stablecoin cap)
A reference plot of BTC Dominance
A reference plot of Stablecoin dominance

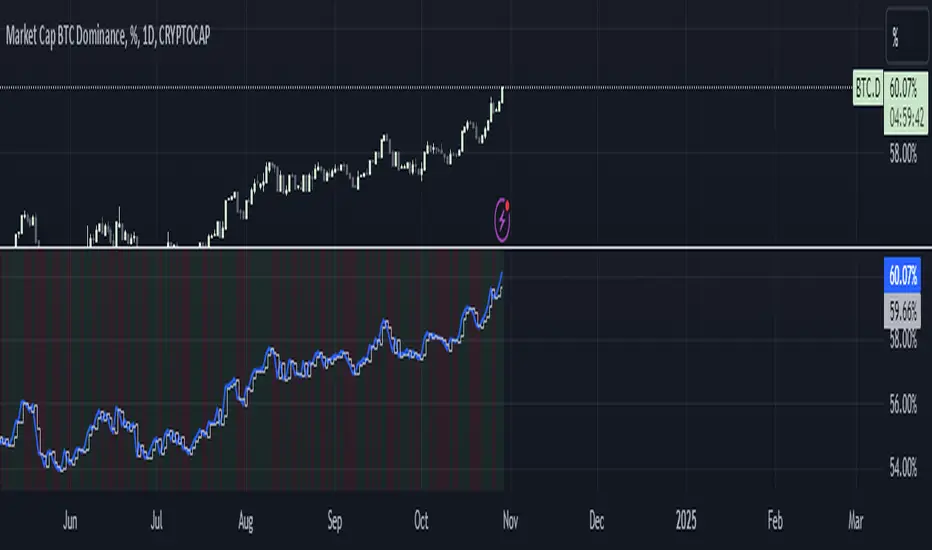
BTC Dominance TrendThis simple script applies the DMI/ADX (trend) indicator to the Bitcoin Dominance Index (BTC.D) to check whether BTC is increasing its dominance or not on that day. It is meant to be applied to altcoins on medium intervals. I put it together to test the following hypothesis: On days when BTC dominance is on the rise, altcoins are harder to take off, because Bitcoin is draining the lifeblood out of them, so caution is needed when opening trades.
Olive background means BTC dominance is rising on that day, purple that it is decreasing. White background means it is not moving significantly in any direction.
You can change the resolution (i.e. apply the DMI/ADX to a different BTC.D interval), just make sure to lower the threshold as well. I hope you find a good use for it! Beware if you try to incorporate it in your strategy, it uses higher timeframe data and hence is prone to repainting.
