Lakshmi - Low Volatility Range Breakout (LVRB)⚡️ Overview
The Low Volatility Range Breakout (LVRB) indicator is designed to identify consolidation phases characterized by suppressed volatility and generate actionable signals when price breaks out of these ranges. The underlying premise is rooted in the market principle that periods of low volatility often precede significant directional moves—volatility contraction leads to expansion.
Important Note on Optimization: The default parameter settings of this indicator have been specifically optimized for BTCUSDT on the 2-hour (2H) timeframe. While the indicator can be applied to other instruments and timeframes, users are encouraged to adjust the parameters accordingly to suit different trading conditions and asset characteristics.
This indicator automates the detection of "quiet" accumulation/distribution zones and provides clear visual cues and alerts when a breakout occurs.
⚡️ How to Use
1. Add the indicator to your chart. Default settings are optimized for BTCUSDT 2H.
2. Wait for a gray box to appear—this indicates a qualified low-volatility range is forming.
3. Monitor for breakout signals:
• LONG (green triangle below bar): Price broke above the range. Consider entering a long position.
• SHORT (red triangle above bar): Price broke below the range. Consider entering a short position.
4. Set alerts using "LVRB LONG" or "LVRB SHORT" to receive notifications on confirmed breakouts.
5. Adjust parameters as needed for different instruments or timeframes.
Tip: Combine with volume analysis or trend filters for higher-probability setups.
⚡️ How It Works
1. Low Volatility Bar Detection
A bar is classified as "low volatility" when it meets the following criteria:
• True Range (TR) is at or below the average TR (Simple Moving Average) multiplied by a user-defined threshold.
• (Optional) Candle Body is at or below the average body size multiplied by a separate threshold.
This dual-filter approach helps isolate bars that exhibit genuine compression in both range and directional commitment.
2. Range Box Formation
When consecutive low-volatility bars are detected, the indicator begins constructing a consolidation box:
• The box expands to encompass the high and low of qualifying bars.
• A minimum number of bars and a minimum fraction of low-volatility bars are required for the box to become "qualified" (active).
• A configurable tolerance allows for a limited number of consecutive non-low-vol bars within the sequence, accommodating minor noise without invalidating the range.
• If the box height exceeds a maximum threshold (defined as a multiple of the base ATR at sequence start), the range is invalidated.
3. Breakout Detection
Once a qualified range is established, the indicator monitors for breakouts:
• Wick Mode: Requires both a wick pierce beyond the range boundary AND a close outside the range.
• Close Mode: Requires only a close beyond the range boundary.
• (Optional) Breakout Body Filter: The breakout candle's body must exceed a multiple of the average body size at range formation.
• (Optional) Candle Direction Filter: Bullish breakouts require a green candle; bearish breakouts require a red candle.
Signals are displayed in real-time and confirmed upon bar close.
⚡️ Inputs & Parameters
• Volatility Window: Lookback period for calculating average TR and average body size.
• TR Multiplier: A bar's TR must be ≤ avgTR × this value to qualify as low-vol.
• Body Multiplier: A bar's body must be ≤ avgBody × this value (if body filter is enabled).
• Use Body Filter: Toggle the body size filter on/off.
• Min Bars in Box: Minimum number of bars required for a range to become qualified.
• Min Low-Vol Fraction: Minimum proportion of bars in the sequence that must be low-vol.
• Allowed Consecutive Non-Low-Vol Bars: Tolerance for consecutive bars that do not meet low-vol criteria.
• Max Box Height: Maximum allowed range height as a multiple of the base ATR.
• Breakout Mode: Choose between "Wick" (pierce + close) or "Close" (close only).
• Breakout Body Multiplier: Require breakout candle body ≥ avgBody × this value (1.0 = OFF).
• Require Candle Direction: Enforce green candle for LONG, red candle for SHORT.
⚡️ Visual Features
• Consolidation Boxes: Displayed in neutral (gray) color during formation. Upon a confirmed breakout, the box is colored green for bullish breakouts or red for bearish breakouts.
• Breakout Signals:
• LONG: Green upward triangle displayed below the price bar with "LONG" label.
• SHORT: Red downward triangle displayed above the price bar with "SHORT" label.
• Range Levels: Optional horizontal plots for the active range's high and low.
• Invalidated Boxes: Optionally retained in neutral (gray) color or deleted from the chart.
• Full Customization: Colors, transparency, and border width are all adjustable.
⚡️ Alerts
Two alert conditions are available:
• LVRB LONG: Triggered on a confirmed bullish breakout (bar close).
• LVRB SHORT: Triggered on a confirmed bearish breakout (bar close).
⚡️ Use Cases
• Breakout Trading: Enter positions when price escapes a well-defined low-volatility range.
• Volatility Expansion Plays: Anticipate increased volatility following periods of compression.
• Filtering Choppy Markets: Avoid trading during extended consolidation; wait for confirmed breakouts.
• Multi-Timeframe Analysis: Use on higher timeframes to identify major consolidation zones.
⚡️ Notes
• Best used in conjunction with volume analysis, trend context, or support/resistance levels for confirmation.
• Performance varies across instruments and timeframes; backtesting and parameter optimization are recommended.
⚡️ Credits
Developed by Lakshmi. Inspired by volatility contraction principles and range breakout methodologies.
⚡️ Disclaimer
This indicator is provided for educational and informational purposes only. It does not constitute financial advice, investment recommendations, or a guarantee of profits. Trading financial instruments involves substantial risk, and you may lose more than your initial investment. Past performance, whether indicated by backtesting or historical analysis, does not guarantee future results. The use of this indicator does not ensure or promise any profits or protection against losses. Users are solely responsible for their own trading decisions and should conduct their own research and/or consult with a qualified financial advisor before making any investment decisions. By using this indicator, you acknowledge and accept that you bear full responsibility for any trading outcomes.
Btctrade

Kalman Exponentialy Weighted Moving Average | MisinkoMasterThe Kalman Exponentialy Weighted Moving Average is a technical analysis tool providing users with more responsive and smoother signals, providing crystal-clear signals and giving investors valuable insights on market trends, however it could be used in many cases.
A deeper dive into the indicator:
When going through my creation of strategies, I had stumbled on an indicator called "EWMA", which worked decently, but it was far too simple in my opinion so I decided to combine the EMA & WMA, but with a little more complexity, and it has worked .
I began by learning how both MAs work, I already knew how WMA works, but EMA I did not.
After learning both I found out they were quite simple in principle and that there was a way to combine them in such way that you would get really good signals, however it was way too noisy.
While it could avoid major dumps that were not avoided by most indicators, it would lose that edge because of being too noisy.
After testing out many conditions, combinations & more, the best working one was this one:
WMA > KEWMA = long
WMA < KEWMA = short
I will explain this later, but this gave fast signals, and while it still was noisy it was better then before.
To smooth it out, I started testing price filters => Gaussian Filter and many more were tested out, but they either slowed it down to the point it was no longer of much use, or did not smooth it at all.
After testing the Kalman filter on this thing, I was shocked.
It was just right and made the indicator a lot better, smoothed it and kept most of the responsivness it had.
Now to the big question: "How is it calculated?"
Now first it needs to calculate the Kalman source, which smooths the source which will be used.
After that, we calculate the Weighted Moving Average for " n " period on the Kalman source.
Now that we have our WMA values, we need to calculate " a ".
a is calculated in the following formula:
a = 2/(1+ n )
where n is the user defined length
Now for the last part:
KEWMA = WMAyesterday * (1-a) + WMAtoday * a
This creates a very accurate and reactive indicator, that can prove useful in many uses, beyond those I will and did talk about.
For the trend logic as mentioned before:
Long = WMA > KEWMA
Short = WMA < KEWMA
This worked best, but you might find better ways of using it.
I think that is all I have to say about it, I left it open source so you can all code it in your strategies and play around with it.
Enjoy Gs!

HorizonSigma Pro [CHE]HorizonSigma Pro
Disclaimer
Not every timeframe will yield good results . Very short charts are dominated by microstructure noise, spreads, and slippage; signals can flip and the tradable edge shrinks after costs. Very high timeframes adapt more slowly, provide fewer samples, and can lag regime shifts. When you change timeframe, you also change the ratios between horizon, lookbacks, and correlation windows—what works on M5 won’t automatically hold on H1 or D1. Liquidity, session effects (overnight gaps, news bursts), and volatility do not scale linearly with time. Always validate per symbol and timeframe, then retune horizon, z-length, correlation window, and either the neutral band or the z-threshold. On fast charts, “components” mode adapts quicker; on slower charts, “super” reduces noise. Keep prior-shift and calibration enabled, monitor Hit Rate with its confidence interval and the Brier score, and execute only on confirmed (closed-bar) values.
For example, what do “UP 61%” and “DOWN 21%” mean?
“UP 61%” is the model’s estimated probability that the close will be higher after your selected horizon—directional probability, not a price target or profit guarantee. “DOWN 21%” still reports the probability of up; here it’s 21%, which implies 79% for down (a short bias). The label switches to “DOWN” because the probability falls below your short threshold. With a neutral-band policy, for example ±7%, signals are: Long above 57%, Short below 43%, Neutral in between. In z-score mode, fixed z-cutoffs drive the call instead of percentages. The arrow length on the chart is an ATR-scaled projection to visualize reach; treat it as guidance, not a promise.
Part 1 — Scientific description
Objective.
The indicator estimates the probability that price will be higher after a user-defined horizon (a chosen number of bars) and emits long, short, or neutral decisions under explicit thresholds. It combines multi‑feature, z‑normalized inputs, adaptive correlation‑based weighting, a prior‑shifted sigmoid mapping, optional rolling probability calibration, and repaint‑safe confirmation. It also visualizes an ATR‑scaled forward projection and prints a compact statistics panel.
Data and labeling.
For each bar, the target label is whether price increased over the past chosen horizon. Learning is deliberately backward‑looking to avoid look‑ahead: features are associated with outcomes that are only known after that horizon has elapsed.
Feature engineering.
The feature set includes momentum, RSI, stochastic %K, MACD histogram slope, a normalized EMA(20/50) trend spread, ATR as a share of price, Bollinger Band width, and volume normalized by its moving average. All features are standardized over rolling windows. A compressed “super‑feature” is available that aggregates core trend and momentum components while penalizing excessive width (volatility). Users can switch between a “components” mode (weighted sum of individual features) and a “super” mode (single compressed driver).
Weighting and learning.
Weights are the rolling correlations between features (evaluated one horizon ago) and realized directional outcomes, smoothed by an EMA and optionally clamped to a bounded range to stabilize outliers. This produces an adaptive, regime‑aware weighting without explicit machine‑learning libraries.
Scoring and probability mapping.
The raw score is either the weighted component sum or the weighted super‑feature. The score is standardized again and passed through a sigmoid whose steepness is user‑controlled. A “prior shift” moves the sigmoid’s midpoint to the current base rate of up moves, estimated over the evaluation window, so that probabilities remain well‑calibrated when markets drift bullish or bearish. Probabilities and standardized scores are EMA‑smoothed for stability.
Decision policy.
Two modes are supported:
- Neutral band: go long if the probability is above one half plus a user‑set band; go short if it is below one half minus that band; otherwise stay neutral.
- Z‑score thresholds: use symmetric positive/negative cutoffs on the standardized score to trigger long/short.
Repaint protection.
All values used for decisions can be locked to confirmed (closed) bars. Intrabar updates are available as a preview, but confirmed values drive evaluation and stats.
Calibration.
An optional rolling linear calibration maps past confirmed probabilities to realized outcomes over the evaluation window. The mapping is clipped to the unit interval and can be injected back into the decision logic if desired. This improves reliability (probabilities that “mean what they say”) without necessarily improving raw separability.
Evaluation metrics.
The table reports: hit rate on signaled bars; a Wilson confidence interval for that hit rate at a chosen confidence level; Brier score as a measure of probability accuracy; counts of long/short trades; average realized return by side; profit factor; net return; and exposure (signal density). All are computed on rolling windows consistent with the learning scheme.
Visualization.
On the chart, an arrowed projection shows the predicted direction from the current bar to the chosen horizon, with magnitude scaled by ATR (optionally scaled by the square‑root of the horizon). Labels display either the decision probability or the standardized score. Neutral states can display a configurable icon for immediate recognition.
Computational properties.
The design relies on rolling means, standard deviations, correlations, and EMAs. Per‑bar cost is constant with respect to history length, and memory is constant per tracked series. Graphical objects are updated in place to obey platform limits.
Assumptions and limitations.
The method is correlation‑based and will adapt after regime changes, not before them. Calibration improves probability reliability but not necessarily ranking power. Intrabar previews are non‑binding and should not be evaluated as historical performance.
Part 2 — Trader‑facing description
What it does.
This tool tells you how likely price is to be higher after your chosen number of bars and converts that into Long / Short / Neutral calls. It learns, in real time, which components—momentum, trend, volatility, breadth, and volume—matter now, adjusts their weights, and shows you a probability line plus a forward arrow scaled by volatility.
How to set it up.
1) Choose your horizon. Intraday scalps: 5–10 bars. Swings: 10–30 bars. The default of 14 bars is a balanced starting point.
2) Pick a feature mode.
- components: granular and fast to adapt when leadership rotates between signals.
- super: cleaner single driver; less noise, slightly slower to react.
3) Decide how signals are triggered.
- Neutral band (probability based): intuitive and easy to tune. Widen the band for fewer, higher‑quality trades; tighten to catch more moves.
- Z‑score thresholds: consistent numeric cutoffs that ignore base‑rate drift.
4) Keep reliability helpers on. Leave prior shift and calibration enabled to stabilize probabilities across bullish/bearish regimes.
5) Smoothing. A short EMA on the probability or score reduces whipsaws while preserving turns.
6) Overlay. The arrow shows the call and a volatility‑scaled reach for the next horizon. Treat it as guidance, not a promise.
Reading the stats table.
- Hit Rate with a confidence interval: your recent accuracy with an uncertainty range; trust the range, not only the point.
- Brier Score: lower is better; it checks whether a stated “70%” really behaves like 70% over time.
- Profit Factor, Net Return, Exposure: quick triage of tradability and signal density.
- Average Return by Side: sanity‑check that the long and short calls each pull their weight.
Typical adjustments.
- Too many trades? Increase the neutral band or raise the z‑threshold.
- Missing the move? Tighten the band, or switch to components mode to react faster.
- Choppy timeframe? Lengthen the z‑score and correlation windows; keep calibration on.
- Volatility regime change? Revisit the ATR multiplier and enable square‑root scaling of horizon.
Execution and risk.
- Size positions by volatility (ATR‑based sizing works well).
- Enter on confirmed values; use intrabar previews only as early signals.
- Combine with your market structure (levels, liquidity zones). This model is statistical, not clairvoyant.
What it is not.
Not a black‑box machine‑learning model. It is transparent, correlation‑weighted technical analysis with strong attention to probability reliability and repaint safety.
Suggested defaults (robust starting point).
- Horizon 14; components mode; weight EMA 10; correlation window 500; z‑length 200.
- Neutral band around seven percentage points, or z‑threshold around one‑third of a standard deviation.
- Prior shift ON, Calibration ON, Use calibrated for decisions OFF to start.
- ATR multiplier 1.0; square‑root horizon scaling ON; EMA smoothing 3.
- Confidence setting equivalent to about 95%.
Disclaimer
No indicator guarantees profits. HorizonSigma Pro is a decision aid; always combine with solid risk management and your own judgment. Backtest, forward test, and size responsibly.
The content provided, including all code and materials, is strictly for educational and informational purposes only. It is not intended as, and should not be interpreted as, financial advice, a recommendation to buy or sell any financial instrument, or an offer of any financial product or service. All strategies, tools, and examples discussed are provided for illustrative purposes to demonstrate coding techniques and the functionality of Pine Script within a trading context.
Any results from strategies or tools provided are hypothetical, and past performance is not indicative of future results. Trading and investing involve high risk, including the potential loss of principal, and may not be suitable for all individuals. Before making any trading decisions, please consult with a qualified financial professional to understand the risks involved.
By using this script, you acknowledge and agree that any trading decisions are made solely at your discretion and risk.
Enhance your trading precision and confidence 🚀
Best regards
Chervolino

Bull Momentum GaugeBull Momentum Gauge
The Bull Momentum Gauge is a powerful momentum oscillator designed to identify the underlying strength and sustainability of major market trends. Instead of trying to predict tops and bottoms, this indicator helps traders and investors ride long-term bull markets by signaling when momentum is building and when it is starting to fade.
What it Does
At its core, this tool measures how statistically "stretched" or "compressed" an asset's price is relative to its long-term (1-year) trend. It does this by:
Calculating the price's deviation from its 365-day moving average.
Normalizing this deviation into a Z-score to measure its statistical significance.
Comparing the inverted Z-score to its own 200-day moving average to gauge the momentum of the trend itself.
The result is a single, smooth line that oscillates around a zero value.
How to Use It
The signals are simple and based on the indicator's relationship to the zero line:
Green Line (Gauge below 0): This indicates that the price has been compressed relative to its long-term trend and is now showing signs of building upward momentum. A cross into the green zone can be interpreted as a potential entry signal for a new bull run.
Red Line (Gauge above 0): This suggests that the price has become over-extended or "stretched" and the upward momentum is beginning to weaken. A cross into the red zone can be used as a potential exit signal, indicating it may be time to take profits and wait for the next cycle.
This indicator is designed to work across multiple timeframes (Daily, Weekly, Monthly) and provides a clear, data-driven framework for navigating major market cycles.

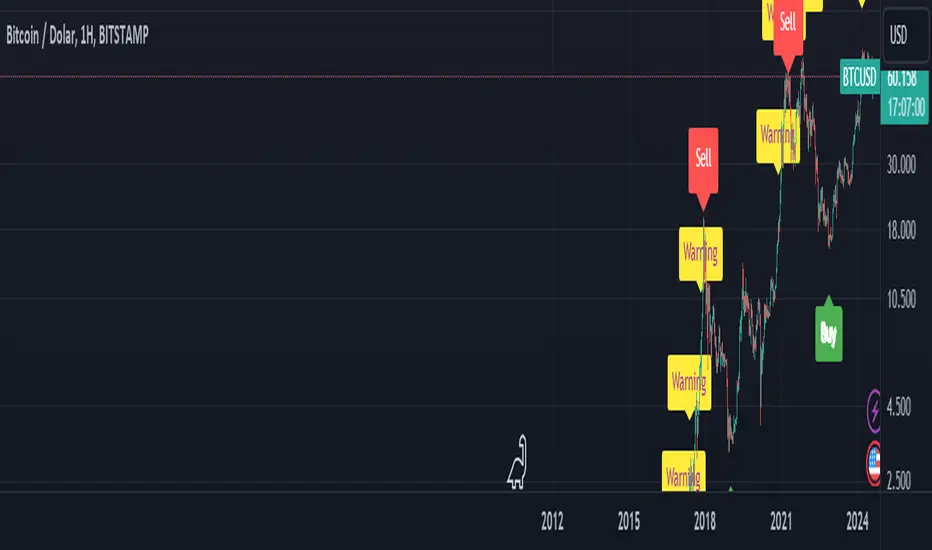
BTC Arcturus IndicatorBTC Arcturus Indicator: This indicator is designed to create buy and sell signals based on the market value of Bitcoin. It also predicts potential market tops with the Pi Cycle Top indicator.
How Does It Work?
1. MVRVZ (Market Value to Realized Value-Z Score) Calculation:
MC: Bitcoin's market cap (Market Cap) is pulled daily from Glassnode data.
MCR: Realized Market Cap of Bitcoin is taken daily from Coinmetrics data.
MVRVZ: It is calculated by dividing the difference between Bitcoin's market value and realized market value by one standard deviation. This value indicates whether the market is overvalued or undervalued.
2. Reception and Warning Signals:
Buy Signal: When MVRVZ falls below the -0.255 threshold value, the indicator gives a "Buy" signal. This indicates that Bitcoin is undervalued and may be a buying opportunity.
Warning Signal: A warning signal turns on when MVRVZ exceeds the threshold value of 2.765. This indicates that the market is approaching saturation and caution is warranted.
3. Tracking the Highest MVRVZ Value:
The indicator records the highest MVRVZ value in the last 10 candlesticks. This value is used to determine whether the market has reached its highest risk levels.
4. Warning Display:
If the MVRVZ value matches the highest value in the last 10 bars and this warning has not been displayed before, a "Warning" signal is displayed.
Once the warning signal is shown, no further warnings are shown for 10 candles.
5. Pi Cycle Top Indicator:
Pi Cycle Top: This indicator predicts Bitcoin tops by comparing two moving averages (350-day and 111-day). If the short-term moving average falls below the long-term moving average, this is considered a sell signal.
The indicator displays this signal with the label "Sell", indicating a potential market top.
User Guide:
Green Buy Signal: It means Bitcoin is cheap and offers a buying opportunity.
Yellow Warning Signal: Indicates that Bitcoin has reached possible profit taking points and caution should be exercised.
Red Sell Signal: Indicates that Bitcoin has reached market saturation and it may be appropriate to sell.
Simple EMA trend indicatorSimple EMA trend indicator , pretty straightforward green equates to bullish and usually a retest/wick is often seen , same for the flipside viceversa
