Bitcoin Bubble Risk (Adjusted for Diminishing Returns)Description:
This indicator offers a unique lens through which traders can assess risk in the Bitcoin market, specifically tailored to recognize the phenomenon of diminishing returns. By calculating the natural logarithm of the price relative to a 20-month Simple Moving Average (SMA) and applying a dynamic normalization process, this tool highlights periods of varying risk based on historical price movements and adjusted returns. The indicator is designed to provide nuanced insights into potential risk levels, aiding traders in their decision-making processes.
Usage:
To effectively use this indicator, apply it to your chart while ensuring that Bitcoin's price is set to display in monthly candles. This setting is vital for the indicator to accurately reflect the market's risk levels, as it relies on long-term data aggregation to inform its analysis.
This tool is especially beneficial for traders focused on medium to long-term investment horizons in Bitcoin, offering insights into when the market may be entering higher or lower risk phases. By incorporating this indicator into your analysis, you can gain a deeper understanding of potential risk exposures based on the adjusted price trends and market conditions.
Originality and Utility:
This script stands out for its innovative approach to risk analysis in the cryptocurrency space. By adjusting for the diminishing returns seen in mature markets, it provides a refined perspective on risk levels, enhancing traditional methodologies. This script is a significant contribution to the TradingView community, offering a unique tool for traders aiming to navigate the complexities of the Bitcoin market with informed risk management strategies.
Important Note:
This indicator is for informational purposes only and should not be considered investment advice. Users are encouraged to conduct their own research and consult with financial professionals before making investment decisions. The accuracy of the indicator's predictions can only be ensured when applied to monthly candlestick charts of Bitcoin.
Bubble
HPK Crash IndicatorFrom Hari P. Krishnan's book, The Second Leg Down: Strategies for Profiting after a Market Sell-Off :
"We start by specifying the year on year (YoY) change in the index. Next, we calculate the 5 year trailing Z score of the YoY returns. We also calculate the 5 year trailing Z score of 1 month historical volatility for the index, using daily returns. Our crisis warning indicator flashes if both Z scores are above 2. In other words, recent price increases and current volatility need to be at least 2 standard deviations above normal.
It can be seen that this basic implementation is reasonably effective, accepting that the effective sample set is small. A false signal is given in mid-2006, but the signal is quickly washed away. The remaining signals occur fairly close to the point of collapse. The idea that elevated volatility is predictive of danger is not new and underpins many asset allocation schemes. However, Sornette deserves credit for moving away from a largely valuation-based approach to predicting crises to one that relies upon price action itself."

Bubbles BB futuresQuick and simple BB bubble indicator for Futures
Draw an arrow if candle corpse is out of Bollinger Band (Upper / Lower)
It's not a signal.
I use it to off-load my charts

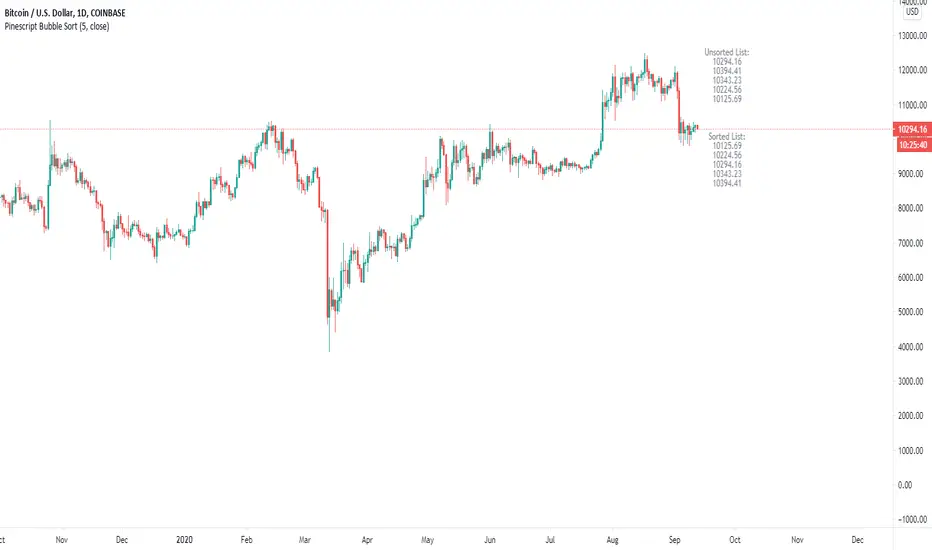
Pinescript Bubble Sort using ArraysThe new feature of arrays allows for a multitude of new possibilities within Pinescript. This script implements a bubble sort function with most probable efficiency of О(n^2) with a best-case being O(n). This sort does not require large amounts of memory to process and has advantages when sorting small lists of data.
The main advantages: Bubble sort is an in-place sorting algorithm. It does not require extra memory or even stack space like in the case of merge sort or quicksort.
The main disadvantages: In the worst case the time complexity is equal to O(n^2) which is not efficient in comparison to other sorts which can have a time complexity of O(n*logn).
The Pseudocode for a bubble sort is as follows:
begin BubbleSort(list)
for all elements of list
if list > list
swap(list , list )
end if
end for
return list
end BubbleSort
The results of the sort are plotted against the unsorted list and overlayed on the chart.
A big thanks to Alex Grover for the help.
No BubbleSimply removes a period of time from the chart and replaces it with no value. This can help with scaling or bias.
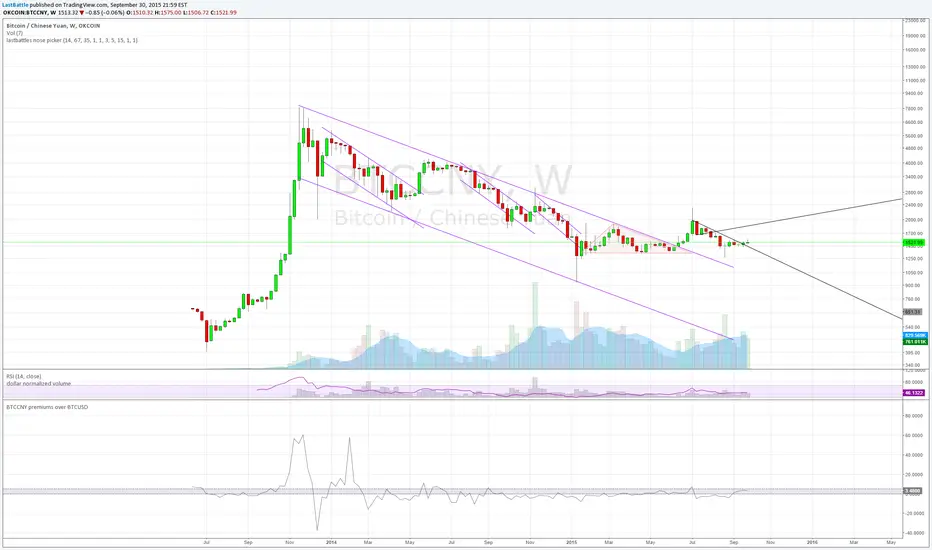
BTCCNY premiums over BTCUSD - yuan devaluationBitcoin as an alternative to capital outflows, with a market cap of just 2 billion can easily be up by multiples from the outflow of yuan from mainland China alone.
People simply do not want yuan if their purchasing power is going down over time.
Current methods of taking capital off mainland China via overseas cash withdrawals are quickly being closed out by the communist government.
------------------------------------------------------------
www.zerohedge.com
China has capped the amount of money Chinese holders of bank and credit cards can withdraw outside the country, in its latest effort to discourage people from moving badly needed capital offshore.
China’s foreign-exchange regulator put a new annual cap on overseas cash withdrawals using China UnionPay Co. bank cards, a UnionPay official said on Tuesday. Under the new rules, UnionPay cardholders can withdraw up to 50,000 yuan ($7,854) overseas during the last three months of this year, and the amount will be capped at 100,000 yuan for all of next year, the official said.
State-run UnionPay has a virtual monopoly on processing card transactions in China, meaning the limits extend to nearly all Chinese bank- and credit-card holders. It wasn’t clear when the new cap was issued.
The new cap is in addition to an existing 10,000 yuan daily withdrawal limit, part of China’s curbs on how much money can flow across its borders.
The move by China’s State Administration of Foreign Exchange is the latest by Beijing to scrutinize capital outflows.
The People’s Bank of China, the country’s central bank, said earlier this month that its foreign-exchange reserves fell by $93.9 billion, the biggest monthly drop ever, after it surprised the market on Aug. 11 with its decision to devalue the yuan by around 2%.
Key takeaway from the yuan devaluation and capital control:
The collapse of 2 bubbles: housing and stock market.
Weakness in commodities such as steel, copper and oil are seen which signals a weakening economy of which China are the core driver of that expansion since 2008. I suspect that China's GDP is never 8% as it is reported, but rather near 2~4% right now.
China have spent over 100 billion USD in US treasury proceeds to stabilize the yuan collapsing faster due to speculators. The amount of reserves spent at the current rate is unsustainable, it will take just 2 years for them to be used up completely.
Over time yuan will still be heading downwards.
[STRATEGY] Follow the Janet YellenIn the era of central bank's helicopter money, the market will always be skyrocketing up and up given enough time.
What's the strategy to profit from indices?
Only short the market when its in a state of euphoria /irrational exuberance bubble, or sell when it is confirmed (20% drawdown). Otherwise, you really have no reason not to long at every chance.
Conclusion:
Follow the printing press like a sheep.
