Bookmap Style Aggressor Bubbles
This indicator is designed to emulate the visual aesthetic of professional Order Flow software (such as Bookmap) directly within TradingView. It replaces the traditional candlestick view with a clean "Microstructure" Step Line and highlights significant volume events using dynamic "Aggressor Bubbles."
This tool is perfect for traders who practice Order Flow analysis, Scalping, or VSA (Volume Spread Analysis) and want to visualize the relative intensity of buyers and sellers without the noise of traditional wicks and bodies.
1. How it Works
Since TradingView Pine Script operates on OHLCV (Level 1) data, this indicator uses a heuristic model to approximate Order Flow dynamics:
Aggressor Bubbles (Volume Spikes):
The script calculates a Relative Volume (RVOL) metric by comparing the current bar's volume against a 50-period Simple Moving Average (SMA).
If the current volume exceeds a user-defined threshold (e.g., 2.0x the average), a bubble is plotted.
Size: The bubble size scales dynamically based on how massive the volume spike is (Small, Normal, Large, Huge).
Direction (Color): The aggressor side is approximated using the price action of the bar. If Close >= Open, it is treated as Buy Aggression (Green). If Close < Open, it is treated as Sell Aggression (Red).
Microstructure Price Line:
Standard candles can obscure the immediate path of price. This indicator includes a Step Line option that plots the closing price. This mimics the "Last Price" feed seen in DOM-based software, allowing you to see exactly where price held or broke.
2. Features
Smart Filtering: Filters out low-volume noise. You only see bubbles when "Whales" or significant liquidity changes occur.
Visual Customization: Fully adjustable colors for Buy/Sell bubbles and the price line.
Alert System: Includes a built-in alert that triggers whenever a significant Aggressor Bubble appears, allowing you to be notified of high-activity moments instantly.
Clean Aesthetic: Optimized for Dark Mode/Black backgrounds.
3. How to Use
Chart Setup (Important): For the best experience, hide your standard candles. Go to Chart Settings > Symbol and uncheck Body, Borders, and Wick.
Settings: Set your background to Black.
Interpretation:
Breakouts: Look for large bubbles pushing price through a key level. This indicates strong momentum.
Absorptions: Look for large bubbles appearing at the top/bottom of a range without price follow-through. This often suggests a reversal (Passive limit orders absorbing the aggressive market orders).
4. Technical Disclosure & Limitations
Please note that TradingView Pine Script provides access to OHLCV (History) data, not historical Tick-by-Tick or Level 2 (Depth of Market) data. Therefore, this indicator is a simulation. The "Aggressor" side is derived from bar direction, and the bubbles represent executed volume per bar, not individual tick clusters. It is intended for visual analysis and identifying high-volume nodes relative to recent history.
Bubbles

Tick-Based Delta Volume BubblesTICK-BASED DELTA VOLUME BUBBLES
OVERVIEW
A real-time order flow indicator that displays volume delta at the tick level, helping traders identify buying and selling pressure as it develops during live market hours. Unlike traditional volume delta indicators that rely on bar close data, this indicator captures actual tick-by-tick volume changes and directional bias, providing granular insight into market dynamics.
HOW IT WORKS
The indicator monitors live tick data during real-time trading by tracking volume increases between consecutive price updates. Each time volume increments, the script calculates the volume delta, determines price direction, assigns directional bias to the volume, and accumulates net delta for each bar.
This methodology is identical to the tick detection mechanism used in professional cumulative volume delta tools, ensuring accuracy and reliability.
FEATURES
Real-Time Tick Detection
- Captures genuine tick-by-tick volume flow using varip persistence
- Not estimated from OHLC data
- Processes actual market ticks as they occur
Adaptive Bubble Sizing
- Bubbles scale based on delta strength relative to a customizable moving average (default 20 bars)
- Highlights significant order flow imbalances
- Five size levels from tiny to huge
Dual Display Modes
- Normal Mode: Sized bubbles with optional volume labels positioned at bar midpoint
- Minimal Mode: Clean dots above/below bars for unobtrusive delta visualization
Flow Classification
- Aggressive Buy (bright green): Strong positive delta with greater than 1.2x strength
- Aggressive Sell (bright red): Strong negative delta with greater than 1.2x strength
- Passive Buy (light green): Moderate positive delta
- Passive Sell (light red): Moderate negative delta
Intensity Mode (Optional)
- Gray: Low intensity (less than 0.5x average)
- Blue: Medium intensity (0.5-1.0x average)
- Orange: High intensity (1.0-2.0x average)
- Red: Extreme intensity (greater than 2.0x average)
Smart Filtering
- Percentile-based filters (customizable) ensure only significant delta events are displayed
- Reduces chart clutter while highlighting important order flow
- Separate thresholds for bubble display and numeric labels
Data Collection Status
- Optional progress box in top-right corner
- Shows real-time bar collection progress
- Displays percentage completion and bars remaining
- Automatically hides when sufficient data is collected
Hide Until Ready Option
- Suppresses bubble display until the averaging period is complete
- Prevents misleading signals from incomplete data
- Default requires 20 bars before displaying bubbles
SETTINGS
Delta Average Length (1-200, default 20)
- Lookback period for calculating delta strength baseline
- Higher values = longer-term delta comparison
- Lower values = more sensitive to recent changes
Hide Bubbles Until Enough Data
- Prevents display until averaging period completes
- Ensures reliable delta strength calculations
Show Data Collection Status Box
- Displays progress indicator during initialization
- Can be disabled if you understand the warmup period
Minimal Mode
- Switches to simple dot display above/below bars
- Green dots above bars = positive delta
- Red dots below bars = negative delta
- Maintains color intensity or flow type classification
Show Bubbles
- Master toggle for bubble display
Bubble Volume Percentile (0-100, default 60)
- Minimum percentile rank required to display bubble
- Higher values = fewer, more significant bubbles
- Lower values = more bubbles displayed
Show Numbers in Bubbles
- Toggle delta value labels
- Only appears in normal mode
- Disabled automatically in minimal mode
Label Volume Percentile (0-100, default 90)
- Higher threshold for displaying numeric labels
- Typically set higher than bubble percentile
- Reduces label clutter on chart
Intensity Mode
- Switch from flow-type coloring to magnitude-based coloring
- Useful for identifying volume spikes regardless of direction
IMPORTANT NOTES
Real-Time Only: This indicator processes live tick data and does not provide historical analysis. It begins collecting data when added to a live chart.
Volume Required: Symbol must have volume data available. Will not function on symbols without volume (most forex pairs from retail brokers).
Initialization Period: Requires the specified number of bars (default 20) to calculate accurate delta strength. Use the "Hide Until Ready" option to prevent premature signals.
Market Hours: Only collects data during live market hours. Does not backfill historical data.
CREDITS
Tick detection methodology inspired by the Kioseff Trading Tick CVD indicator. This implementation adapts the same core tick-level volume delta calculation for bubble-style visualization and per-bar delta analysis.

Delta Bubbles by exp3rtsDelta Bubbles is a powerful volume-based order flow tool that detects aggressive market activity, highlights trapped traders, and visualizes key liquidity zones on your chart — perfect for scalpers, intraday traders, and anyone trading momentum or reversals.
🧠 What It Does:
📈 Buy/Sell Bubbles: Detects aggressive buying/selling pressure using a volume delta approximation.
🟩 Trap Zones: Highlights areas where traders likely got trapped (buying in downtrends or selling in uptrends).
⚠️ Potential Traps: Shows lighter “setup” zones for trades that may become traps.
🟥🟩 Colored Bars: Optional trend coloring for visual clarity (based on 50 EMA).
📉 Zone Liquidation: Automatically removes zones once price revisits them.
🧩 Customizable Settings:
Bubble sensitivity and size thresholds.
Trap zone width and minimum bubble size.
Toggle trap liquidation, potential zones, colored bars, and bubble visibility.
📌 How to Use It:
Look for trap zones forming against the trend (e.g., bearish bubble in an uptrend → green trap zone).
Watch for retests of zones — these can be key levels for fades or breakouts.
Combine with price action, support/resistance, VWAP, or other confluence tools.
🚀 Best For:
Scalping and reversal trading on intraday timeframes (5m, 15m).
Futures, indices (e.g., NASDAQ, S&P 500), crypto, or any liquid market.

Bubbles Volume [BigBeluga]The Bubbles Volume indicator is an innovative visualization tool designed to represent trading volume in a more intuitive and visually appealing manner. By displaying volume as bubbles of varying sizes and colors on the price chart, this indicator helps traders quickly identify significant volume levels and potential areas of interest.
Important Note:
For correct visual representation of indicator, layout it to front:
🔵 KEY FEATURES
● Volume Bubbles
Represents trading volume as bubbles on the price chart
Bubble size increases with higher volume levels
Color intensity changes based on volume significance
Provides an intuitive visual representation of volume distribution
● Heatmap Coloring
Optional feature to color bubbles based on volume intensity
Uses a color gradient from cool (low volume) to hot (high volume) colors
Helps quickly identify extremely high volume areas
● Significant Volume Levels
Option to display horizontal lines at significant volume levels
Shows volume amount as labels for highly significant levels
Helps identify potential support/resistance areas based on volume
Volume Levels:
Levels with HeatMap:
Levels without Volume Bubles:
● Normalized Volume Calculation
Uses normalized volume to account for overall market volume trends
Provides a more accurate representation of volume significance
🔵 HOW TO USE
● Volume Analysis
Larger bubbles indicate higher trading volume
Clusters of large bubbles may suggest areas of high interest or potential reversals
Use in conjunction with price action to identify potential breakouts or fakeouts
● Trend Confirmation
Strong trends often show increasing bubble sizes in the trend direction
Diminishing bubble sizes might indicate weakening trends
● Support and Resistance
Significant volume levels (displayed as lines) can act as potential support/resistance
Pay attention to price reactions at these levels for trading opportunities
● Divergences
Look for divergences between price action and bubble sizes
Price making new highs/lows with smaller bubbles might indicate weakening momentum
● Volatility Assessment
Periods with consistently large bubbles indicate high volatility
Can be used to adjust trading strategies or position sizing
🔵 CUSTOMIZATION
The Bubbles Volume indicator offers several customization options:
Toggle bubble display on/off
Adjust volume threshold for filtering low volume bubbles
Enable/disable heatmap coloring for enhanced visual analysis
Show/hide significant volume levels
Adjust the number of significant levels displayed
Customize colors to suit personal preferences
By fine-tuning these settings, traders can adapt the indicator to various market conditions and personal analysis preferences.
The Bubbles Volume indicator provides a unique and intuitive way to visualize trading volume directly on the price chart. This approach allows traders to quickly identify areas of significant trading activity and potential price levels of interest without the need for a separate volume sub-chart.
This tool can be particularly useful for traders focusing on volume analysis, breakout strategies, or those looking to confirm price action with volume. The visual nature of the bubbles makes it easy to spot volume patterns and anomalies at a glance, potentially leading to faster and more informed trading decisions.
As with all technical indicators, it's recommended to use the Bubbles Volume indicator in conjunction with other forms of analysis and within the context of a well-defined trading strategy. While this indicator provides valuable volume insights, it should be considered alongside other factors such as overall market trends, price patterns, and fundamental analysis when making trading decisions.

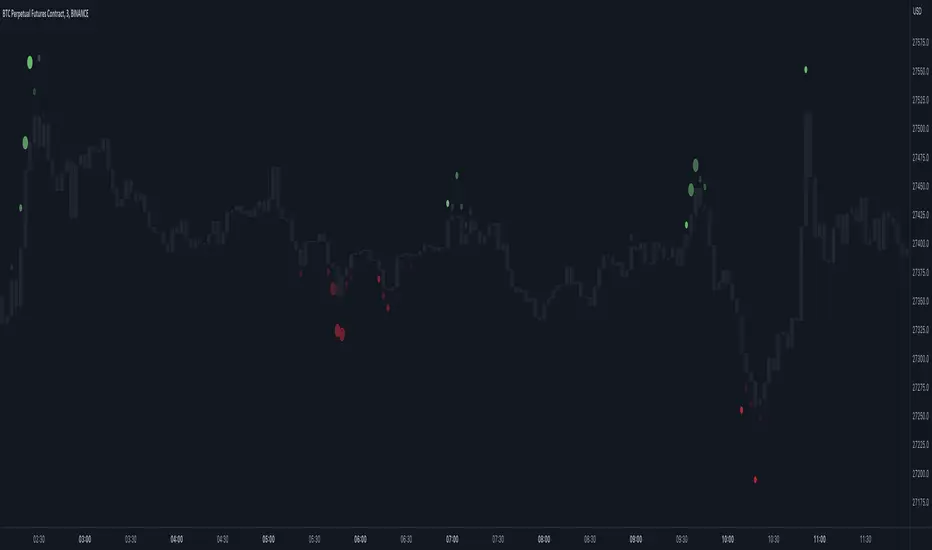
Market Order Bubbles + Trapped Positions [Pt]"Market Order Bubbles + Trapped Positions" is a multifaceted TradingView indicator, employing volume data to depict intensified market activities. By highlighting aggressive buying/selling behaviors, this tool serves as a dependable aid in pinpointing potential trading reversals. Additionally, it proves an effective device for real-time market trend monitoring. The unique ability of this indicator to spotlight 'Trapped Positions'—resulting from such vigorous trading activity—helps identify crucial price levels or ranges that may lead to significant price responses.
Market Order Bubbles
The Market Order Bubbles feature capitalizes on volume data to estimate market orders. High bullish volume is indicative of a surge in buy orders, while strong bearish volume flags an increase in sell orders. These orders are visually represented by bubbles of different sizes, corresponding directly to the volume strength, thus providing traders with an immediate, intuitive understanding of market activity.
Trapped Positions/Zones
The concept of Trapped Positions emerges when sizable buy orders appear during a bearish market trend, or vice versa. For instance, if a considerable sell order is detected during a bullish uptrend, it signifies that those short positions may be 'trapped'. These positions help in plotting potential price range zones. When the price revisits these zones and the market trend maintains its bullish inclination, trapped shorts might opt for liquidation near break-even to mitigate losses. The reverse holds true in a bearish downtrend.
Trend Follower
The Trend Follower feature is a supportive tool that aims to discern price trends, color-coding candle bars for clarity. This function assists traders by presenting a simplified view of the prevailing trend, helping to minimize distractions caused by minor price shifts.
The utility of the Trend Follower is its ability to aid traders in focusing on the larger market direction. It allows traders to concentrate on the more substantial trend and make decisions that align with this broader market movement, rather than reacting to every minor price fluctuation. As a result, this feature may support traders in maintaining their positions for a longer duration, which could potentially enhance their trading outcomes. The Trend Follower, therefore, offers a helpful contribution to a balanced and effective trading approach.
In essence, the "Market Order Bubbles + Trapped Positions" indicator with its Trend Follower feature provides traders with a comprehensive understanding of market dynamics, allowing them to navigate the financial markets with increased precision and confidence. Its unique features, designed to highlight significant market activities and trends, can greatly aid in refining trading strategies, making it a potentially invaluable tool in a trader's arsenal.

Market Order Bubbles - By Leviathan"Market Order Bubbles" is a volume-based indicator that helps visualize the occurrences of increased aggressiveness in market buying/selling and can serve as a useful confluence for trading reversals or as a simple tool for observing real-time market dynamics.
I created Market Order Bubbles six months ago as an additional tool included in my Liquidation Levels script. Due to their popularity, I decided to publish them as a standalone indicator with some new features. The script is based on a calculation that uses volume data (imitation of CVD) and price action to estimate where there is a surge in the quantity and magnitude of market buy and sell orders. These occurrences are visualized with circles (bubbles) that appear above the bar (market buy orders) or below the bar (market sell orders). Most of the time, the approach to interpreting the bubbles is contrarian, meaning that the appearance of Market Buy Order Bubbles can serve as a confluence to look for shorts, and the appearance of Market Sell Order Bubbles can serve as a confluence to look for longs.
The concept behind taking a contrarian approach:
Market Buy Order Bubbles appear above the price and possibly signal the following:
- Short positions being liquidated (exit short = buy order)
- New traders entering late longs based on FOMO (enter long = buy order)
- Smarter traders getting their limit sell orders filled by aggressive buyers/stopped out shorts
⇒ Possible reversal to the downside / short-term pullback / start of ranging price action (PA)
Market Sell Order Bubbles appear below the price and possibly signal the following:
- Long positions being liquidated (exit long = sell order)
- New traders entering late shorts based on FOMO (enter short = sell order)
- Smarter traders getting their limit buy orders filled by aggressive sellers/stopped out longs
⇒ Possible reversal to the upside / short-term pullback / start of the ranging PA
These events are identified and filtered by EMA and STDEV-based "thresholds," which can be modified in the indicator settings.
1. If the buy/sell volume exceeds the first threshold, a Small Bubble is displayed.
2. If the buy/sell volume surpasses the second threshold, a Medium Bubble is displayed.
3. If the buy/sell volume exceeds the third threshold, a Large Bubble is displayed.
Increasing the multipliers effectively increases the threshold for a given bubble to appear, making the conditions for its occurrence more strict.
Decreasing the multipliers effectively decreases the threshold for a given bubble to appear, making the conditions for its occurrence less strict.
Settings Overview
"Bubble Position" - Choose whether the bubbles are displayed above/below the candle, at the candle high/low, or at the intrabar POC of the candle.
"Strength Gradient Color" - This option adjusts the transparency of the bubble's color relative to the volume on that bar.
"Threshold EMA Length" - Choose the length of the EMA used for determining the thresholds.
"Threshold STDEV Length" - Choose the length of the ta.stdev() function used on the EMA.
"Appearance Delay" - This input allows you to delay the appearance of the bubble for x number of bars. The default is 0.
"Show POC" - Show/hide intrabar POCs displayed as "-".
"Timeframe-Adjusted Settings" - Different timeframes might require different parameters. In this section, you can set custom parameters (Lengths and Multipliers) for four different timeframes, and the script will automatically switch to those settings as you browse through different timeframes.
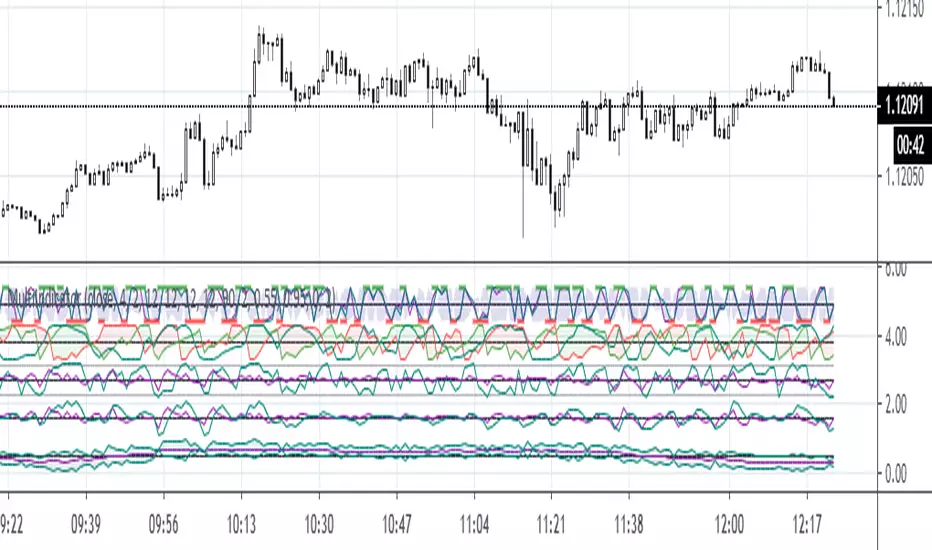
MultiIndicatorThis is just a bunch of useful funtions and
a recommenation how to construct a multiindicator for the sake of economy :))