Bones1390's GANN Strategy AlertsThese are the alerts to go along with my GANN Strategy. You can find the strategy here:
If you like my stuff, leave me a comment below.
If you're feeling kind or want to show some appreciation, you can donate Bitcoin to this Address here:
3Jp9Kow1VxvzAiLLwCdeeQ2g11wKyaT4rC
Also if there's anything you want to talk about PM me! I'm free to speak about anything. Want a custom indicator? I can do my best to code it for you!
Thanks!
Bones
Buy-sell

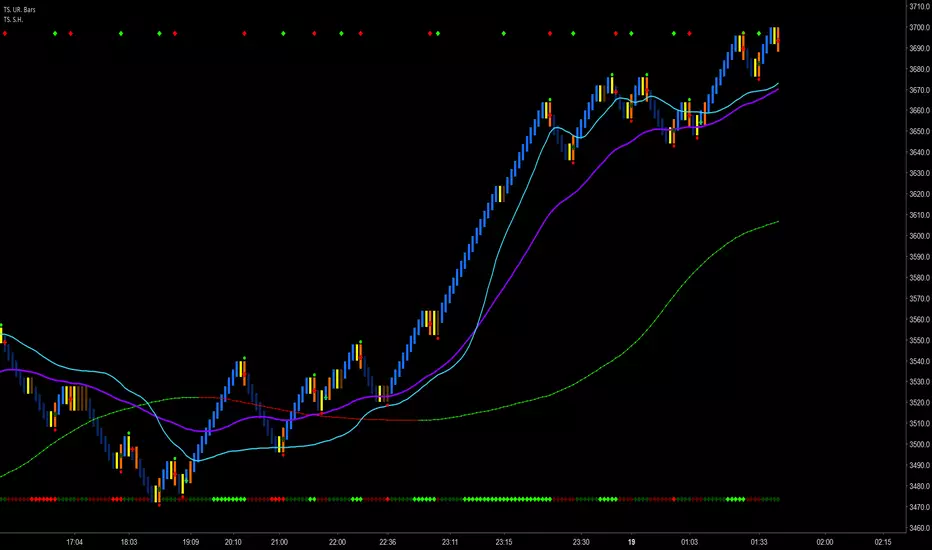
Trader Set - Signal HelperThis is a signalling helper indicator that combines parts of signalling sections of my methodology. Using the provided two parts, it's easy to identify good signals from false ones.
This helper indicator is developed just to make the trader's life easier to identify if there is a possible signal or not, if there is a signal, he/she would need to check other filters and sections of my methodology for approval of a possible trade.
Please don't contact me for access to the script. It'll will only be available for my students. Right now the English part of the website and learning material is under development, as soon as they are ready, I will announce it under each related script for those who are interested for participating in courses.
Trader Set - Buy Sell PowerThis is an original oscillator I Developed for my methodology, the Idea and base thought of formula came from MACD, we all know that momentum, if being set correctly, is a leading indicator and actually, it's one of few real leading indicators, keeping that in mind a heavy R&D was done and the result is a formula that can show the momentum of buyers or sellers in the market, for buying momentum, the formula is totally different than selling momentum, but knowing that the correlation is there, I added both formulas into one oscillator that would be easy to understand and use in my methodology.
Please don't contact me for the access, access is given only to my students, the English version of the website and learning material is under development. As soon as they are ready, I will announce it under every related script in comment section.

VJ_Holy_Grail_ScalperA simple scalping indicator
Green triangle = Buy
Red triangle = Sell
Added buy/sell alerts for Autoview

Israr21 [B/S Colors]Israr21(B/S Colors) with Alarms .
Use different tickers of same currency, to know the accurate one giving right time signals. Also use 15 min Charts. You can also change time frame from settings.
Contact me for more info...

VJ_Holy_Grail_Scalper_Swing_Trader_v1// Added Scalper and Swing Trader in 1 indicator to help those who are using free version on TV
// Added Alerts for Scalp Buy/Sell, Swing Buy/Sell and TP alerts(for both scalper and swing trader) to work with Autoview


BitcoinNinjas 'Ninja Signals' Buy/Sell Alert Trading Script v3.0Bitcoin Ninjas 'Ninja Signals' Buy/Sell Alerts & Backtesting TradingView Script v3.0
(for Cryptocurrencies, Forex, GunBot, ProfitTrailer, automatic trading software, and more)
This is version 3 of our popular Ninja Signals trading script, which is similar to version 2, but with a new hard-coded calibration (resolution) setting that automatically matches candle size (period) to ensure that no repainting occurs regardless of the number or type of indicators and filters traders apply when configuring the script.
'Ninja Signals' v3.0 (SCRIPT)
'Ninja Signals' v3.0 (STRATEGY)
'Ninja Signals' v2.0 (SCRIPT)
'Ninja Signals' v2.0 (STRATEGY)
'Ninja Signals' v1.0 (SCRIPT)
'Ninja Signals' v1.0 (STRATEGY)
-Allows users to easily set automated buy and sell alerts on TradingView for use with automatic and manual trading of cryptocurrencies, Forex securities, and more (alerts are compatible with automatic trading software such as GunBot, ProfitTrailer, and more).
-Synthesizes many powerful indicators [e.g. Relative Strength Index (RSI), stochastic RSI, Money Flow Index (MFI), Moving Average Convergence Divergence (MACD), etc.) into one super script to generate very precise buy and sell signals in almost any market condition.
-Buy arrows (blue) and sell arrows (red) can be changed or hidden for ease of viewing.
-No lag EMA trendline featuring trend-reversal color-coding (white uptrend, black downtrend).
-Adjustable ‘calibration’ setting allows users to customize the script to work for any currency or security available through TradingView, on any exchange, simply by adjusting a number.
-Complete with backtesting strategy version of script which allows users to test various buy and sell strategies based on the alerts the script generates (see info and screenshots below).
-Backtesting strategy incorporates a user-defined adjustable date range, so users can estimate the script’s performance over specific periods of time, such as the last day, week, or month.
-Backtesting strategy utilizes a minimum protective gain setting to help you never sell for a loss. Simply adjust your minimum profit (%) per trade, and the test results will update.
-Backtesting strategy allows for pyramid buying to test various average down / double up buying strategies. Simply adjust the number of pyramid buys and the quantity of each buy.
- Free 7-day trial available for TradingView users who join our free BitcoinNinjas community.
-Free 24/7 support via BitcoinNinjas Telegram GunBot support group with script purchase.
-Fully compatible with GunBot automatic trading software (TradingView plugin is required).
-Special discount available for traders who purchase GunBot automatic trading software and the GunBot TradingView plugin from BitcoinNinjas, allowing for fully automatic trading.
-Contact us via Email or Telegram for more information, to request additional / custom screenshots, or to start your free trial.
DISCLAIMER: By using our BitcoinNinjas ‘Ninja Signals’ planning script, you agree to the BitcoinNinjas 'Terms of Use', as presented on our website (www.BitcoinNinjas.org) and as stated here. No sharing, copying, reselling, modifying, or any other forms of use are authorized for our documents, script / strategy, and the information published with them. This informational planning script / strategy is strictly for individual use and educational purposes only. This is not financial or investment advice. Investments are always made at your own risk and are based on your personal judgement. Bitcoin Ninjas is not responsible for any losses you may incur. Please invest wisely.

Easy ma cross STUDYEasy ma cross STUDY
Best to use with small timeframes (for example 5m chart) and uptrend (refer to 1H or 4H chart).
You can set up Alerts from the Entry and Exit signals.
Play around with the settings of SMA1 and SMA2 for better results for you currency pair / time frame.
Always use stop loss!

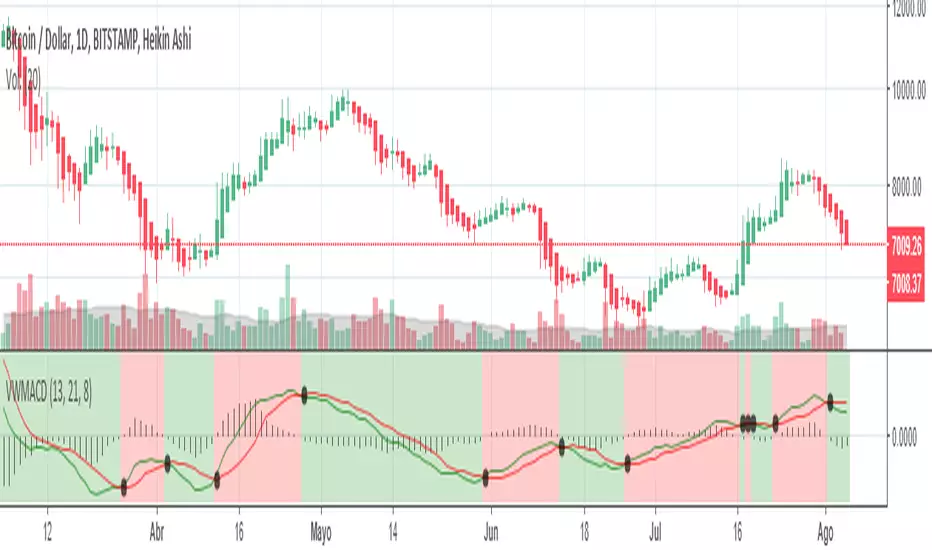
HA.MACD.MA.TradeSetupsHi probably trade setups indicator intended to be used with Heikin Ashi candles. It uses fibo EMAs and MACD to signal longs/shorts. Intended for scalping high cap coin with high volume on lower time frames.

BuySell(Basel major swing ver 1.0)
--------------------------------------------------------------------------------------------------------------------------------------------------------------------------------
We have developed an algorithm that generates the buy and sell signals in 50/50 ratio where it's most reliable and accurate.
The signals are implemented to not overlap with one another. (no repaints)
By entering the initial seed capital, it will allow to measure the profitability in the future and the validity of the buy and sell signals.
Depending on the changing trading volumes, the system divides the chart into sections to decide for us whether it's safe to buy/sell or not.
Yellow = rising tide
Light yellow = ready to rise
Dark gray = falling tide
Light gray = crash
The buy signals occur only in the yellow colored section, which has the most trading volume.
--------------------------------------------------------------------------------------------------------------------------------------------------------------------------------
매수와 매도에서 신뢰도 있는 타점에서 매매신호가 1:1 비율로 발생하도록 알고리즘을 구현했습니다.
매매신호는 리페인팅이 없도록 구현하였습니다.
때문에 초기시드를 입력하면 이후에 시드변화가 어떻게 변하는지 측정하고 매매시그널에 대한 신뢰도를 검증 할 수 있습니다.
거래량에 따라서 차트에 구간을 나눠줘서 매매가 가능한 구간을 나눠줬습니다.
진노랑 = 상승구간
연노랑 = 상승준비
진회색 = 눌림구간
연회색 = 하락구간
매수신호는 거래량이 많이 들어 온 구간인 진노랑 구간에서만 발생합니다.
--------------------------------------------------------------------------------------------------------------------------------------------------------------------------------
BuySell대로 매매 했을 시에 시드변화와 존버시의 시드 변화 그래프 (파란색이 바셀, 빨간색이 존버)
BlueLine is Basel trading blance, RedLine is buy and holding blance.
--------------------------------------------------------------------------------------------------------------------------------------------------------------------------------

Bullish/Bearish Candelstick patternHey!
This time I took the pattern recognizer from a previous script I worked.
It overlays the Arrows on the chart.
Legend:
#Maroon colour: Strong bearish signal
#Red colour: Bearish signal
#Dark Green colour: Strong bullish signal
#Lime: Bullish signal
NOTE: Also, you can untick the patterns you don't find useful, but I kept every pattern to get a complete script.
I unticked:
Morning Star
Evening Star
Shooting Star
Bullish Harami (too bearish on corrective phase)
Hanging Man
Red Cloud Cover
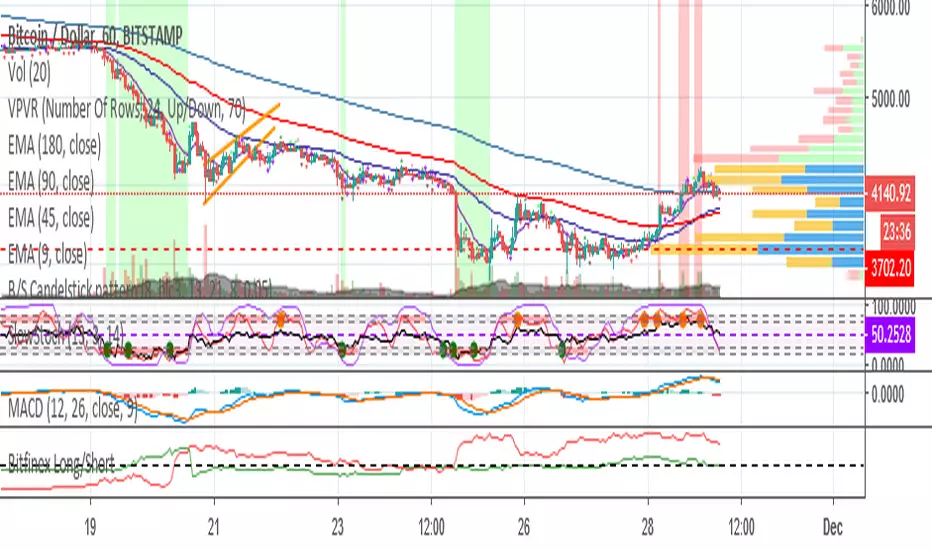
Volume Weighted MACD + x-SignalingThis is a script I remade from 2 previous TDuser's scripts.
Thanks community for sharing, I hope you find it useful.
φ!
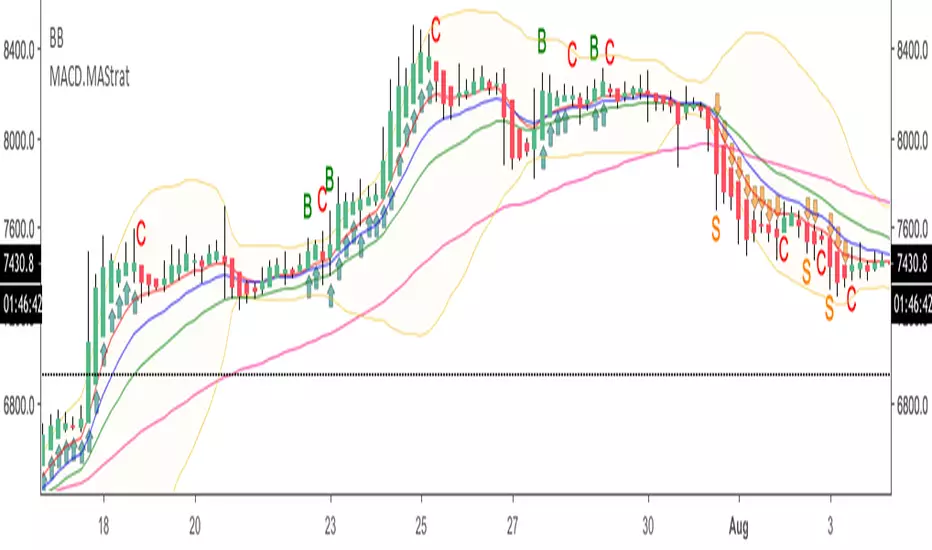
Tersus Bollinger Bands Scalping Indicator V1.1Tersus Scalping Indicator
Tersus Scalping Indicator places buy and sell signals for Bitcoin in key areas using Bollinger Bands, Moving Averages, and Trend Analysis.
This indicator is very easy to use and makes for a great second opinion when trading.
The buy and sell positions are marked with B for buy and S for sell, in addition adds to position are market with red and green triangles.
The Bollinger Bands show general constriction and turn from red to green depending on market conditions. Red meaning bearish market, and green meaning bullish.
There are a number of lines all over the place and at first glance they can seem daunting. This is what they mean. The green and yellow dotted lines mark sell target stages 1 and 2, and buy target stages 1 and 2. The red dotted line is your buy and sell stop. The light blue is your buy and sell entry.
The candles also change color depending on if things are over sold or over bought using the Stochastic RSI. Purple for overbought and yellow/orange for oversold. The bars will also change to light blue during entry.
This should be limited to the 15 minute time frame for now. I have noticed some very good signals on the daily and some other time frames but this was written for 15 so don't expect it to be as accurate.
For purchasing information please direct message me.

CryptogramTR with OPEN CODEIndicator is obtained by importing RSI(14) into HULL moving average source with 2 different periods, as one is long period and the other is short.
When green line (short period) cross upward the red line (long period) , this is a BUY; vice versa it is a SELL.
When HMA Short Period is set to 1 (one), yielding line is absolutely the same line of RSI (14). You can change it into 8(eight) preferably.
İndikatör, RSI(14) indikatörünün, hull hareketli ortalamasının kod kaynağı olarak atanması ile elde edilmiştir. Uzun ve kısa olmak üzere 2 ayrı periyot kullanılmıştır.
Yeşil çizgi yani kısa periyotlu çizgi, kırmızı yani uzun periyotlu olanı yukarı keserse AL, tersi durum SAT olarak düşünülmelidir.
Hull Kısa Periyodu 1 iken oluşan yeşil çizgi, RSI(14) indikatörünü vermektedir. Kısa periyot olarak tercihinize göre bu değeri 8 olarak da kullanabilirsiniz.

MinhTarget Buy-Sell MinhTarget Buy-Sell has 2 option to buy-sell depends color of line or depends bar crosses with line ; so pls select on/off and see result.
Thank you!

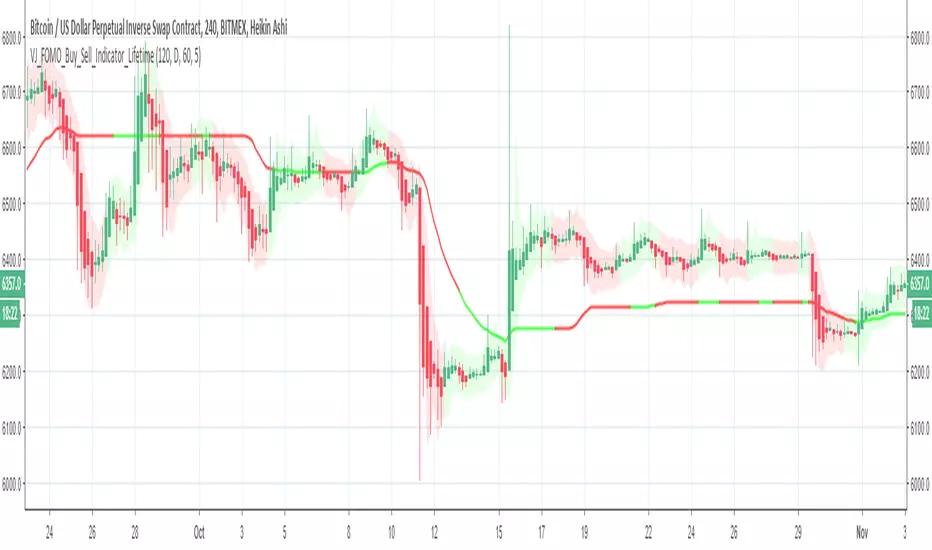
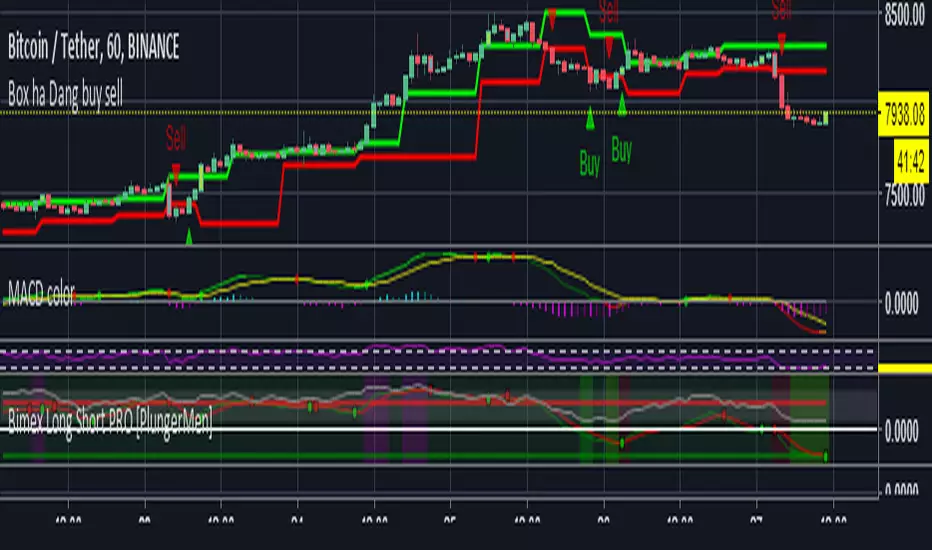
Bimex Long Short PRO [PlungerMen]Hello!
This free community edition is very good for all time frame , for all the crypto
This Script recognized overbought area and over-selling area extremely accurate
This Script is very well used as it works by itself and very well used in conjunction with the "Bitmex scalping " script, both compliment for each other. the "Bitmex Scalping" script is Free, you can find it
If you want to be more accurate and more efficient, more comfortable when you do not want to see too many other indicators, you can register for our Professional edition.
- The Professional Edition supports Level 1 and Level 2 commands, which are very effective in allocating funds and optimizing your profits
Besides that,You will be supported by personal preferences, profit maximization
- Register for a Professional version will be used 2 Script,Bimex Scalping Pro and Bitmex Long Short Pro
- We will invite you to the signal channel with the announcement of the bottom and the peak of the BTC ,the big variable variable has exists
We hope you enjoy this script. Your support will help us develop more good quality scripts in the future to serve the community
**Remember, Like this script and posivite feedback if you are satisfied**
if you have any questions Plz post a comment ... below here
******
Thanks

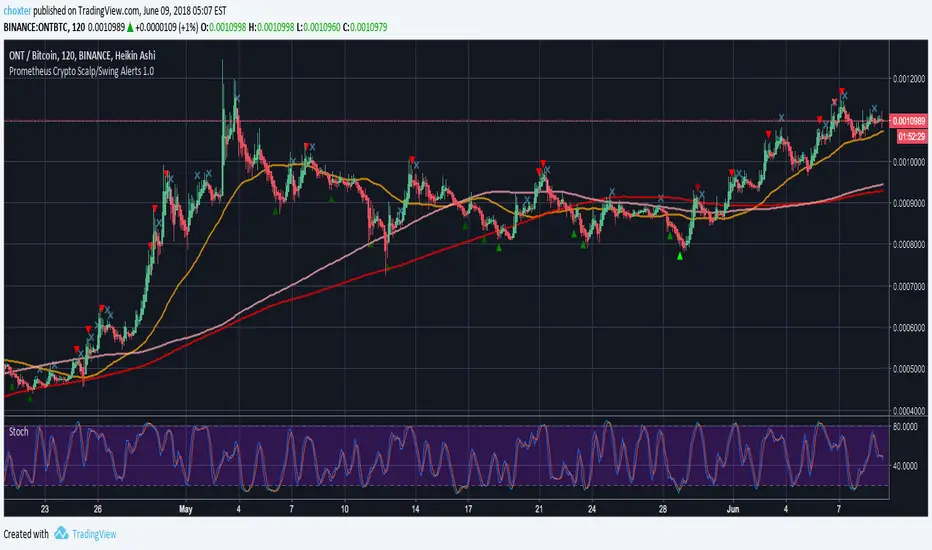
Prometheus Crypto Scalp/Swing Alerts 1.0Prometheus Crypto Scalp/Swing Alerts was built for scalp/swing crypto traders but you probably got that figured out by yourself. It offers high quality entries and exits which can be manually adjusted to suit your trading style. It performs great on any timeframe but scalp traders will love it for it’s ability to offer many entry points followed by quick exits, giving you opportunity to earn a few % within a few hours.
It has built in BUY/SELL alerts that can be connected to Autoview for automated trading.
How it works?
No drama, no complicated numbers - you only need to set the Alert strength indicator value (5-50) and according to that you will get the kind of alerts you like most. Choosing higher quality alerts will result in smaller quantity of those while picking out just the best entry and exit points and removing less interesting ones. You can always experiment and see what suits your trading style best.
Did we get your attention? If you wish to buy our script, shoot us a PM.