H.A B.S3 Do you prefer lower time frames starting from 3, 5, 15 and 30 minutes? Then, this Script is for you.
Applicable to any type of Market, it can also be applied to higher time frames.
Enjoy!!
Buy-sell

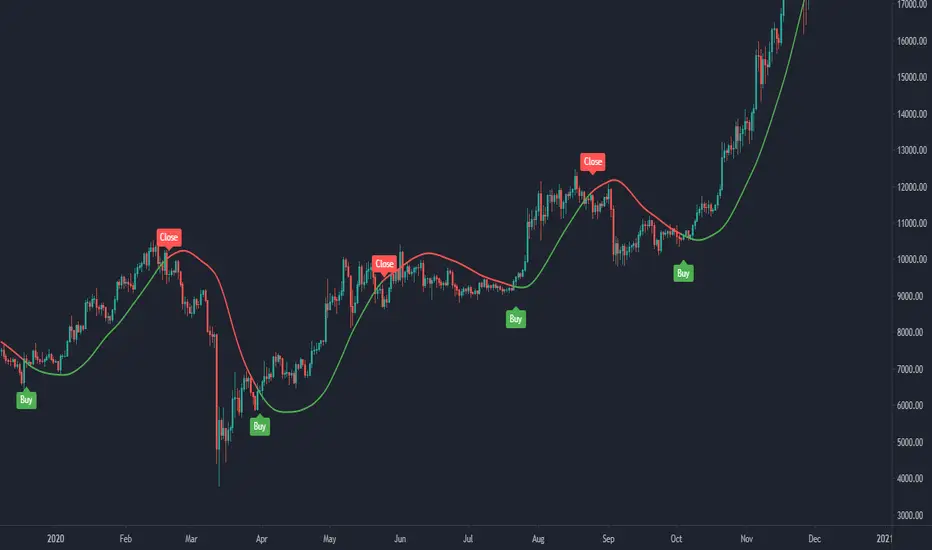
Betelgeuse-Good entry/exit zoneHello everyone and welcome!
This is the my first indicator and also the first version of Betelgeuse script,I hope you will like it.
The indicator was designed to be used on cryptocurrencies
The idea is to be able to identify good entry and exit points in the market, traders often try to identify the minimum or maximum points and this is why Betelgeuse was born.
Betelgeuse should be combined with your analysis and other indicators to find good entry and exit zones and not a precise point.Obviously the more the indicator will be used
over long time frames the more accurate the signals will be.
You can decide to wait for a good signal from the RSI or from the MACD and add up
the Betelegeuse confirmation for a good entry or exit from the market.
The MA based indicator will give you an idea of the direction of the medium term trend.
Direct message me for acces.
[FTA] Double Responsive Price FilterThis is a very special indicator which uses a series of double filtering methods to filter out bad price data.
Each filter uses a very complex mathematical formula to obtain the data, based on the Wave Function, then applies initial signal filtering on the output.
The output of each filter is then compared to each other, and the output of this stage goes through another signal filtering process which is used in aviation industry (NASA) to track objects and keep them under radar!
The final output is then squeezed through a truncated bandpass filter and plotted as two colors.
This is to ensure a very quick and responsive entry and exit signal without any lagging, and also to ensure that the trader stays in the trade as long as profitable!
Buy when color is aqua.
Sell when color is fuchsia.

Precise_SignalThis signal combines a portion of Chris Moody's 2014 SlingShot and my 2017 MTF Indicators. Both of our prior scripts over indicated Buy and Sell Points. This signal indicates a buy or sell point much less than our prior scripts did but with absolute precision.
I would say it is 100% accurate, but that is because I am yet to find a timeframe and symbol where the Buy signal failed to see the equity move up or the Sell signal failed to see the equity move down over the next 5 bars. I have tested 2000 charts so far. To be safe, I would rather state this indicator is accurate nearly 100% of the time.
The indicator is made up of 2 main portions and both of them have to agree on a buy or sell in order to indicate such with a vertical green or maroon bar beneath the chart. If there is a failure to agree, nothing is signaled.
Indicator 1 combines a stochastic of a 3 hour chart and a daily chart to determine when the stochastics are in agreement on direction. When there is agreement, both of them MUST cross from a buy state to a sell state and vice versa at exactly the same time. This is difficult to achieve and it is already rare for this occurrence to produce a signal. When a signal is produce it is combine with Chris Moody's 2014 SlingShot Indicator which conservatively determines Buy and Sell signals based on EMAs and market direction. Signals from his SlingShot are infrequent.
BUY Signal
When my MTF signals Buy at the same time that the SlingShot signals a Buy, a vertical green bar will appear in the window containing this script. The vertical bar is based on the close price of the equity and is only final when the close price is final. A BUY signal means the equity will move up potentially as early as the next bar and achieve a higher value from the close price on the signal bar.
SELL Signal
Likewise, a sell signal from the MTF at the same time as a sell signal from the SlingShot will create a maroon bar in the window containing this script. The vertical bar is based on the close price of the equity and is only final when the close price is final. A SELL signal means the equity will move down potentially as early as the next bar and achieve a lower value from the close price on the signal bar.
The default values for this script are hard-coded into this script. You can edit any of the value you would like to play with other timeframes, stochastic, and moving average lengths.
I have played with these values and have hard-coded the ones that are most accurate. Please let me know if you find others that work.
Hopefully this becomes an extra tool in your technical trading toolkit.

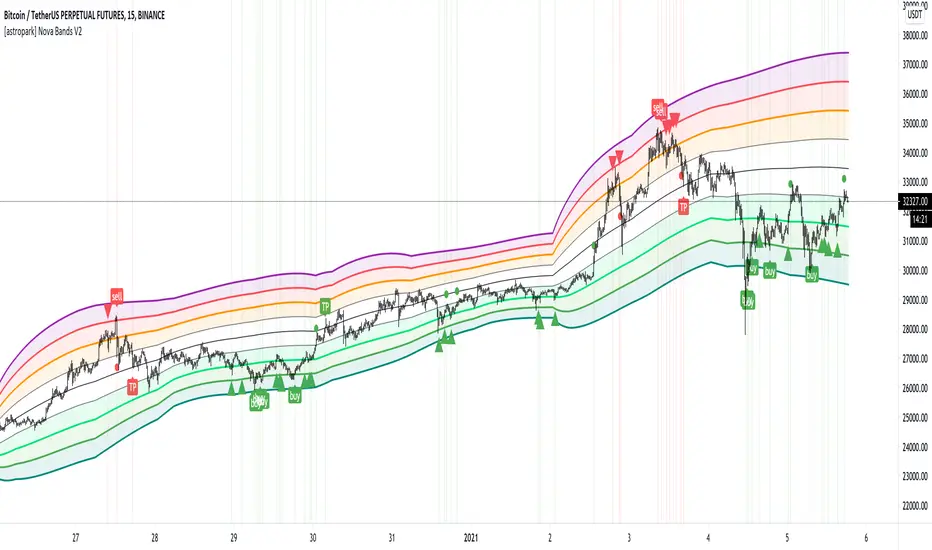
[astropark] Nova Bands V2Dear followers,
today an upgraded version of Nova Bands indicator, here below the previous V1
This is a great analysis and scalping tool for day trading on low timeframes (5-15 minutes) or to plan swing trades on hourly timeframes. It can be used also on high timeframes just for analysis current market trend.
The indicator plots a series of levels which create a nice bands flow.
The slope of levels make you easily understand when price is in consolidation, in uptrend or in downtrend.
The golden rule is always the same: buy low and sell high .
This indicator plots:
3 "price is low here" levels (from dark green to light green)
3 "price is average here" levels
3 "price is high here" levels (from purple to orange)
You can find more details on how to use the indicator in the description of V1.
Please, always remember that:
when bands are flat, price is in consolidation and this is best condition to trade with nova bands
when bands get nearer and nearer is called "Bands Squeeze": price is next to a main breakout move, volatility is coming!
The basic improvement in V2 is a different way to calculate the bands based on different timeframe resolution, default is setup to daily timeframe for example.
A trader who wants to be a winner must understand that money and risk management are very important, so manage your position size and always have a stop loss in your trades.
This is a premium indicator , so send me a private message in order to get access to this script.
PRIO Trend FollowingWith this indicator you can generate automatic BUY-SELL signal on your chart and trade with an ease. This is a trend following indicator based on HIGH-LOW ema channel. You can choose ema period from the input menu on settings, and add to your favourite time frame.

Long Short | Buy Sell IndicatorThis indicator is based on an adaptive RSI. You can change one setting, the period. The period means, how many past bars are included in the calculation of the indicator. Be aware, that the period needs to be the same or less than the available past bars of your trading pair. The indicator works on every timeframe. The past data bars are repainted, but the real time indicator should just give you valid buy and sell alarms.
The indicator includes:
- buy / long signals
- sell / short signals
- buy and sell prices
- results of trades
- alarms for buy and sell
Please try it out at first with no money or something. Just set alerts for buy and sell and check the performance of the indicator afterwards, maybe it is a good strategy for you with your settings.
Greetings,
snurk
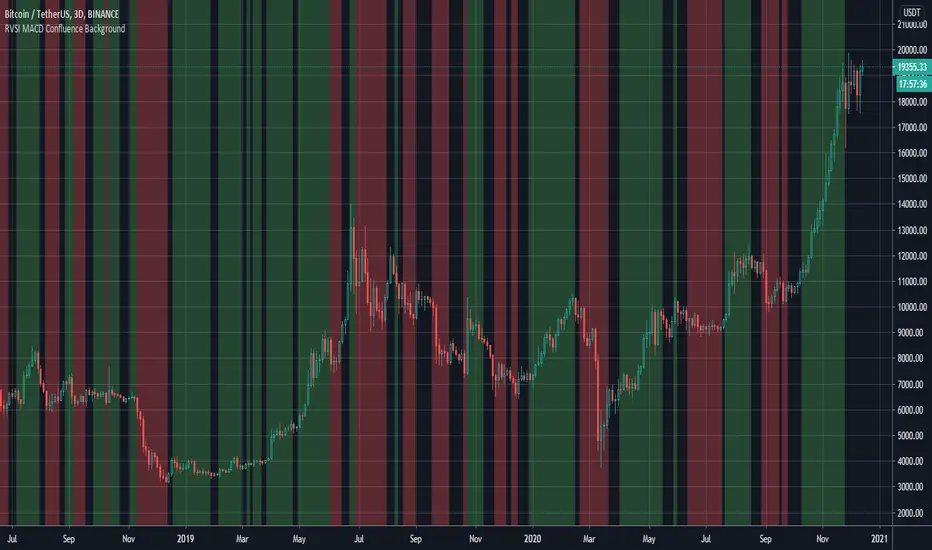
RVSI & MACD Confluence BackgroundThis indicator colors the background in vertical (green/red) stripes to indicate if the current trend is possibly bull / bear
A region where the background is not colored indicates that the present trend can not be identified
The algo combines the RVSI (Relative Volume Strength Index {ref fract} ) and the MACD
The Relative Volume Strength Index has been adapted to include 2 moving averages, one fast and one slow
This same fast slow lookback length is applied to the MACD for simplicity
What's interesting is that there is a very strong confluence between the MACD and RVSI, as the MACD is obtained from 'price action only' and the RVSI from the 'volume only'
So a break in confluence of these two might suggest that the current trend is weakening in confidence or can not be clearly identified
Generally, a green background means consider going long ie price trend is rising
A red background means consider going short ie price trend is falling
An absent background color means - consider exiting current trade or wait to get into a new trade
Best Regards, MoonFlag - and a special thanks/mention to 'fract' for the RVSI algo this is derived from
Trend Trader Buy/Sell SignalsTrend Trader
The code is open source, what it uses to print signals is MACD cross and ADX. Bar colors change in relation to where price is according to the 50 day MA. The MA ribbon is used for visualizing trend and using it for dynamic support/resistance. The ribbon is comprised of the 50 day and 100 day MAs.
Main reason to publish this script is because some like to jumble up scripts together slap some moving averages on it to "follow trend" and then label it an algorithm, market it and sell it to people online. No single system will work 100% of the time, do you due diligence in anything you are interested in buying. Plenty of free scripts in the TV library that can do you justice when trading.

Escaping of Rate from Avarage By Mustafa OZVEREscaping of Rate from Average By Mustafa OZVER
This code shows a location of a rate or price (or etc.) from the average, rated by the standard deviation.
To show that, calculates the ema and standard deviation of our data then calculates the distance between ema and the current data by the standard deviation.
In summary, we can say that this value is the current distance by the long term standard deviation.
This value is between +1 and -1 because we expect the absolute value of the standard distance does not get far from the long term standard deviation.
For scalping, we can use this value as
buy signal when the value is below -1,
sell signal when the value is above +1,
But only this value can not guarantee good results for trading. BE CAREFUL

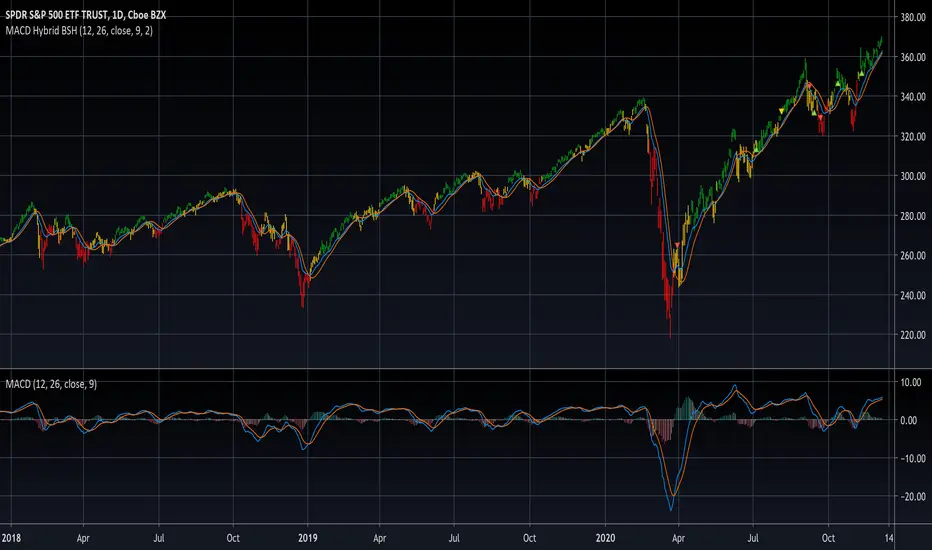
MACD Hybrid BSHMACD = Moving Average Convergence and Divergence
Hybrid = Combining the two main MACD signals into one indicator
BSH = Buy Sell Hold
This indicator looks for a crossover of the MACD moving averages (12ema and 26ema) in order to generate a buy/sell signal and a crossover of the MACD line (12ema minus 26ema) and MACD signal line (9ema of MACD line) in order to generate a completely seperate buy/sell signal. The two buy/sell signals are combined into a hybrid buy/sell/hold indicator which looks for one, neither, or both signals to be "buys." If both signals are buys (fast crossed above slow), a "buy" signal is given (green bar color). If only one signal is a buy, a "hold" signal is given (yellow bar color). If neither signal is a buy, a "sell" signal is given (red bar color). Note: MACD moving averages crossing over is the same thing as the MACD line crossing the zero level in the MACD indicator.
It makes sense to have the MACD indicator loaded as a reference when using this but it isn't required. The lines plotted on the chart are the 12ema and a signal line which is the MACD signal line shown relative to the 12ema rather than the MACD line. The 26ema is not plotted on the chart because the chart becomes cluttered, plus the moving averages crossing over is indicated with the MACD indicator.
This indicator should be used with other indicators such as ATR (1), RSI (14), Bollinger bands (20, 2), etc. in order to determine the best course of action when a signal is given. One way to use this as a strict system is to take a neutral cash position when a yellow "hold" signal is given, to go long when a
green "buy" signal is given, and to go short when a red "sell" signal is given. It can be observed that for many tickers and timeframes that green-yellow-green and red-yellow-red sequences are stronger signals than green-yellow-red and red-yellow-green signals.
Note: Chart type must be "bars" in order for the bar colorization to work properly
ATR SL Buy/Sell w/ SMAsFirstly I'd like to state that this script's ATR buy/sell source is from the public script library here:
Additionally with the buy/sell signals from the original script, two more buy/sell conditions were added to give more entries/scaling in or out options. On top of that, two SMA lines were added, a 1 day moving average and a 5 day moving average.
This script is more so designed for scalping/scaling in and out of positions already made.
The SMAs add a level of confidence to the entry order, buy/sell triggers are not based on these SMAs.
For the confirmation on the entry, ideally you want a bullish cross on the SMAs, as well as the color of the SMA to correlate to the buy/sell color.

RSI Chart Bars 8 55 45Dear Traders
This RSI 8 period made for perfect entry for Long and Short for Intraday/Scalping in any time frame, when RSI 8 crossed above 55 the Candle charged to White then you can go for Long/Buy and when crossed below 45 the Candle changed to Yellow so you can go for Short/Sell, it working in any time frame.
Thanks & Regards
Nesan
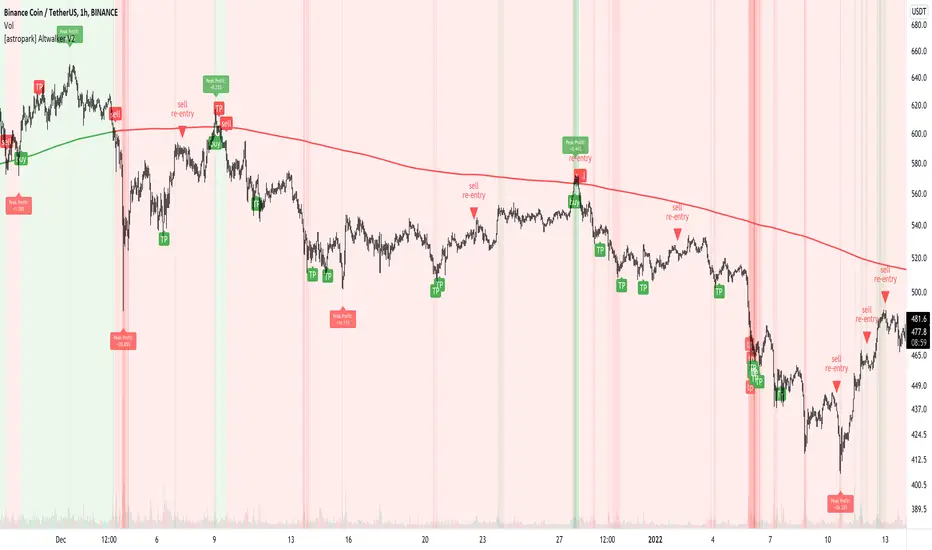
[astropark] Altwalker V2Dear Followers,
today I'm happy to share with you Altwalker V2 , an updated version of the former Altwalker for lower timeframes (from 5 minutes to 4 hours).
It is both a Swing and Scalping Strategy indicator , based on a simple trend following theory , mainly designed for Cryptocurrencies, Altcoins and of course Bitcoin.
Here you can see the Altwalker V1:
Based on Moving Average, Altwalker V2 on low timeframes dynamically identifies market resistance and support, so in which trend a cryptocurrency is during time:
green trendline and background means bullish trend , in fact it start with a "buy" signal
red trendline and background means bearish trend , in fact it start with a "sell" signal
if a series of buy and sell appears (this may happen especially in lower timeframes), this means price is in consolidation or distribution phase, so be prepared for a new trending phase coming soon, always remembering that taking profits is awesome and managing your risk by defining you position size and having a stoploss is a must in trading
To help in Taking Profits, Altwalker integrates also 2 special tools besides the trend highlighter:
Overbought and Oversold RSI Signals , which appear both as darker background (the darker the color, the more the price is in overbought/oversold) and green "ob"-"tp" / red "os"-"tp" labels (they optionally pop up only on a configurable stronger overbought/oversold condition) (you can enable/disable it optionally)
Peak Profit Tracker , which resets every time a new trade start and keeps track of price fluctuation during the trade: the message is don't be too much greedy and take profits or lock them with a stoploss in profit (you can enable/disable it optionally)
You can edit many options in order to
enable/disable showing buy/sell signals
enable/disable showing trendline
edit trendline variant (you have 2 options, by default variant 1 is selected)
enable/disable showing trend as background
enable/disable showing RSI TP signals
edit RSI length, overbought (OB) and oversold (OS) levels
enable/disable showing peak profits on each trade
The user who wants to use this strategy, especially via an automated bot, must always set a stoploss (example 150$ from entry on bitcoin ) or use a proper risk management strategy .
This is not the "Holy Grail", so use it with caution. It's highly suggested to use a proper money management .
This script will let you set all notifications you may need in order to be alerted on each triggered signals.
Here there are some examples how Altwalker V2 works on many timeframes and markets:
LINK/USDT 1h
XLM/BTC 1h
ETH/BTC 1h
ETH/USDT 1h
COMP/USDT 1h
YFI/USDT 15m
NEO/BTC 5m
VET/USDT 15m
This is a premium indicator , so send me a private message in order to get access to this script .
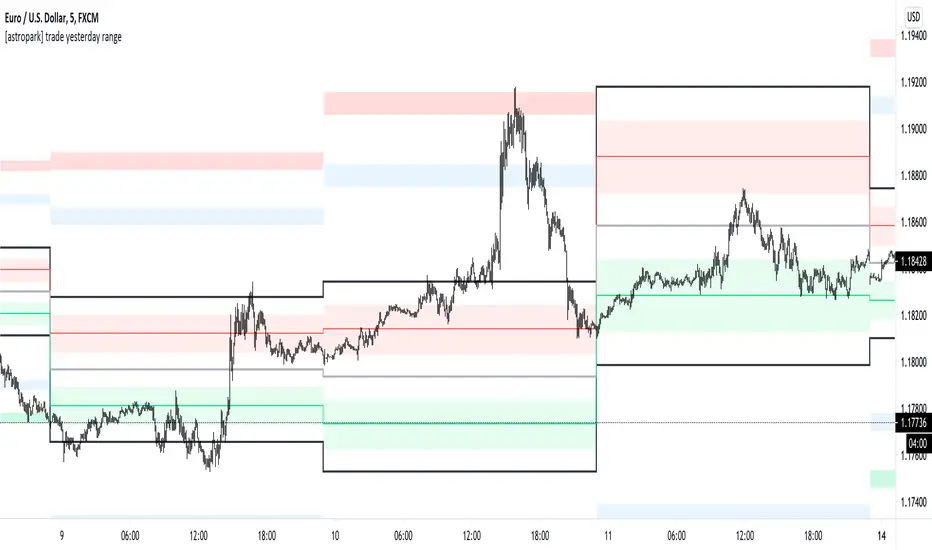
[astropark] trade yesterday rangeDear followers,
today a nice scalping tool for day trading on low time frames (1-3-5 minutes)!
Each day the indicator will print some important levels and ranges related to the trading day before:
yesterday high (black line)
yesterday day range averange (silver line)
yesterday low (black line)
average between yesterday high and yesterday average, together with a resistance range (red)
average between yesterday low and yesterday average, together with a support range (green)
two extension ranges above yesterday high (first is blue, second is red)
two extension ranges below yesterday low (first is blue, second is green)
Trading levels is one of most effective trading tecniques:
once a level is broken upwards, you can long (buy) the bullish retest with stoploss below recent low
once a level is broken downwards, you can short (sell) the bearish retest with stoploss below recent high
consolidation below or at a resistance level is bullish, so long (buy) breakout upwards and long more on a bullish retest of broken level
consolidation above or at a support level is bearish, so short (sell) breakout downwards and short more on a bearish retest of broken level
many times you see a level to be tested 2 or 3 times: short (sell) double and triple top, long (buy) double or triple bottom
Here you can see the levels described above and basic usage in a consolidation trading day:
A trader who wants to be a winner must understand that money and risk management are very important, so manage your position size and always have a stop loss in your trades.
Here you can see many examples on how to use this indicator.
Triple top on yesterday range high: perfect short setup (5 take profits targets in the example)
Resistance levels broken: long setup on bullish retest (2 take profits targets in the example)
Double top and support broken: 2 short setups (2 and 3 take profits targets in the example)
Here some examples how to basically use the indicator in a consolidation trading day: short (sell) resistance levels, long (buy) support levels
This is a premium indicator , so send me a private message in order to get access to this script.
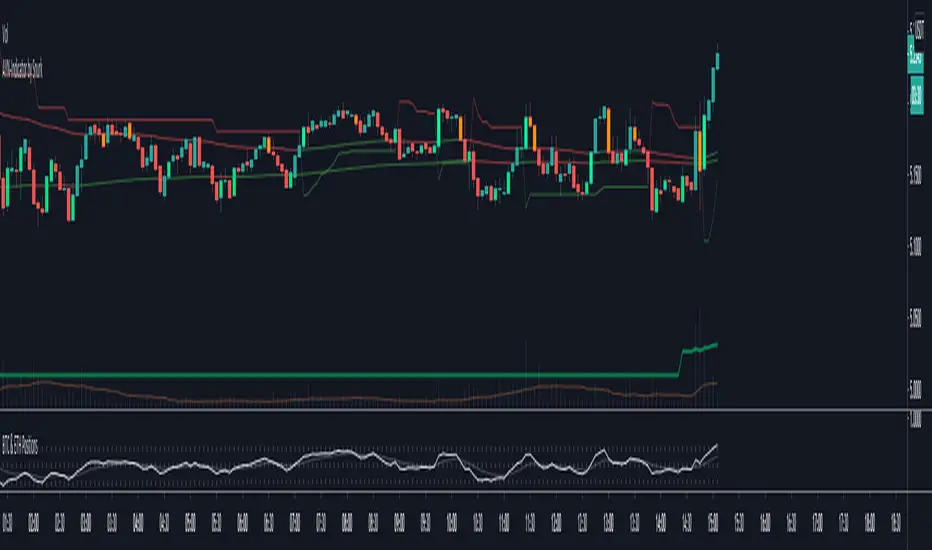
CCI & EMA_CROSS_PaydarCCI & EMA_CROSS_Paydar
Hello everyone
This indicator is actually a very efficient oscillator,
This system is a unique combination of indicators CCI and EMA, which of course has special settings, these settings are adjusted as much as possible due to signaling.
As you can see in the picture:
CCI: the two colors line, green and red, are actually the same indicator CCI that I set to 20.
*Note that in index CCI I have set the lines +100 and -100 to +75 and -75 for less error and a stronger signal to sell or buy.
EMA: The white line, which is in the form of steps, is in fact the same indicator of EMA, which I have considered as a value of 9.
_________________________________________________________________________________________________________
Instructions
-> areas:
Zone +75 to +200 = positive range or incremental price or bullish
Zone +75 to -75 = Neutral range or almost constant price (no fluctuations or very wet fluctuations)
Zone -75 to -200 = single range or discount price or bearish
->How to use:
Buy = In the bearish range, if line CCI intersects line EMA upwards and goes to the neutral zone.
None = if the index (or index lines) collide in the neutral zone
Sell = In the bullish range, if line CCI intersects line EMA down and goes to the neutral zone.
-> Please comment on this system or if you have a good experience in changing the values of the indicators or it seems to you, please share.
With great respect to:
Who had published the main idea of this system.

PT Buy Sell IndicatorVersion 1.0 of our Buy & Sell indicator helps determine when a time-frame is ready for a possible reversal. The indicator is primarily based on the movement & behavior of the RSI. We recommend using the indicator on Binance exchange (USDT) with H1, H2, H3 & H4 time frames. We have put together a video with a strategy on how to take the signals best. Please watch the video to understand how to use it. You can also ask us questions in our discord to better understand the indicator.
There are currently two different settings that come with the indicator. Our aggressive & standard toggle each offer various set of signals.
- Aggressive toggle: more signals throughout multiple time-frames. Recommended for the more advanced traders that can combine technical analysis with their setups. Best time-frame H3, H4 & H12. (Use Reduce Signal Threshold input #7+)
- Standard toggle: fewer signals with a bit less risk. Recommended for traders that are just starting. Best time-frame 15m, 30m, H1, H2, 3D & 5D (Use Reduce Signal Threshold input #4)
The buys & sells are not in-sync with each other. They tend to fire independently when the specified time-frame is ready for a possible reversal.
The most successful method we structured for the buy/sell indicator is combining the PT STx & the PT Top/Bottom Bands (both included in our library). The PT Top/Bottom Bands helps you gauge the closest trouble area. When signals fire, we look at our top/bottom band indicator to find an entry as close to support/resistance as possible. The bands are isolated & color-coordinated.
Red Band - Overbought zone
Gray Bands - Within the range
Orange Band - Our EQ (middle of the range)
Green Band - Oversold zone
This eliminates the guessing game that invalidates your trade setup. The best risk to reward is taking sell signals (shorts) as close to the red band while targeting the orange band (eq) & taking buy signals as close to the green band while targeting the orange band (eq).
There are four different inputs that you can tweak to cater to your trading style. Each input is customizable based on the time frame. We get into detail about this in our video. Watch the video & do not take signals blind!
The secret sauce to having the highest success rate is to take the signals only when the PT STx (included in our library) has fired its algorithm.
This is an invite-only script. Please message us for access to our whole library.
As we keep making progress with our indicators, you will be granted access to each of them as long as you are a Pattern Trader member!
There will be limited access to our library until version 2.0 is released.

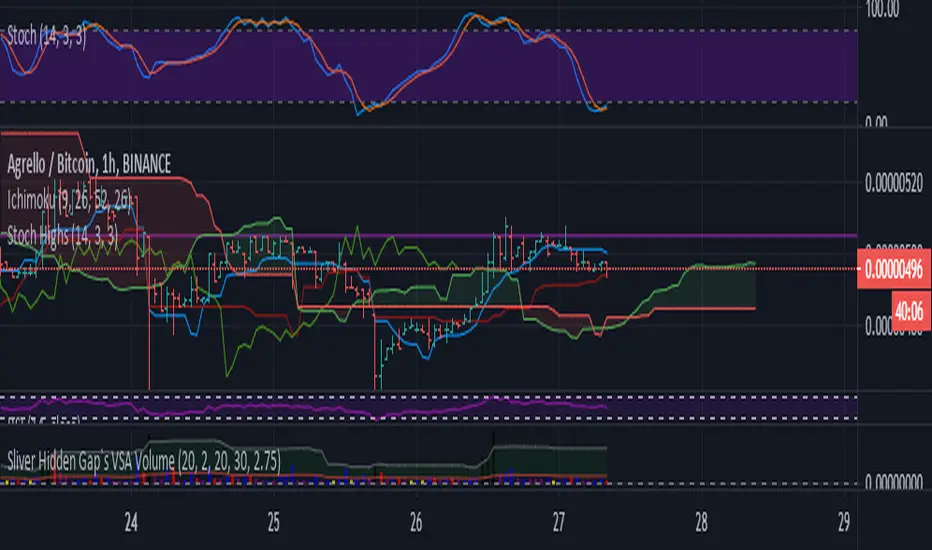
Pink panther It is a simple indicator, you can use it with all time frames. So the pink line present the last high potential area that price try to breakout , and to use it you must consider three main things :
1- price on your time frame above Ichimoku cloud.
2- RSI above 50.
3- MACD crossover.
how to execute your order?
when price break the pink line and close 1 minute candle .
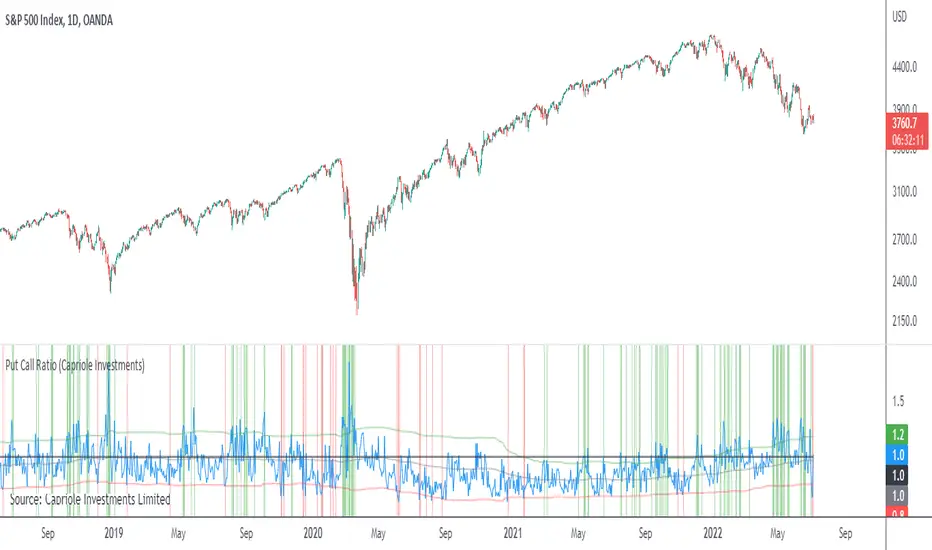
Put Call RatioPlots the CBOE Put Call Ratio and marks up locations of extremities.
Useful as a factor of confluence in identifying extremities in the market.
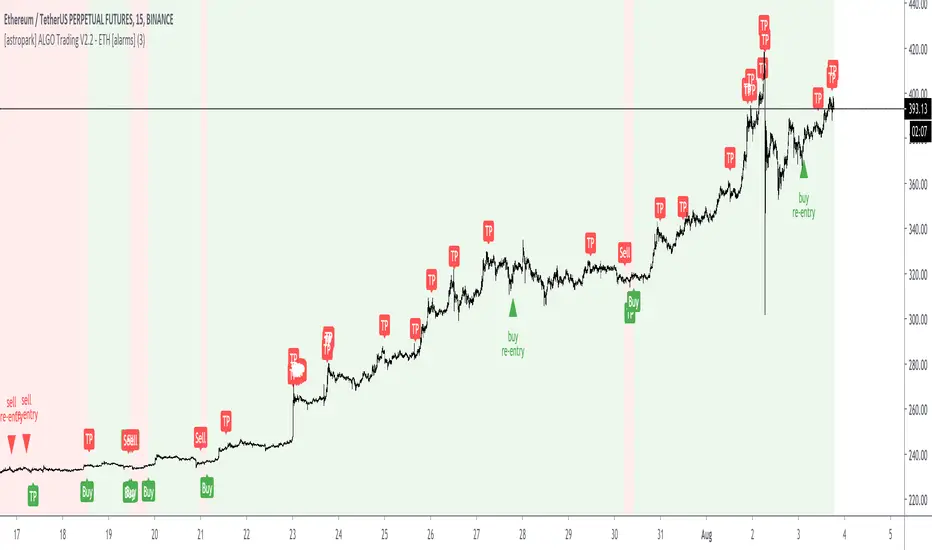
[astropark] ALGO Trading V2.2 - ETH [alarms]Dear Followers,
today another awesome Swing and Scalping Trading Strategy indicator : the upgraded version of ALGO Trading V2 for Binance Ethereum PERP on 15m timeframe!
It is runnable on a bot , just write me in order to help you do it.
If you are a scalper or you are a swing trader, you will love suggested entries for fast and long-lasting profit.
Keep in mind that a proper trailing stop strategy and risk management and money management strategies are very important (DM me if you need any clarification on these points).
This is an upgrade version of ALGO Trading V2 for Ethereum.
You can find ALGO Trading V2 indicator here below:
If you are interested in Bitcoin Trading, you will like for sure ALGO Trading V1.2, which is a customized version for Bitcoin trading:
This strategy has the following options:
enable/disable signals on chart
enable/disable bars and background coloring based on trend
enable/disable a Filter Noise option, which reduces overtrading
enable/disable a Trailing Stop option
enable/disable/config a Take Profit option, with Re-Entry
enable/disable a secret Smart Close Option which may improve profit on your chart (again, check it on you chart if it helps or not)
This strategy only trigger 1 buy (where to start a long trade) or 1 sell (for short trade). If you enable Take Profit / Stop Loss option, consider that many TP can be triggered before trend reversal, so take partial profit on every TP an eventually buy/sell back lower/higher on RE-ENTRY signal to maximize your profit.
This script will let you set all notifications you may need in order to be alerted on each triggered signals.
The one for backtesting purpose can be found by searching for the astropark's "ALGO Trading V2.2" and then choosing the indicator with "strategy" suffix in the name, or you can find here below:
This is not the "Holy Grail", so use proper money and risk management strategies.
This is a premium indicator , so send me a private message in order to get access to this script.
Yogesh_SignalThis signal is to be plotted on the underlying symbol for which options can be sold for the the same.
If signal line is raised with green color that means I can sell put options with proper hedging so that I will not loose more that 3% of my capital.
Until the horizontal zero line is green one can stay in the position with bullish bias. If it turns red then one should exit position, and re-enter again if zero line becomes green
If signal line is raised with red color that means I can sell call options with proper hedging so that I will not loose more that 3% of my capital.
Until the horizontal zero line is redone can stay in the position with bearish bias. If it turns green then one should exit position, and re-enter again if zero line becomes red
Please make sure you do not bet more than 3% of your capital. I am not suggesting anyone to trade based on my indicator. It's for guidance and not to instruct you. All trade decisions are solely your's
Thanks,
Yogesh

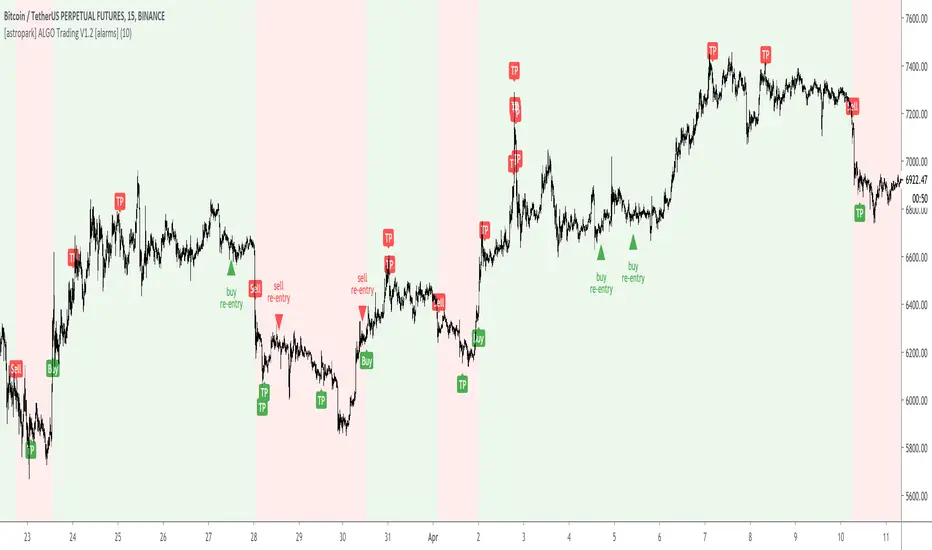
[astropark] ALGO Trading V1.2 [alarms]Dear Followers,
today another awesome Swing and Scalping Trading Strategy indicator : the upgraded version of ALGO Trading V1 for Binance Bitcoin PERP on 15m timeframe!
It is runnable on a bot , just write me in order to help you do it.
If you are a scalper or you are a swing trader, you will love suggested entries for fast and long-lasting profit.
Keep in mind that a proper trailing stop strategy and risk management and money management strategies are very important (DM me if you need any clarification on these points).
This strategy has the following options:
enable/disable signals on chart
enable/disable bars and background coloring based on trend
enable/disable a Filter Noise option, which reduces overtrading
enable/disable a Trailing Stop option
enable/disable/config a Take Profit option, with Re-Entry
enable/disable a secret Smart Close Option which may improve profit on your chart (again, check it on you chart if it helps or not)
This strategy only trigger 1 buy (where to start a long trade) or 1 sell (for short trade). If you enable Take Profit / Stop Loss option, consider that many TP can be triggered before trend reversal, so take partial profit on every TP an eventually buy/sell back lower/higher on RE-ENTRY signal to maximize your profit.
This is not the "Holy Grail", so use proper money and risk management strategies.
This indicator will let you set all alerts you need in order to get notified whenever a new signal is triggered.
To check its backtesting, you should use the strategy version, that you can find by searching for "ALGO Trading V1.2" or here below:
You can check out previous ALGO Trading V1 indicator here below:
This is a premium indicator , so send me a private message in order to get access to this script.
Smart Forex Buy Sell Signal by LukasHi again!
So, this is BUY and SELL signal base on Price action, RSI, and Correlation between Forex Major Pairs.
It's only work for Forex Major Pairs because I only took their data.
Included alert : Spec, Buy, Strong
Recommended to wait for double signal :
Spec Buy > Buy or Spec Sell > Sell
Buy > Strong Buy or Sell > Strong Sell
So execute after the second signal triggered.
It's indicate the trend.
Looking forward for your feedback to improve the script.
Thank you.
It's better combine it with Moving average indicator to indicate direction, I use Moving Average Adaptive Q from cheatcountry to help me make decision.
