Leledc Exhaustion Bar V4 PLUSLeledc Exhaustion Bar indicator created by glaz converted to Pine 4, plotshape was added.
Buy-sell

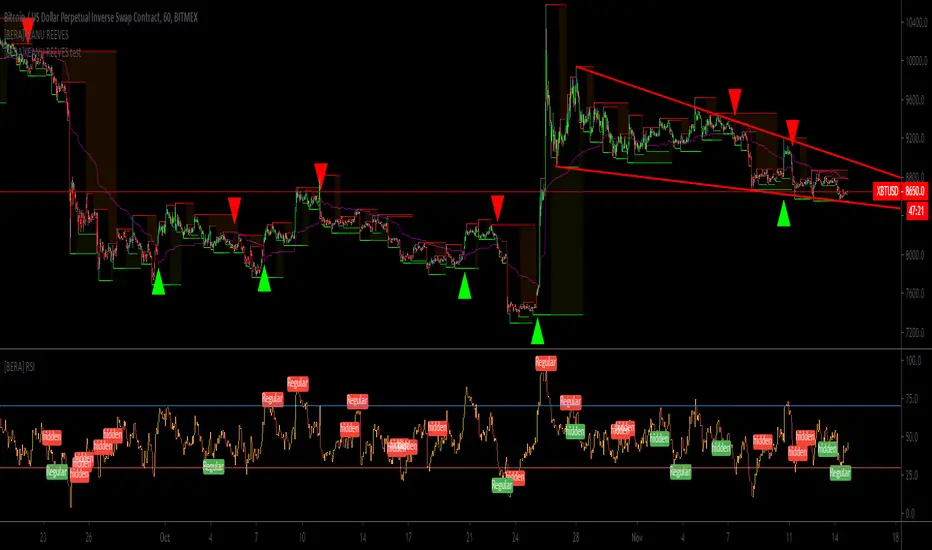
[BERA]KEANU REEVESThis is BUY/SELL indicator integrated with support and resistance (HIGH AND LOW).
THIS IS ONLY FOR TESTING PURPOSES(SOME PEOPLE ASKED ME A TRY), I WILL REMOVE IT.
Indicator based on Average true range .
LIME ARROW = LONG
RED ARROW = SHORT
LIME COLOR BARS IF GREEN ARROW CONDITION VALID.
RED COLOR BARS IF RED ARROW CONDITION VALID.
>CURRENT SETUP OF METRICS IS IDEAL FOR BTC H1 CHART, FOR ALTCOINS YOU SHOULD USE DIFFERENT METRICS,
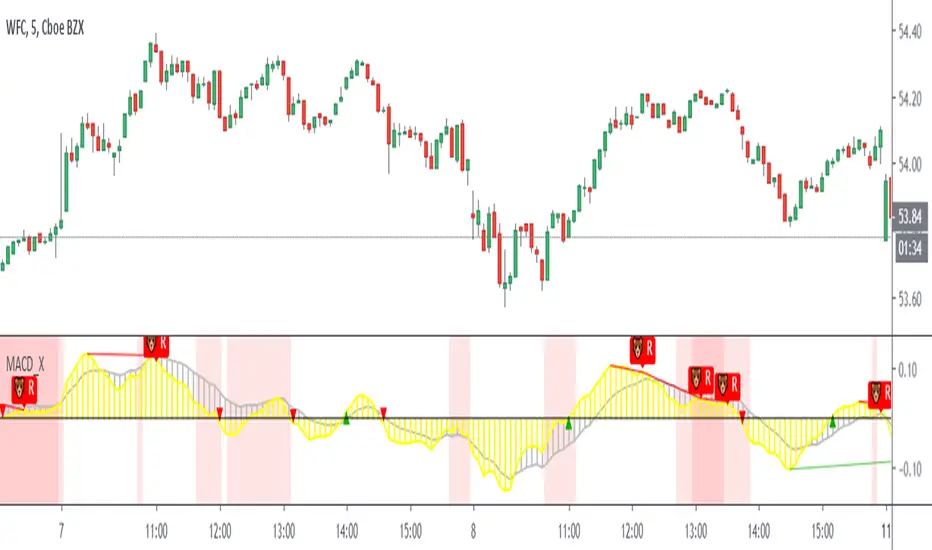
Double MACD Buy and SellIndicator for strategy that was used in a Forex competition and was a winner. Use double MACD with custom settings, search video on YouTube:
Learn Five Powerful MACD Trading Strategies
Add some tools to analyze the market context a little more:
- Detector of regular and hidden divergences.
- Atlas Zone (detects consolidation that is about to generate a movement)
- Choppines zone configurable (detects if the market is stable or not)
Visualization of entries in trend and counter-trend according to the rules described in the video.
Buy and sell alerts.
Note: I do not recommend using only this indicator as an investment strategy, it is another tool that must be complemented with a market study by the trader.
🐳 Whales 🆚 Little Fish 🐟THIS INDICATOR DETERMINES WHAT THE STRONG HANDS AND WEAK HANDS ARE DOING, BASED ON THE FAMOUS INDICATOR "KONCORDE", OBTAINED FROM THE PERCENTARY VARIATION OF THE INDICATOR IVP (POSITIVE VOLUME INDEX) AND IVN (VOLUME INDEX). ANYONE READING THE AVAILABLE DOCUMENTATION ON THESE TWO SMALL MATHEMATICAL JEWELRY WILL DISCOVER THAT THE ATTRIBUTED VOLUMES NEGOTIATED TO STRONG HANDS (IVN) OR WEAK HANDS (IVP).
NOTE: USE THIS INDICATOR ONLY IN INSTRUMENTS WITH REAL VOLUME.

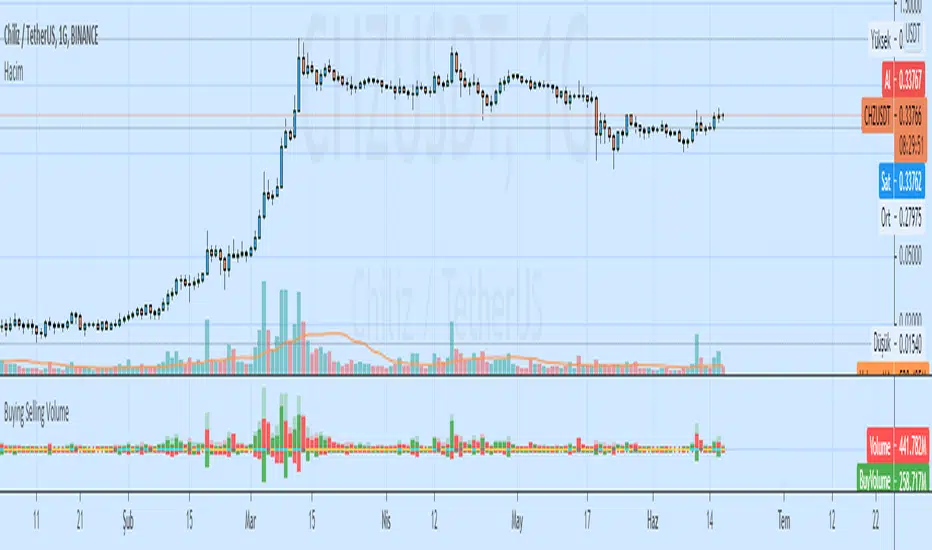
Buying Selling VolumeBuying Selling Volume
-Buy Volume
-Sell Volume
-Buy Volume Percent %
-Sell Volume Percent %
-Volume Index
-Buy Sell Volume-
BuyVolume>SellVolume=Blue barcolor
SellVolume>BuyVolume=Purple barcolor
-Volume Index-
VolumeIndex>length and close > open =Cyan barcolor
VolumeIndex>length and close < open =Gray barcolor
VolumeIndex<=length = Yellow barcolor
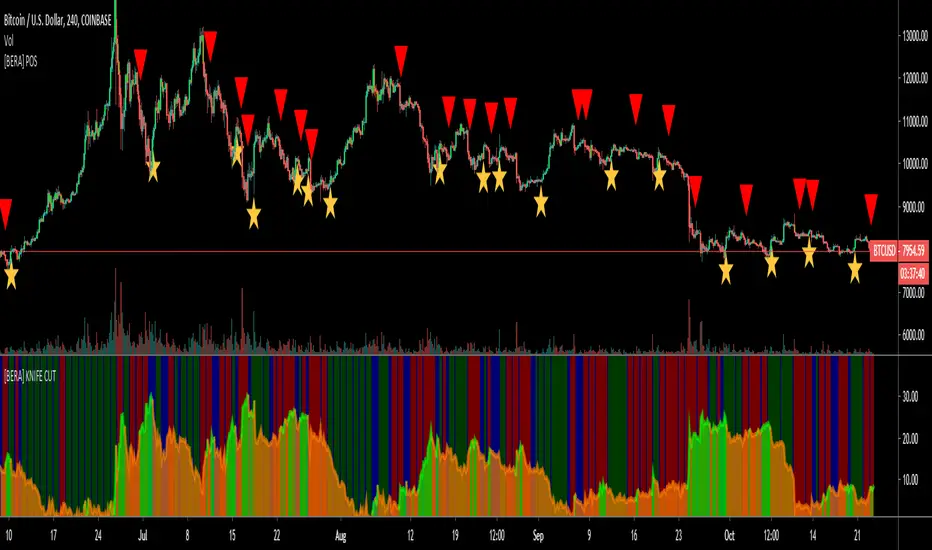
[BERA] PILE OF SIGNALSHey bulas and beras, another indicator for help your decision.
Ok lets start.
PILE OF SIGNAL, i admit the last word of the title was a bad word and changed to avoid permaban ok lol ahah.
Description= this indicator use moving averages crosses and volume as decision point, what mean this? simple when a move is coming this indicator will show you the probable "direction" of next move. these signals are not buy and sell, also because multiple signals can occour, you should use it with you own TA.
-Moving Averages
-Crosses
-Volume
RED ARROW ABOVE BAR= PROBABILITY OF DOWN MOVE INCOMING
STARS BELOW BAR= PROBABILITY OF UP MOVE INCOMING
Simple.
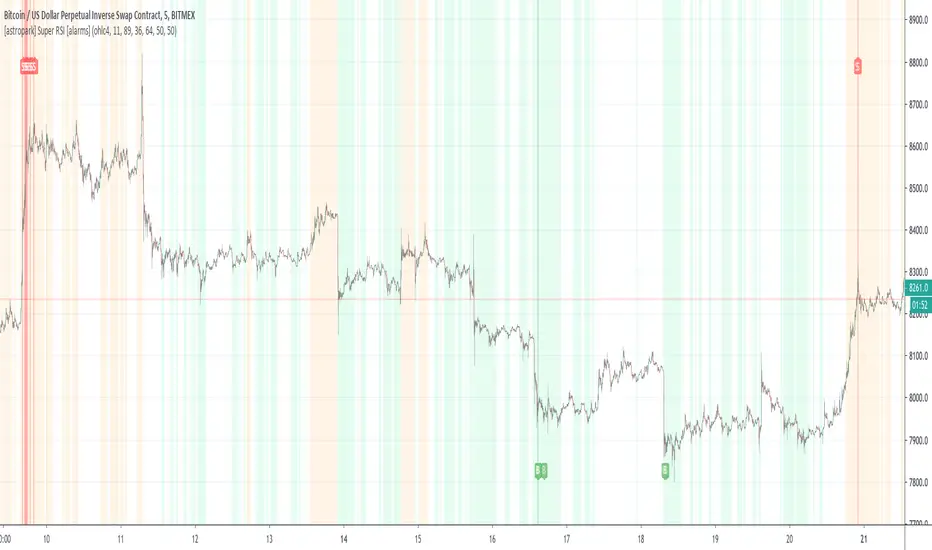
[astropark] Super RSI [alarms]Dear Followers,
today a new Scalper Tool , which works great on 3 minutes and 5 minutes timeframes , but also down to 1m and up to 30m!
I called it " Super RSI ", as it is based on RSI and inherits some basic functionality from it.
If you check its settings, you will see that you can have 3 different buy-sell sources (first two are active by default):
STRONG BUY/SELL : buy when white area deeply falls into oversold-red zone and sell when white area gets into overbought-green zone (you can set and edit at which level oversold and overbought zones start);
CROSSES : buy when the black RSI line in the middle between red and green area cross under the buy cross limit value and sell when it crosso over the sell cross limit value (you can set and edit specific cross ranges for both buy and sell);
WEAK BUY/SELL : buy when green area at least go below 50 level and sell when red area at least goes above 50 level (you can edit both levels); these conditions are highlighted as background color and are very useful for taking (at least partial) profits in trades.
By default the script will be placed as overlay on the chart, but
> you can activate the oscillator plot by disabling the "hide all plot" option
> and place it in a below pane by clicking on the black arrow at then end on the indicator name in chart and selecting "move to -> a new pane below"
This strategy can trigger till 10 buy or 10 sell signals in a row before reverting, so use a proper money management .
Strategy results are calculated on 20 trading days using 1000$ as initial capital and working at 10x leverage.
The user who wants to use this strategy, especially via an automated bot, must always set a stoploss at 3-5% from entry point or use a proper risk management strategy .
This is not the "Holy Grail", so use it with caution.
This script will let you set all notifications you may need in order to be alerted on each triggered signals.
The backtesting script version of this indicator, which will let you backtest this script and find best settings for your preferred market, can be found here below:
This is a premium indicator , so send me a private message in order to get access to this script .
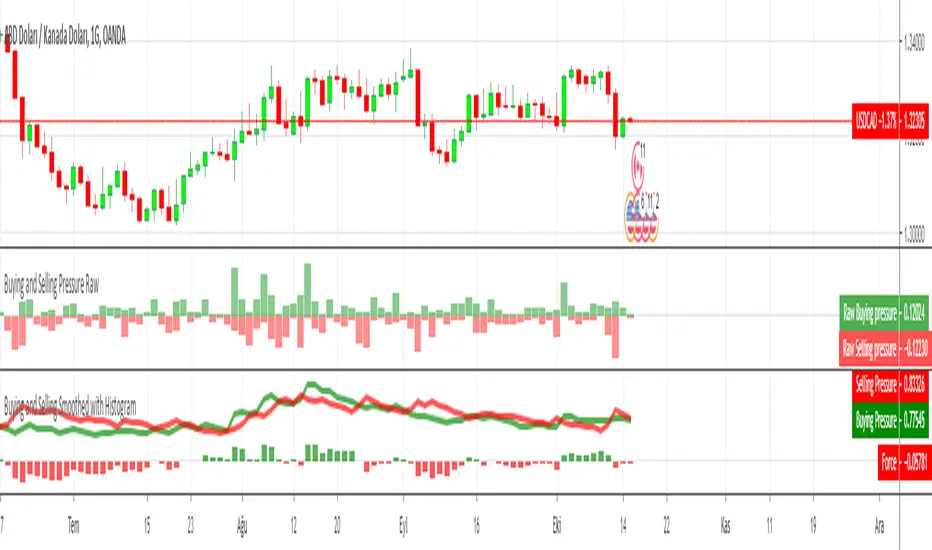
Buying and Selling Pressure RawBuying and Selling Pressure Raw
Raw Buying and selling pressure Indicator. The Raw buying and selling indication is provided in terms of a Columns.
Green bars above zero show the buying pressure and the red bars below the zero line show the selling pressure.
This presents a good visual representation of the dominating pressure.
[BERA] Momentum AvgHey BULAS & BERAS!
Momentum Avg is my new creation.
Simple trend following script using Momentum and Moving Average criterias.
Work with every timeframe. Hope you like ok
GREEN BARS = UPTREND
RED BARS= DOWNTREND
LIKE it because i am a member of bera council ok, like my hard work.

Simple TrendSimple Trend
- Show levels to continue on Trend
- Trend Indicator for Long and Short entries
- It can be used as a trend indicator or as a trailing stop loss
- Long and Short Labels and Alerts
- Configurable in Periods and the type of MA for the calculation

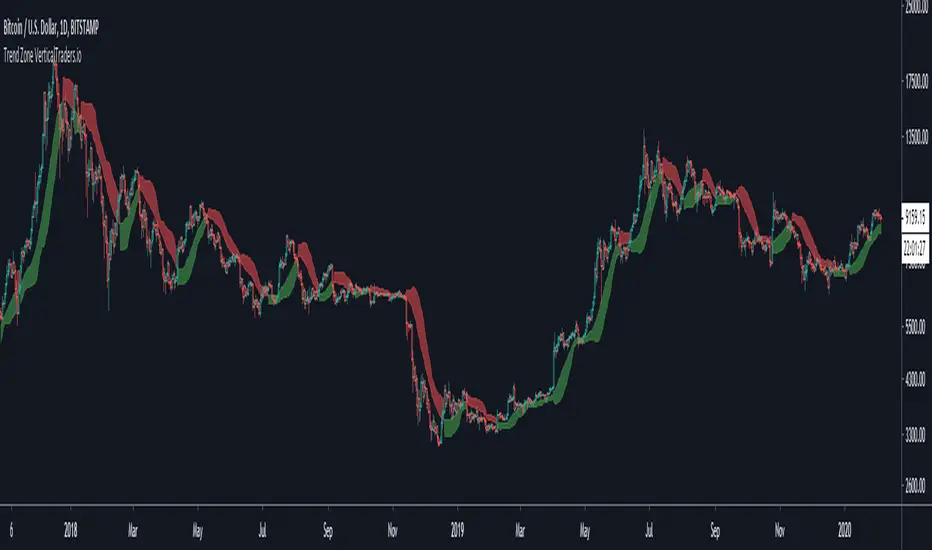
Trend ZoneTrend Zone
- Shows the risk areas to continue in a trend
- Trend Indicator for Long and Short entries
- It can be used as a trend indicator or as a trailing stop loss
- Long and Short Labels and Alerts
- Configurable in Periods and the type of MA for the calculation
Trend ProTrend Pro
- Trend Indicator for Long and Short entries
- It can be used as a trend indicator or as a trailing stop loss
- Long and Short Labels and Alerts
- Configurable in volatility values and periods

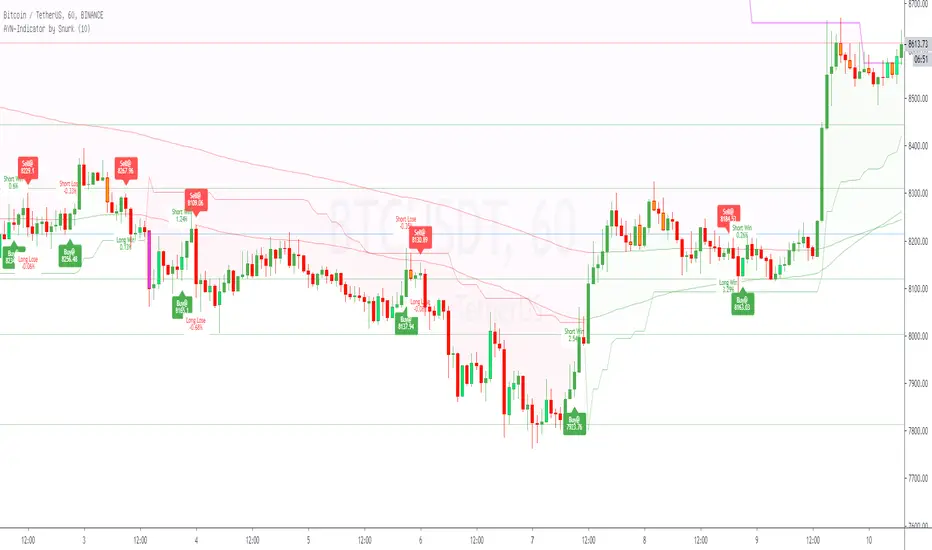
AYN: Buy-, Sell-, Trend- and SwingSignals incl. AutoFibo
Hi,
i want to introduce you to my AllYouNeed-Indicator. I calculate the buy sell signals within different timeframes independent in wich timeframe you are, therefore Pinescript suppose the Signal could be repainted. I was not able to fix this error, but after frequent checks of the result i haven't found a single repaint. Please try it out and let me know me, if you still get caught by a repaint.
Features:
- Short, Mid and Longterm-Trends
- Buy and Sell Signals and Results as well with Labels (Prices, Percentage, Win/Lose)
- Length Multiplier for different Marketsituations
- Trend-Signals with Barcolors (Lime=Uptrend, Fuchsia=Downtrend)
- Swing-Signals with Barcolors (Lime=Upswing, Orange=Downswing)
- Auto-Fibonacci with changing Linecolors as Support(green) / Resistance(red)
Hope you like it, feel free to contact me for further informations.
Please leave a comment on what I can do better, thanks.
Best regards,
snurk
[BERA] SUper BOSSHey beras and bulas, this is another gift for you! work in sync with KNIFE CUT script
Please message me if you like my indicators. Thanks you.
This indicator work in sync with KNIFE CUT, check it.
SUper BOSS
Is a special indicator with 2 metrics you can use for be a better trade and stop losing money entering useless positions.
using also KNIFE CUT you will get up to 4 parameters you can compare, for enter only good trades.
This indicator can:
Supports and resistances area as point of reference.
OverBought, Oversold candles
Green line is a LONG, Red line is a SHORT.
4H example, work with all timeframes also for excellent 15m scalping.
SEE? many opportunities.
Tried this with 15m timeframe trading ALGO MOON or DOOM and the result is incredible.
With SUper BOSS and KNIFE CUT, you will earn money in any timeframe!
I may find 15 trades a day with this system.
See price history.
You not believe? i believe.

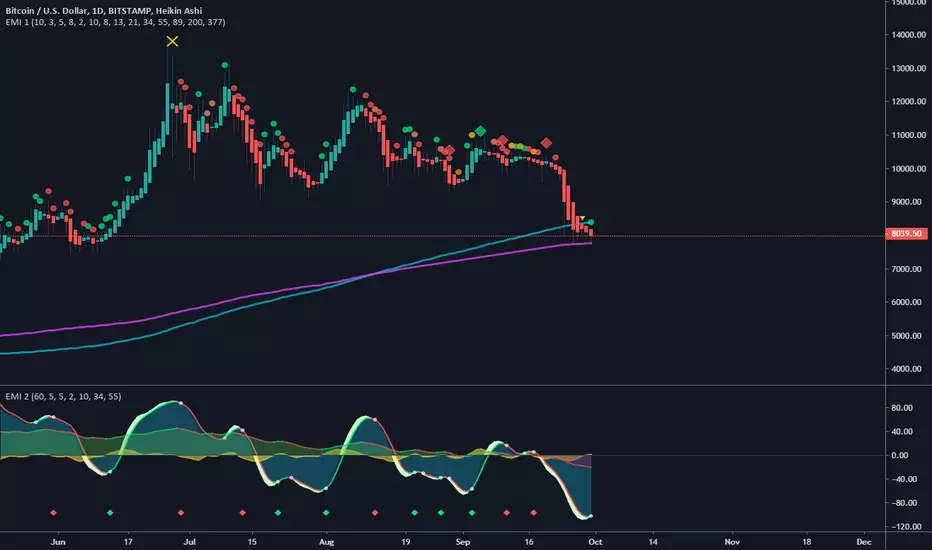
(EMI 1) Epic Market Indicator v2.2Had to release a new version, due to house rules.
This indicator is usable for every market and I do suggest to use it in combination with EMI 2.
Green = buy/long, Red = sell/short
Orange = Price action divergence/convergence.
Yellow X = Manipulation, you might to be careful when you see this, most of the time dumps happens afterwards.
Always wait for the candle/bar to close and if possible wait for another confirmation. No confirmation most of the time means, trend continuation.
Diamonds are the strongest signal, you might want to to buy/long or sell/short when you see this signals.
Cirles/Dots are trend continuation, shows which way the trend. More of the same color in a row the stronger the prediction. But once you see an orange colored signal then it's possibly going to diverge.
Longer the term/period the more accurate prediction signals will be.
You can enable/disable other tools in the settings:
EMA's, SMA , Bollinger Bands and Pivots .
But also trend colors
Setup your own configurations the way you like. I recommend using Fibonacci seq . Keep in mind, sooner the prediction signals become the more riskier.
update:
- Added bollinger bands with trend color. You can disable or enable this in the settings.
- Modified manipulation conditions.
- Modified buy and sell conditions.
[astropark] Long-Short Strategy V2 [alarms]This indicator is not an holy grail, but it is an amazing trend finder and works nicely between 30m and 4h timeframes :)))
This is a modified version of the following strategy:
After the great success of V2, as a lot of people around asked me about, I decided to publish a new version which will let you set alarms on Buy and Sell , so each time a signal is triggered you will be notified accordingly and FAST!
HOW TO USE THIS INDICATOR
Buy/Long at next candle's open price when you see a green "B" label on the chart , trying to buy as low as possible near or below the green cloud, considering it as moving support for more buys/longs. The bigger the cloud, the stronger the bull-trend and so the stronger the support.
Sell/Short at next candle's open price when you see a red "S" label on the screen , trying to sell as high as possible near or over the red cloud, considering it as moving resistance for more sells/shorts. The bigger the cloud, the stronger the bear-trend and so the stronger the resistance.
Keep in mind that the lower the timeframe you work on, the easier is the trend to change rapidly, so always set a -2% / -5% stop-loss on trades and follow the trend with a good trailing stop strategy . If you need help, just send me a direct message.
This is not a free indicator, so send me a private message in order to get access to this script .
Do you like my scripts? Offer me a coffee, a beer, a pizza or whatever :)
BTC jar: 1K5kuYQPEqoNo6GRmJbHWMPmqwKM5S3oRR
ETH jar: 0x091b541a6dd6fe08c4e7bd909baafb2fce9b975e
LTC jar: LSVoAChsZrVsvbNyUfdpxtFpDAUSaUTUig
XRP jar: (XRP deposit tag) 103997763 (XRP deposit address) rEb8TK3gBgk5auZkwc6sHnwrGVJH8DuaLh
PS: Do you need a customization or do you need a dev who implements your strategy? send me a private message ;-)

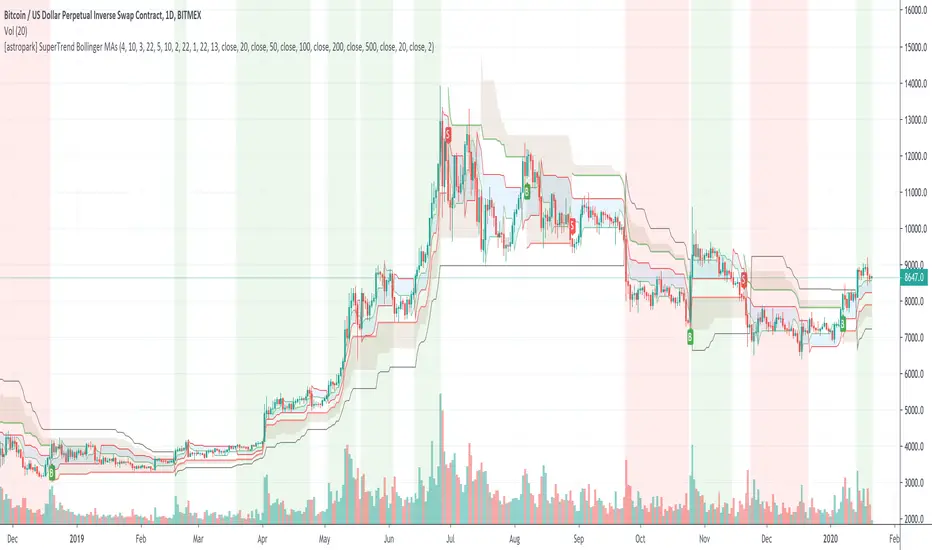
[astropark] SuperTrend Bollinger MAsHi Followers,
here it is a new script, based on SuperTrend indicator!
As plus you will be able to activate Bollinger Bands and 6 simple moving averages.
What's the SuperTrend?
As you can see from the chart, the SuperTrend Indicator
defines moving support & resistance levels for price action with its clouds and trendlines
catches trend changes when black line (the Slow SuperTrend) switches from staying upper price action to down and viceversa
shows you on background bearish momentum in red
shows you on background bullish momentum in green
This is not a free indicator, so send me a private message in order to get access to this script.
Do you like my scripts? Offer me a coffee, a beer, a pizza or whatever :)
BTC jar: 1K5kuYQPEqoNo6GRmJbHWMPmqwKM5S3oRR
ETH jar: 0x091b541a6dd6fe08c4e7bd909baafb2fce9b975e
LTC jar: LSVoAChsZrVsvbNyUfdpxtFpDAUSaUTUig
XRP jar: (XRP deposit tag) 103997763 (XRP deposit address) rEb8TK3gBgk5auZkwc6sHnwrGVJH8DuaLh
PS: Do you need a customization or do you need a dev who implements your strategy? send me a private message ;-)
RYNO
Welcome to RYNO! One of the best all-around indicators that you will find. RYNO is capable of being used on any chart. From the 1m, 3m, 5m time frames all the way up to the D chart. Heikin Ashi candles are preferred for the most accurate signals.
BUY/SELL signals represent your move... it's up to you to pull the trigger. Set your alerts and automate this indicator.
Back tester is also available by request.


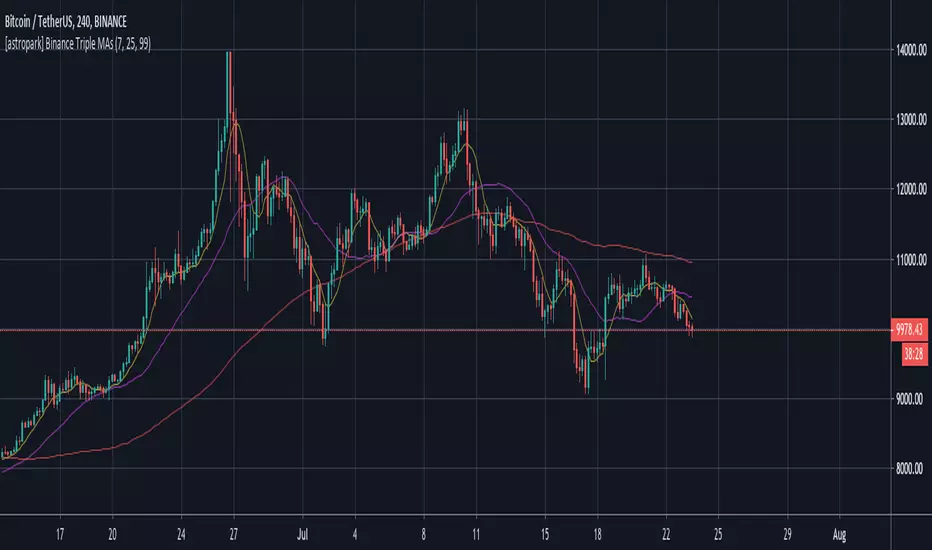
[astropark] Binance Triple MAsDo you miss Binance basic MAs series on your trading view chart?
Enjoy!
Oversold/Overbought RSI backgroundOften a background color is way better of an indicator.
Now you can directly see in your chart when price is in Oversold (red) or in Overbought (green), based on RSI analysis.
Enjoy!

[astropark] 21 days EMAAre you tired to edit you EMA indicator to fit the 21-day settings for your timeframe?
Now you have it for free!
Enjoy!

