[astropark] Renko RSI divergencesDear Followers,
today a new great Scalper Tool , which works excellent from 1 minute timeframe Renko chart , which is the best and more secure timeframe to use on a Renko chart. But of course it works great on all timeframes (included the 1D timeframe)!
This tool has some cool features:
it works on all timeframes , starting from 1 minute: so you can enjoy high-frequency trading by using a 24/7 running bot and a proper money and risk management strategy;
it shows you both bullish and bearish divergences with a triangle up or down respectively
when it finds a strong bullish/bearish divergence , a flag will be displayed instead of a triangle
This script will let you set all notifications you may need in order to be alerted on each triggered divergence.
You may like to use it together with my Renko Scalper V2
On Bitmex/ByBit/Binance Bitcoin/USD chart best settings is Traditional Renko chart with 10$ box size, while 0.5$ box size is suggested on Ethereum/USD pair.
This is a premium indicator , so send me a private message in order to get access to this script.
Buy

Bull MountainsAre you a BEAR?
Then get out of here!
This indicator is only for long movements, its reading is simple and if you use it correctly it will give you very good results, the components are:
The highest quality configuration is as follows:
It is not necessary that all the components are aligned, the appearance of the upper mountain on the lower mountain is already a good sign, but if you add some seasoning more the soup will be better =)
Note: once the position is taken, it is the trader's responsibility to manage it. INSTRUMENTS WITH REAL VOLUME ARE REQUIRED FOR THIS INDICATOR.
tip: what would happen if you look for the signal in an upper frame and then look for an input in a lower frame? mmmmm....
tip: play with the 'Length' setting and see what happens
Bull a thumbs up please!
I wish you many greens !!

Peakestsignal Indicator - Valuetrading Indicator - Cheap Entry'sPrivate indicator.
HI BIG PLAYERS
Are you looking for the cheapest entry signal for trading?
This indicator gives the really cheaply entry signals. For buysignals you get a green background vertical line and for sellsignals you get a red background vertical line.
If you have a trend strategy and only need THE TREND for trading: believe me, this indicator give you the right signals.
Alerts are possible with the TradingView Alertsystem.
More examples of another markets:
HOT TO GET ACCESS: looking on below signature.
Kind regards
NXT2017

Bollinger Bands on MacdOnly longs when Macd line is above Bollinger Band and shorts when Macd line is above Bollinger Band, this will avoid many problems.
thumbs up!!!

Climatic Volume X- Climate volume detection
- Relative volume value in bar
- Automatic zone generation (possibility of configuration)
- Additional features
¡¡¡Thumbs up¡¡¡
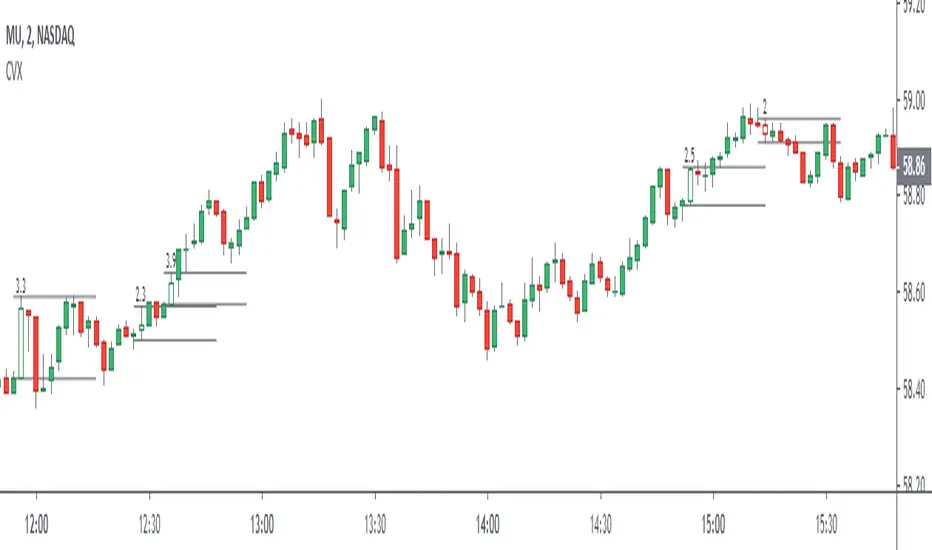
Elephant Bar by Oliver VelezThis script detects an event created by Oliver Velez, basically it is a wide-range candle, its range is noticeably larger than the previous candles, this event indicates a possible continuation of the movement, or the beginning of an extended movement. The candle has to be of good body, as a rule it can be taken that the body must be more than 70%. The stop goes below the minimum of the candle and the signal is given when the next candle followed by the elephant candle exceeds its body, this condition is not programmed so that the alert indicates that an elephant candle was generated and the trader has some time to visualize the graph and wait for the signal. Example below:
NOTE: IT IS VERY IMPORTANT THAT THE TRADER ANALYZE THE CONTEXT OF THE MARKET WHERE THE ELEPHANT BAR IS GENERATED AND DETERMINE ACCORDING TO ITS EXPERIENCE IF THE EVENT HAS A GOOD PROBABILITY OF PROJECTION, YOU MUST NOT TAKE AN ENTRY ONLY BY THIS EVENT, IF YOU DO YOU WILL LOSE ALL YOUR MONEY
.
One of the problems of the elephant bar is that it generates a fairly wide risk unit with respect to other narrow range events, so the risk / benefit ratio is not very large, but it is an event that deserves attention when it occurs in a good location since it generally generates continuation.
If you want to have a lower risk unit and improve the risk / benefit ratio, you can play the “Gift Zone”, when detecting an elephant bar you can wait for a step back inside the elephant bar area and take a position, this will give you a less distance to the stop, but this can lead to the event escaping if there is no recoil.
- The size of the candle is determined by comparing a range of previous candles (you can set the amount at your discretion)
- Search factor: by default 1.3, this means that all bars that have a range greater than the average range of previous candles + 30%, are considered elephant candles (can be configured at your discretion)
- Possibility to configure the percentage of the body that the elephant candle must have.
- Possibility of filtering up to 2 means with direction detection and color change (fully configurable)
- Possibility of filtering by mobile averages
- Alerts
- Additional features
Thumb up if you liked me ..

Ace Pro Long Indicator - 1 Minute BTCUSD Bitcoin ChartThe Ace Pro Long Indicator calculates overbought and oversold conditions.
It focuses on momentum to identify whether the market is overbought or oversold.
If it detects that the market is oversold, it gives an alert of “long entry”
If it detects that the market is overbought, it gives an alert of “long exit”
Users are also able to set notifications on Tradingview with this version of the indicator.
To set an alert, after adding the indicator, at the top left of the chart where the indicator is listed, click on the "more" option (three dots), and then select "Add alert."
Please note the following:
The Ace Pro Long indicator is designed only for use on the 1 minute Bitstamp BTCUSD chart.
It is only to be used for opening and closing long positions.
It is not recommended for use with short positions.
It is not recommended for use with time frames other than the 1 minute.
In a sideways market, or during a violent move, it is likely to produce false signals.
Traders must use confluence from their technical analysis to enter trades.
Because this is an invite only script, users with a free Tradingview account will not be able to obtain access.
Traders must use confluence from their technical analysis to enter trades.

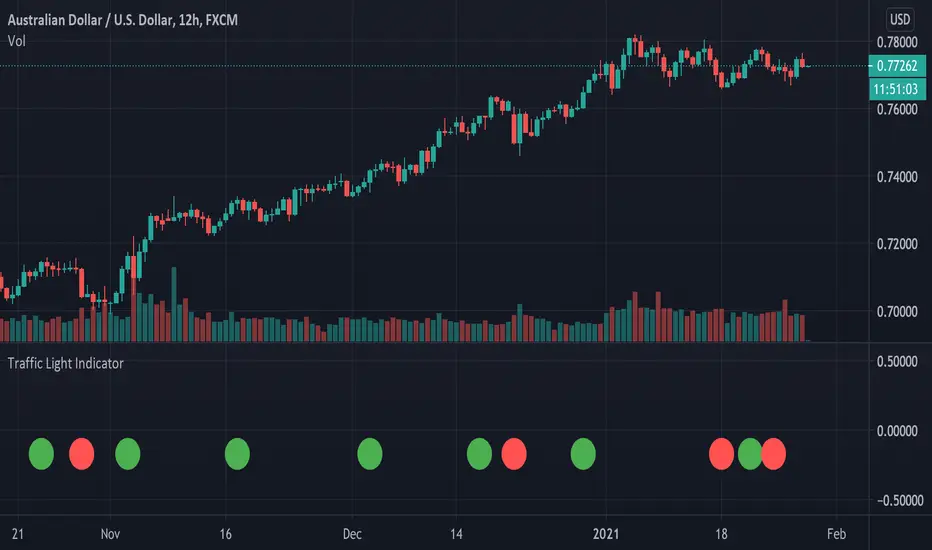
Traffic Light IndicatorThe traffic light indicator is designed to be as simple as possible to avoid the steep learning curve that comes with many other indicators.
- A Green Circle indicated the price is likely to go up.
- A Red Circle indicates to price is likely to go down.
- A Yellow Circle means there's some indecision and you should consider tightening stops or taking profits if you're already in a trade.
The circles are derived from the combination of a dozen or so indicators with the goal to simplify trading and declutter the charts.
It doesn't need to paired with another indicator but having some simple moving averages and keeping an eye on the volume might help you identify possible take profit areas.
MFI/RSIThis is a simple study that combines MFI and RSI and provides buy/sell alerts.
The red lines are MFI.
the blue lines are RSI.
Boundries are colored as the indicators and are user configurable.
Black triabgles are buy/sell points when both MFI and RSI are overbought/sold.

Market Thrust IndicatorThe Market Thrust indicator is a powerful measure of the stock market's internal strength or weakness. There are four components to this indicator:
1-Advancing Issues on the New York Stock Exchange (NYSE) – $ADV
2-Advancing Volume on the NYSE – $UVOL
3-Declining Issues on the NYSE – $DECL
4-Declining Volume on the NYSE – $DVOL
The formula for Market Thrust is given below:
($ADV x $UVOL)-($DECL x $DVOL)
When used for day-trading, the trend of the Market Thrust indicator is what is most important.
Rising Market Thrust Indicator: Considered a bullish sign; can act as a confirmation signal when combined with a rising stock, index ETF, or stock index future's price.
Falling Market Thrust Indicator: Considered a bearish sign; can act as a confirmation signal of a decreasing market price.
The Market Thrust indicator could be used for detecting divergences in trends. Divergences occur when:
- Price is trending higher, but the Market Thrust indicator is not moving higher or is even going down.
- Price is trending lower, however, the Market Thrust technical analysis tool is not trending lower, it is either not trending or is trending higher.
Add a fully configurable trend line over MTI.
Read more at: commodity.com

Leledc Exhaustion Bar V4 PLUSLeledc Exhaustion Bar indicator created by glaz converted to Pine 4, plotshape was added.

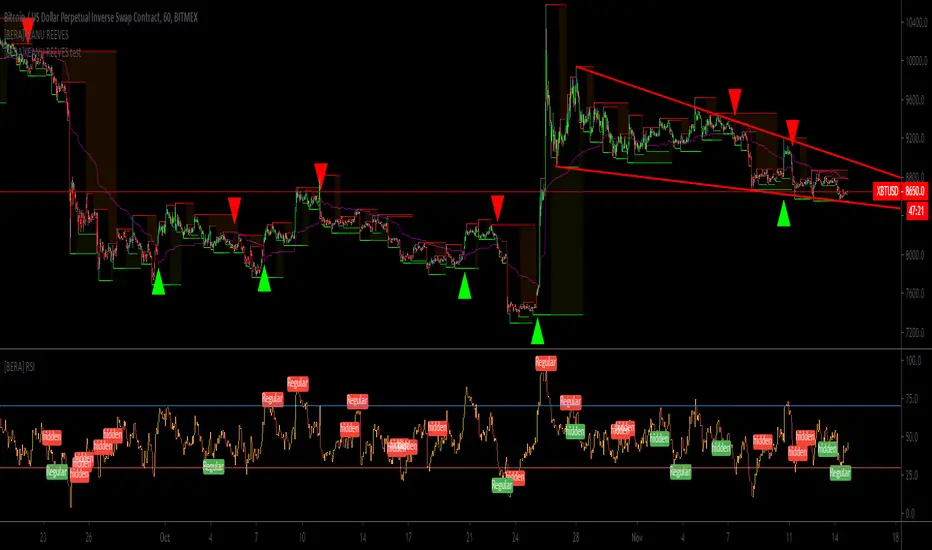
[BERA]KEANU REEVESThis is BUY/SELL indicator integrated with support and resistance (HIGH AND LOW).
THIS IS ONLY FOR TESTING PURPOSES(SOME PEOPLE ASKED ME A TRY), I WILL REMOVE IT.
Indicator based on Average true range .
LIME ARROW = LONG
RED ARROW = SHORT
LIME COLOR BARS IF GREEN ARROW CONDITION VALID.
RED COLOR BARS IF RED ARROW CONDITION VALID.
>CURRENT SETUP OF METRICS IS IDEAL FOR BTC H1 CHART, FOR ALTCOINS YOU SHOULD USE DIFFERENT METRICS,
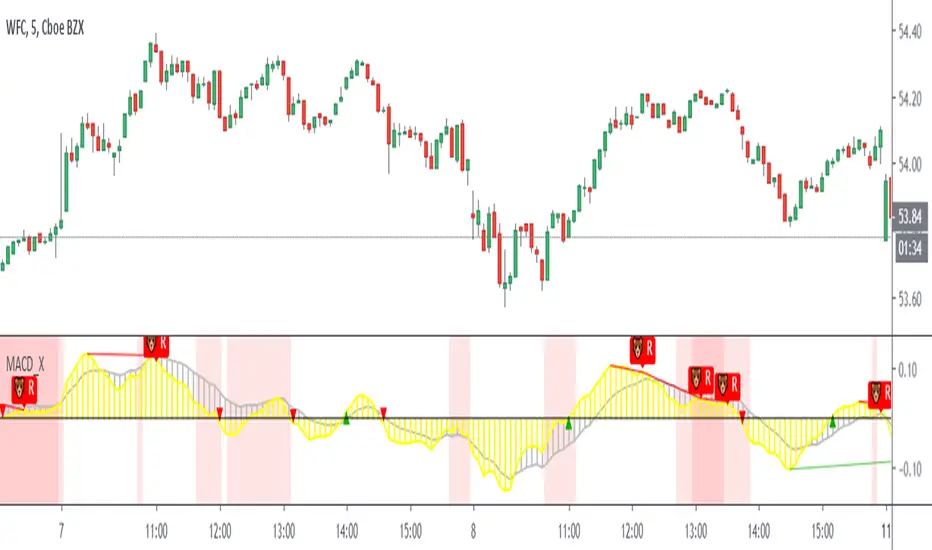
Double MACD Buy and SellIndicator for strategy that was used in a Forex competition and was a winner. Use double MACD with custom settings, search video on YouTube:
Learn Five Powerful MACD Trading Strategies
Add some tools to analyze the market context a little more:
- Detector of regular and hidden divergences.
- Atlas Zone (detects consolidation that is about to generate a movement)
- Choppines zone configurable (detects if the market is stable or not)
Visualization of entries in trend and counter-trend according to the rules described in the video.
Buy and sell alerts.
Note: I do not recommend using only this indicator as an investment strategy, it is another tool that must be complemented with a market study by the trader.
🐳 Whales 🆚 Little Fish 🐟THIS INDICATOR DETERMINES WHAT THE STRONG HANDS AND WEAK HANDS ARE DOING, BASED ON THE FAMOUS INDICATOR "KONCORDE", OBTAINED FROM THE PERCENTARY VARIATION OF THE INDICATOR IVP (POSITIVE VOLUME INDEX) AND IVN (VOLUME INDEX). ANYONE READING THE AVAILABLE DOCUMENTATION ON THESE TWO SMALL MATHEMATICAL JEWELRY WILL DISCOVER THAT THE ATTRIBUTED VOLUMES NEGOTIATED TO STRONG HANDS (IVN) OR WEAK HANDS (IVP).
NOTE: USE THIS INDICATOR ONLY IN INSTRUMENTS WITH REAL VOLUME.

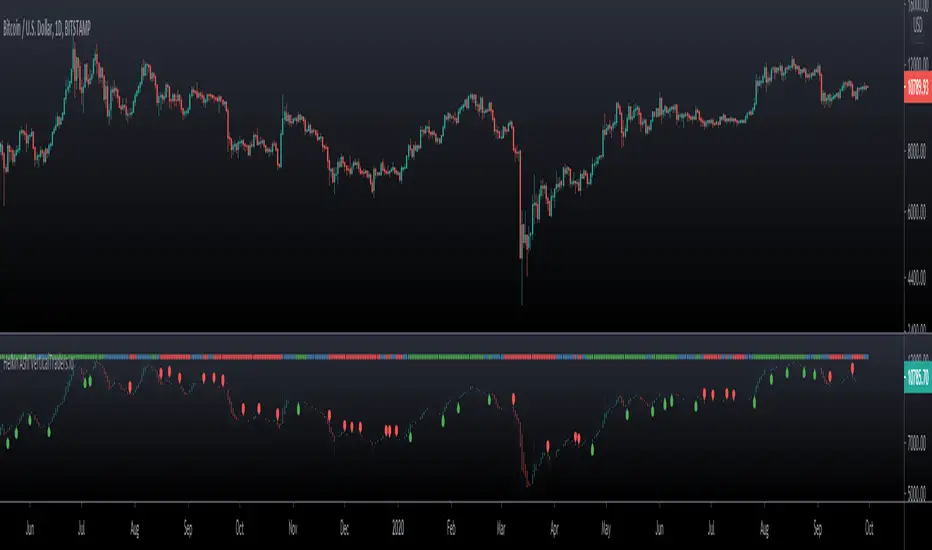
Hash RibbonsBuying during Miner Capitulation yields wonderful returns.
The best buy signals occur on Hash Rate "recovery", and when price momentum is also positive.
Historically, this strategy has yielded average returns to cycle peak of >5000%, with max Drawdown of -15%.
Follow me to learn more about this indicator.

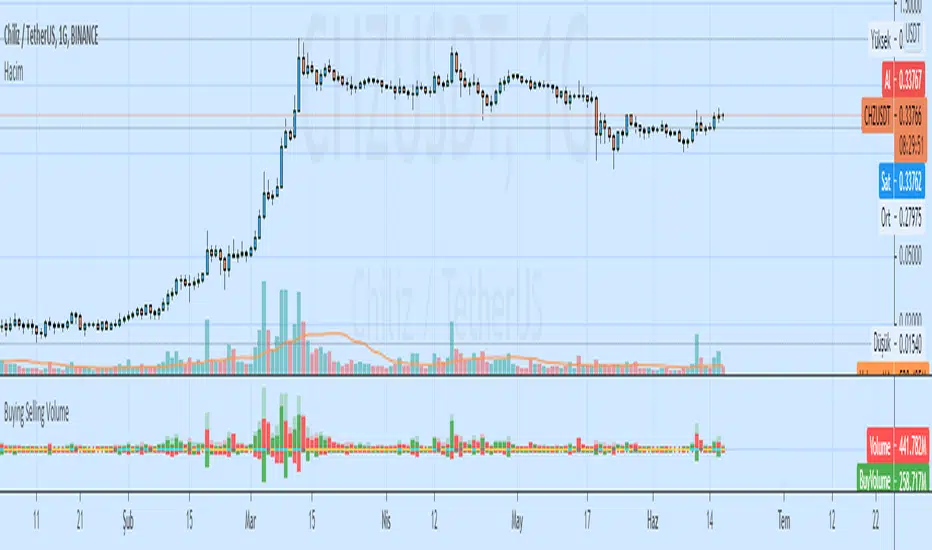
Buying Selling VolumeBuying Selling Volume
-Buy Volume
-Sell Volume
-Buy Volume Percent %
-Sell Volume Percent %
-Volume Index
-Buy Sell Volume-
BuyVolume>SellVolume=Blue barcolor
SellVolume>BuyVolume=Purple barcolor
-Volume Index-
VolumeIndex>length and close > open =Cyan barcolor
VolumeIndex>length and close < open =Gray barcolor
VolumeIndex<=length = Yellow barcolor
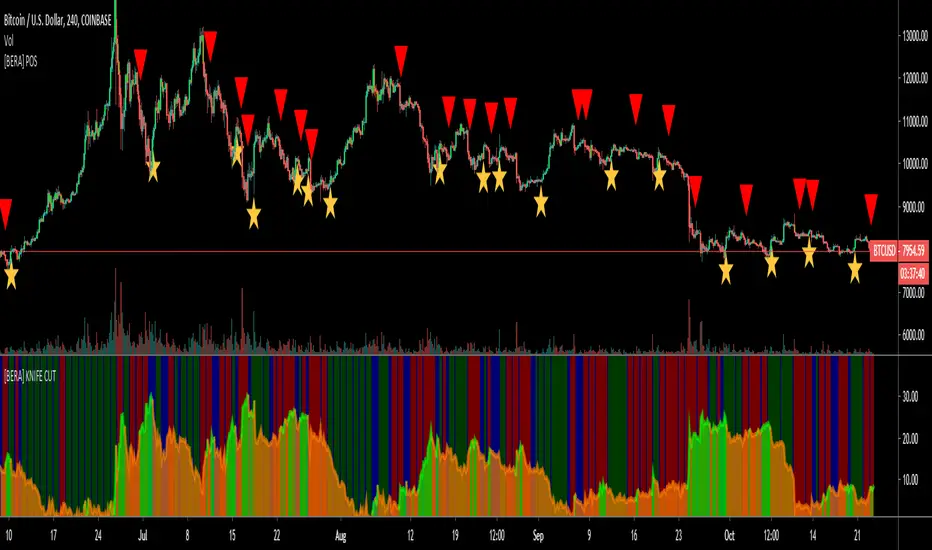
[BERA] PILE OF SIGNALSHey bulas and beras, another indicator for help your decision.
Ok lets start.
PILE OF SIGNAL, i admit the last word of the title was a bad word and changed to avoid permaban ok lol ahah.
Description= this indicator use moving averages crosses and volume as decision point, what mean this? simple when a move is coming this indicator will show you the probable "direction" of next move. these signals are not buy and sell, also because multiple signals can occour, you should use it with you own TA.
-Moving Averages
-Crosses
-Volume
RED ARROW ABOVE BAR= PROBABILITY OF DOWN MOVE INCOMING
STARS BELOW BAR= PROBABILITY OF UP MOVE INCOMING
Simple.
Heiken AshiHeikin Ashi charts are similar to candle charts, but the main difference is that a Heikin Ashi chart uses daily price averages to show the movement of the average price of an asset.
The idea is to use the heikin Ashi technique as an indicator and not as the main chart, to avoid enter or exist the market too late.
Key concepts:
- The averaged open and close help filter some of the market noise, creating a chart that tends to highlight the trend direction better than typical candlestick charts.
- The downside is that some price data is lost with averaging. The most recent price (close) may not reflect the actual price of the asset, which could affect risk.
- Long down candles with little upper shadow represent strong selling pressure. Long up candles with small or no lower shadows signal strong buying pressure.
Extra functions in this indicator:
- Trend Bar indicator, uptrend(green), downtred(red), warning or indecision (yellow).
- Long and Short Labels base on trend and Heikin Ashi entries.
- Change the color of the main chart Candlesticks as the Heikin Ashi indicators.
- Alerts for long and short entries.
- Size of Labels.
Bollinger BandsBollinger bands are calculated from a moving average, creating two curves that involve the price chart, these bands are defined by a standard deviation generally of value 2 with respect to the moving average.
Applications:
- They show the volatility of the market, when the bands are compressed, the volatility decreases, when the bands extend, the volatility increases.
- Trend, with respect to the moving average according to the location of the price corresponding to the positive or negative standard deviation.
Extra functions in this indicator:
- You can use several types of moving averages for the calculation: SMA, EMA, DEMA, TEMA, WMA, VWMA, HullMA, TMA, SMMA, SSMA, etc.
- Background: Shows the zone equivalent to a standard deviation of 1 and 2 with different color.
- Log chart: It can be used on logarithmic price scales, to avoid distortions in those charts.
- Multimeframe: so you can visualize the behavior in different timeframes without changing timeframe.
- Interpolation: Round the curves when viewing larger timeframes.
Multitimeframe example: 1D, select timeframe to Bollinger bands 1W and log chart
Same chart with interpolation

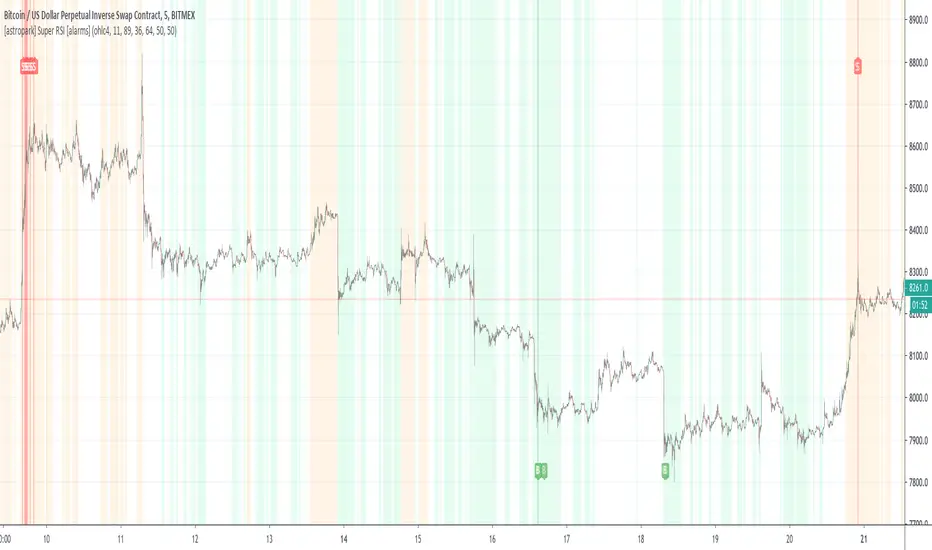
[astropark] Super RSI [alarms]Dear Followers,
today a new Scalper Tool , which works great on 3 minutes and 5 minutes timeframes , but also down to 1m and up to 30m!
I called it " Super RSI ", as it is based on RSI and inherits some basic functionality from it.
If you check its settings, you will see that you can have 3 different buy-sell sources (first two are active by default):
STRONG BUY/SELL : buy when white area deeply falls into oversold-red zone and sell when white area gets into overbought-green zone (you can set and edit at which level oversold and overbought zones start);
CROSSES : buy when the black RSI line in the middle between red and green area cross under the buy cross limit value and sell when it crosso over the sell cross limit value (you can set and edit specific cross ranges for both buy and sell);
WEAK BUY/SELL : buy when green area at least go below 50 level and sell when red area at least goes above 50 level (you can edit both levels); these conditions are highlighted as background color and are very useful for taking (at least partial) profits in trades.
By default the script will be placed as overlay on the chart, but
> you can activate the oscillator plot by disabling the "hide all plot" option
> and place it in a below pane by clicking on the black arrow at then end on the indicator name in chart and selecting "move to -> a new pane below"
This strategy can trigger till 10 buy or 10 sell signals in a row before reverting, so use a proper money management .
Strategy results are calculated on 20 trading days using 1000$ as initial capital and working at 10x leverage.
The user who wants to use this strategy, especially via an automated bot, must always set a stoploss at 3-5% from entry point or use a proper risk management strategy .
This is not the "Holy Grail", so use it with caution.
This script will let you set all notifications you may need in order to be alerted on each triggered signals.
The backtesting script version of this indicator, which will let you backtest this script and find best settings for your preferred market, can be found here below:
This is a premium indicator , so send me a private message in order to get access to this script .
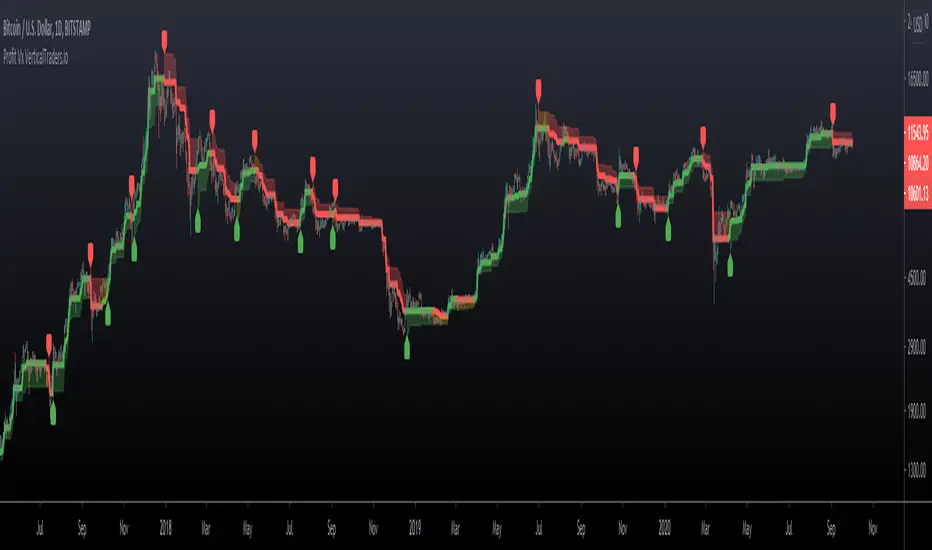
Profit VxProfit Vx
- Labels for Long and Short entries
- Take Profit point base on %
- Candlestick color, orange is warning or not trending zone
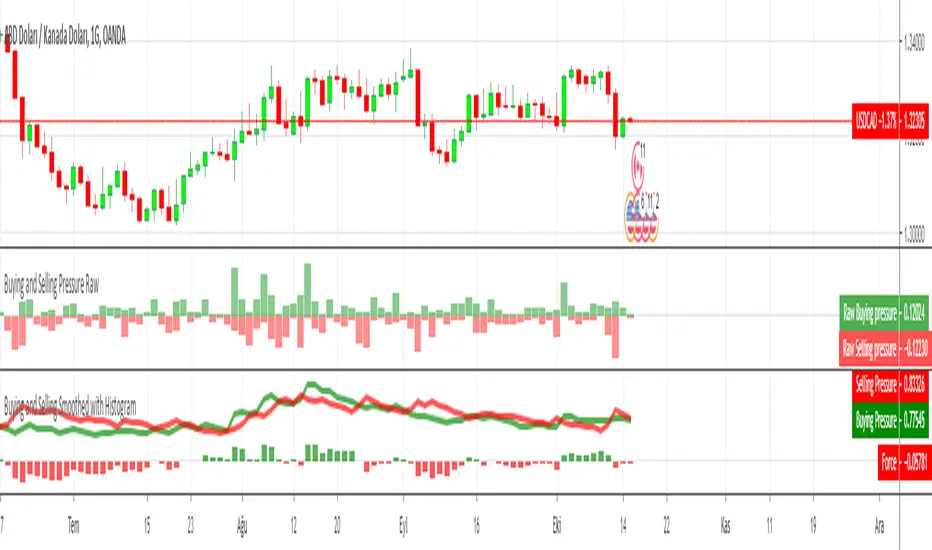
Buying and Selling Pressure RawBuying and Selling Pressure Raw
Raw Buying and selling pressure Indicator. The Raw buying and selling indication is provided in terms of a Columns.
Green bars above zero show the buying pressure and the red bars below the zero line show the selling pressure.
This presents a good visual representation of the dominating pressure.
[BERA] Momentum AvgHey BULAS & BERAS!
Momentum Avg is my new creation.
Simple trend following script using Momentum and Moving Average criterias.
Work with every timeframe. Hope you like ok
GREEN BARS = UPTREND
RED BARS= DOWNTREND
LIKE it because i am a member of bera council ok, like my hard work.
